
AI writes code in seconds, but delivery still takes days
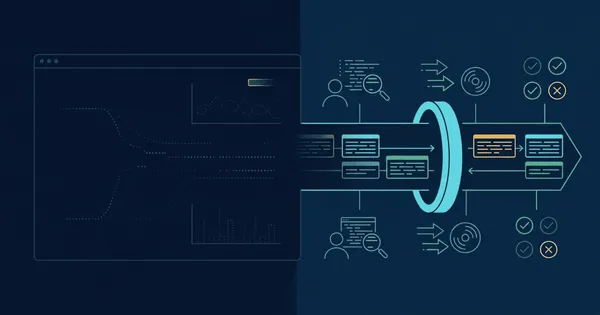
AI pushed throughput up 59%, yet median delivery got worse. The bottleneck moved to validation. How replaying production traffic in CI closes the gap.
Browse 25 posts in this category
AI pushed throughput up 59%, yet median delivery got worse. The bottleneck moved to validation. How replaying production traffic in CI closes the gap.

The trace was sampled out. I found the bug anyway — by filtering recorded traffic on the customer's email instead of a trace ID. Here's how to follow one request across four services with no trace IDs and no OpenTelemetry.

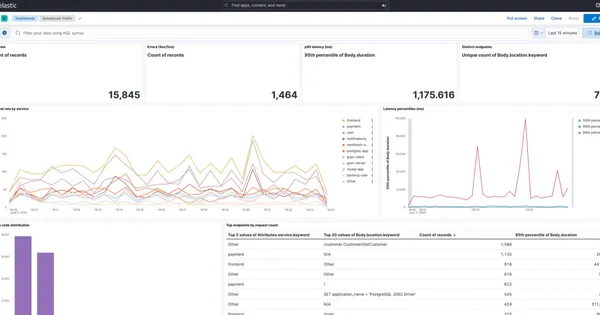
Metrics, logs, and traces were built for humans and cheap storage. AI inverts both assumptions, and the next maturity level is a deterministic replay sandbox.

Logs, metrics, and traces are a lossy compression of production. Five things you can do with a traffic data lake that observability can't.
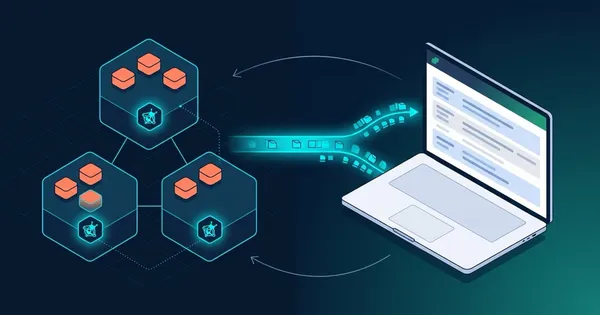
Capture production traffic and store it in your own Elasticsearch with Speedscale BYOC. Pull it locally with es-gather.py and reproduce bugs with proxymock.
A Kubeshark alternative that goes beyond observability. Stream live cluster traffic into proxymock, then replay or mock it locally from your laptop.
Export recorded proxymock traffic to Datadog Synthetics in one command. Auth headers redacted, global variables created. No scripting, no flaky journeys.
UI synthetics only tell you something is broken. Traffic replay per microservice isolates failures before any human walks up. Zero scripts required.
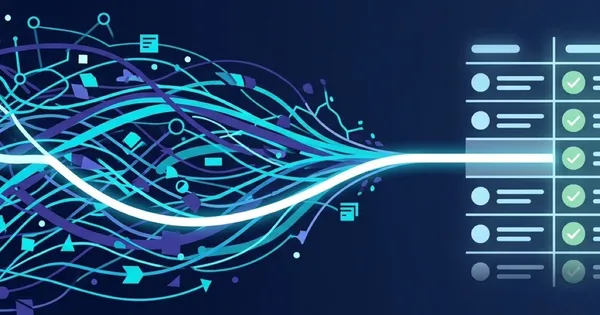
Trace-based testing uses OpenTelemetry traces as replayable test input so CI catches production regressions before deploy, not after incident review.