The Pod Was Cheaper. The Service Wasn’t.
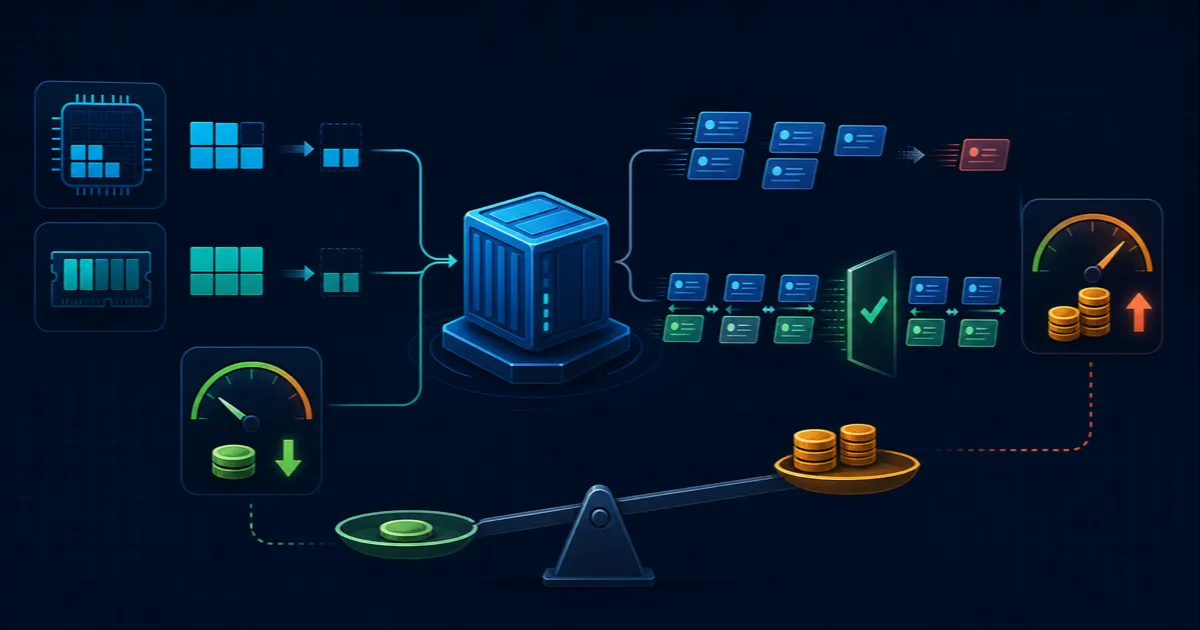
A smaller Kubernetes pod can lower allocation cost while completing less work. Green status codes and matching schemas can hide it.
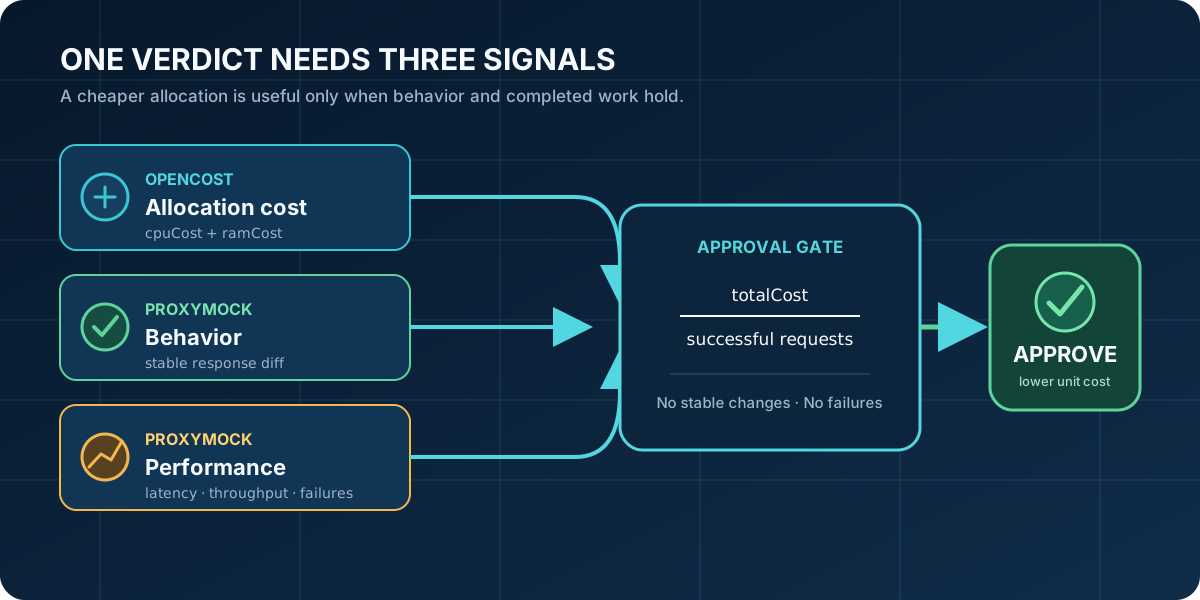
This walkthrough combines OpenCost allocation data with proxymock behavior and performance evidence. A candidate passes only when behavior and throughput hold while unit cost falls.
Chargeback needs a denominator
Enterprises split Kubernetes costs across products and cost centers. The FinOps Framework says allocation supports showback and chargeback and can use labels and utilization data. Bad sizing makes product teams absorb idle capacity or hides waste centrally.
Cut requests too aggressively and the opposite happens. The bill falls while customer-serving capacity falls faster. That distorts budgets, forecasts, internal prices, and which services appear efficient. The FinOps Foundation recognizes cost per service request as a unit metric:
allocation cost per successful request = allocation cost / successful requestsOpenCost supplies the numerator; proxymock supplies the completed-work and behavior evidence. Together they turn a sizing proposal into an auditable input for production capacity and chargeback decisions, not a production savings forecast. Production chargeback must still reconcile discounts, commitments, idle sharing, bin-packing, and network or storage.
Prerequisites
- Docker Desktop running.
- minikube,
kubectl, Helm,curl, andjq. - Go 1.23+.
proxymockinstalled, initialized, and activated.- An MCP agent; this guide uses Codex.
- The Pyroscope walkthrough completed, with its validated CPU candidate in the working tree.
Build the local experiment
The companion lab uses deterministic malformed and duplicate records to expose behavioral regressions.
Clone the lab and enter the Pyroscope directory:
git clone https://github.com/speedscale/mock-lab.git
cd mock-lab/labs/pyroscope
The pinned lab charges $1 per CPU core-hour and $0.10 per GiB-hour. Storage and network are free.
Start the isolated cluster and cost stack:
make opencost-upIn another terminal, keep the local endpoints forwarded:
make opencost-forwardThe app is at port 18080, OpenCost’s API at 19003, and OpenCost MCP at http://127.0.0.1:18081/.
This workflow requires two MCP connections: proxymock over STDIO and OpenCost over Streamable HTTP. From the lab directory, add them to Codex:
codex mcp add proxymock -- proxymock mcp run --work-dir .
codex mcp add opencost --url http://127.0.0.1:18081/
codex mcp list
Keep forwarding during queries. See the Codex MCP setup guide; other agents can use mcp.example.json. New users should complete the proxymock MCP quickstart.
Give the baseline two witnesses
The baseline reserves one CPU and 2 GiB of memory. Apply it, then replay the functional contract:
make opencost-deploy-baseline
make opencost-functional-baseline
make opencost-load-baseline
The functional replay runs each request three times and rejects errors or stable-value mismatches. Status codes and schemas can still hide incorrect totals, missing records, or broken deduplication.
The load replay warms the service, aligns to a UTC minute, and runs two users for three minutes. Passing runs publish window.json.
Paste this into Codex:
Read proxymock/results/opencost/baseline/load/window.json. Set window to
file.start + "," + file.end and pass it directly to OpenCost MCP
get_allocation_costs. Never ask me for timestamps or alter the interval.

aggregate: "namespace"
step: "1m"
accumulate: true

For catalog-api, report start, end, cpuCost, ramCost, and totalCost. In
load/summary.json, select the endpoints entry whose url and method are
"-ALL-". From metrics, report
requests.succeeded, requests.failed, requests.per-second, and latency.p95.
OpenCost documents the MCP parameters and window format.
If data is absent, wait for Prometheus and repeat the identical query. Never widen the interval.
Let evidence reject the first candidate
My first candidate cut CPU to 500 millicores and memory to 256 MiB. Despite an 89 ms p95, CPU throttling collapsed throughput to 41.7 requests per second. Unit cost rose 18.6%. Rejected.
The final candidate kept the full CPU and reduced only the oversized memory allocation. Run the same evidence loop:
make opencost-deploy-candidate
make opencost-functional-candidate
make opencost-load-candidate
Then paste this comparison task into Codex:
Call proxymock MCP response_diff with:
- baseline-directory: ["proxymock/results/opencost/baseline/functional"]
- in-directory: ["proxymock/results/opencost/candidate/functional"]

Report every stable-field difference. Matching status codes or schemas
are not proof of correctness.

Read:
- proxymock/results/opencost/baseline/functional/summary.json
- proxymock/results/opencost/candidate/functional/summary.json
- proxymock/results/opencost/baseline/load/window.json
- proxymock/results/opencost/candidate/load/window.json
- proxymock/results/opencost/baseline/load/summary.json
- proxymock/results/opencost/candidate/load/summary.json

For each window file, set window to file.start + "," + file.end and pass it
directly to OpenCost MCP get_allocation_costs with aggregate="namespace",
step="1m", and accumulate=true. Never ask me for timestamps or alter the
interval. Select catalog-api; retain cpuCost, ramCost, and totalCost.

Compare functional failures, stable differences, p95 latency, throughput,
load failures, totalCost, successful requests, and
totalCost/requests.succeeded. Use each summary endpoint where url and method
equal "-ALL-".
Approve only if both replays passed, stable differences and failures are
zero, and cost per successful request decreased.
The proxymock MCP tools learn volatile fields and report differences in stable response values.
Good output is auditable
A good AI response looks like this:
Approved.
The payload-level response diff found no stable-field differences. One volatile field was correctly excluded as noise.
| Metric | Baseline | Candidate | Change |
|---|---|---|---|
| Replay passed | Yes | Yes | — |
| Functional failures | 0 | 0 | 0 |
| Stable-field differences | — | 0 | 0 |
| Load p95 latency | 57 ms | 58 ms | +1 ms |
| Throughput | 98.6830 req/s | 96.9218 req/s | −1.78% |
| Load failures | 0 | 0 | 0 |
cpuCost | 0.06666667 | 0.06666667 | 0 |
ramCost | 0.01333333 | 0.00166667 | −87.50% |
totalCost | 0.08000000 | 0.06833333 | −14.58% |
| Successful requests | 17,763 | 17,446 | −317 |
totalCost / requests.succeeded | 0.000004503744 | 0.000003916848 | −13.03% |
OpenCost windows were constructed directly from each file:
- Baseline:
2026-08-12T00:06:00Z,2026-08-12T00:09:02Z - Candidate:
2026-08-12T00:17:00Z,2026-08-12T00:20:01Z
Both replays passed. Functional failures, load failures, and stable-field differences were zero. Cost per successful request decreased by 13.03%.
Models propose. Traffic proves.
Cost models are useful, but they stop at a theory: this pod should be cheaper. They cannot show whether it will still handle the payloads, request mix, duplicates, malformed records, and concurrency that production sends.
Traffic replay turns that theory into an experiment. Replaying recorded production traffic against each candidate lets us measure behavior, throughput, latency, failures, and cost under the same request conditions. OpenCost tells us what the pod costs to allocate. proxymock tells us whether it still does the same work.
That is why the first candidate was a useful failure. The cheaper pod cost more per successful request. The approved candidate earned its savings with evidence we could defend in a sizing review, a chargeback meeting, and eventually production.
Pause, resume, or tear down
Skip this section during an uninterrupted demo. Return for teardown.
To leave midway, press Ctrl-C in the forwarding terminal, then pause:
make opencost-stopResume the cluster:
make opencost-upRestart forwarding in a second terminal:
make opencost-forwardStartup restores the baseline. If its measurement was interrupted, rerun:
make opencost-deploy-baseline
make opencost-functional-baseline
make opencost-load-baseline
For an interrupted candidate, run instead:
make opencost-deploy-candidate
make opencost-functional-candidate
make opencost-load-candidate
Missing load/window.json means an incomplete run. After comparison, press Ctrl-C in the forwarding terminal and remove the cluster:
make opencost-downHost results remain.