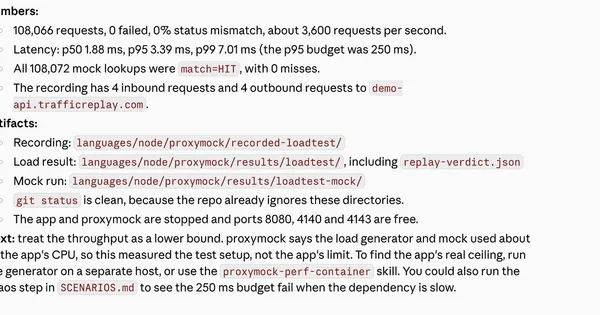
Holiday readiness: run your first load test with skills
Start holiday readiness with a local proxymock load test. Use agent skills to record a Node app, mock its API dependency, and inspect the results.
Browse 18 posts in this category
Start holiday readiness with a local proxymock load test. Use agent skills to record a Node app, mock its API dependency, and inspect the results.
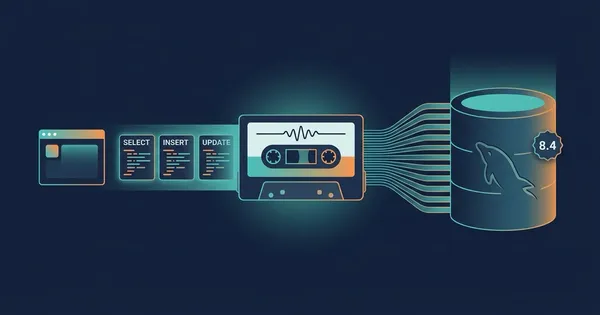
Replay your app's recorded MySQL statements against 8.4 to catch upgrade regressions, then load test the database with the same workload using proxymock.
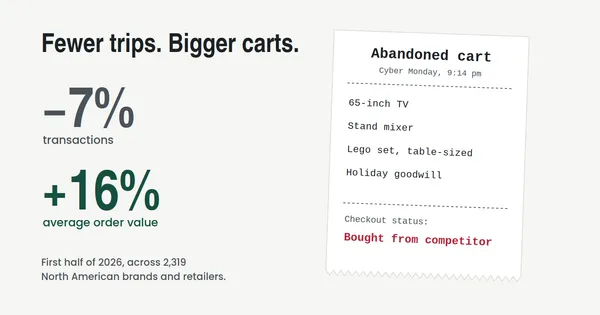
Prepare your checkout for Black Friday with production traffic replay, peak-load tests, and partner API failure rehearsals before the holiday code freeze.
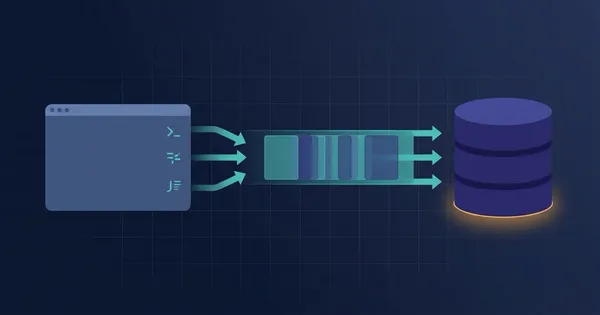
Replay recorded PostgreSQL queries to catch schema regressions and run realistic database load tests with proxymock, using the CLI or an AI assistant.
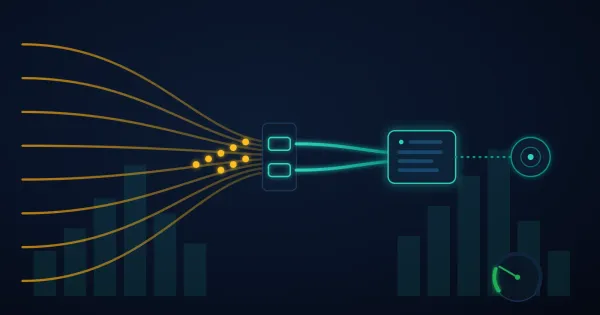
Diagnose a p95 latency regression that CPU profiling cannot explain using Prometheus histograms, then prove the fix with identical proxymock replays.
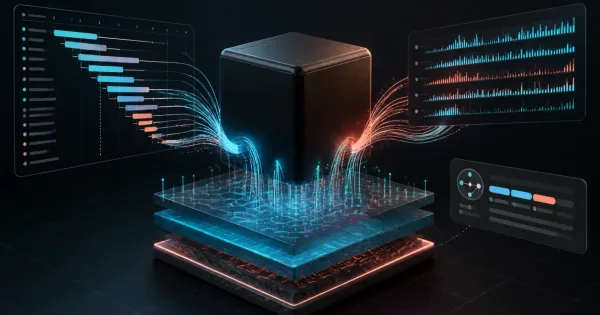
Discover endpoints, RED metrics, and traces in an opaque Kubernetes service with OpenTelemetry eBPF Instrumentation, then replay traffic with proxymock.

Diagnose serial N+1 API calls with Tempo and proxymock. Replay recorded traffic, inspect trace windows, and prove a concurrency fix preserves behavior.
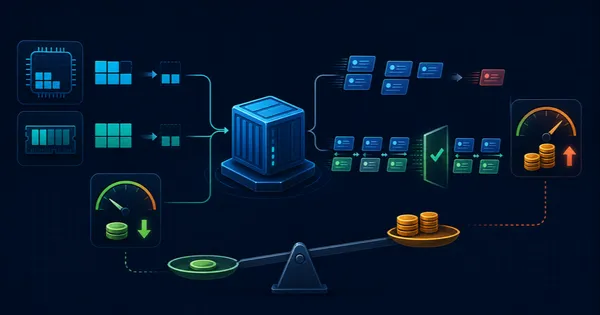
Use OpenCost and proxymock to prove Kubernetes rightsizing lowers cost per successful request without hiding behavior or throughput regressions in testing.
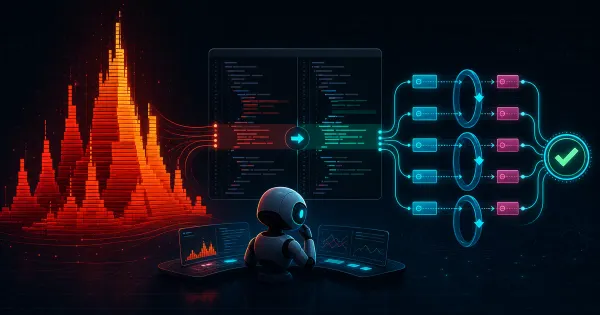
Use Grafana Pyroscope and proxymock with an AI coding agent to find a Go CPU hotspot, preserve API behavior, and verify the performance fix.
Choose the desktop proxymock or the hosted cloud trial to get started.