Diagnose Serial N+1 API Calls With Tempo + proxymock
One API request took 302 milliseconds. Nothing failed. CPU was mostly idle. The response was correct.
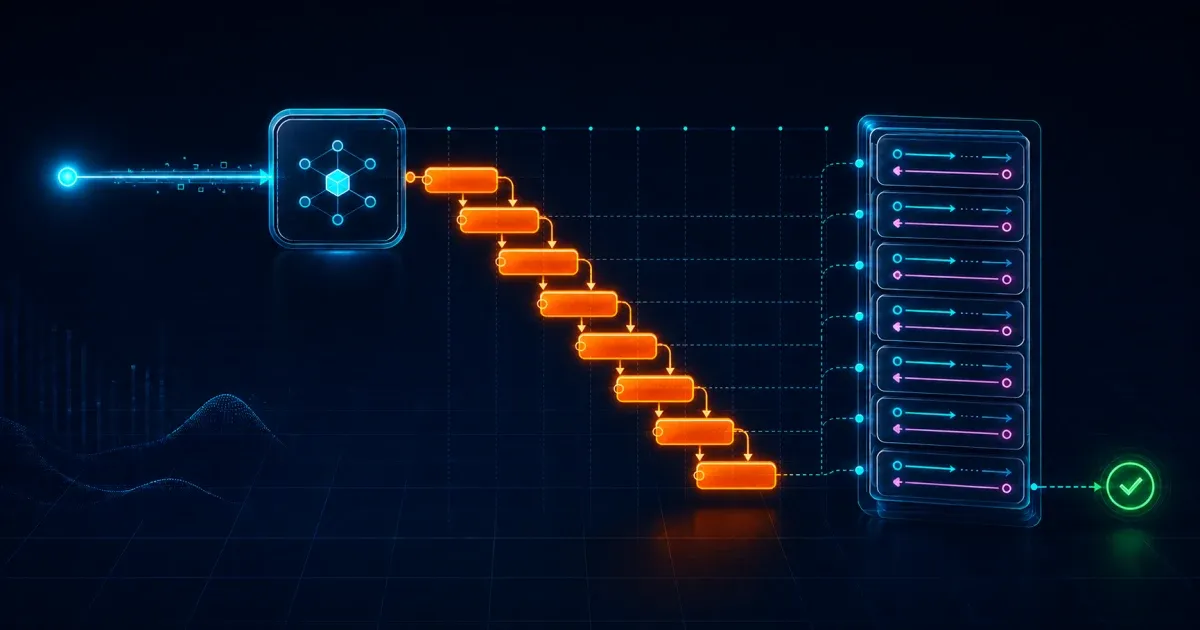
The trace made the problem obvious: eight inventory calls, each waiting for the previous one. But the trace could not tell me why the application made eight calls, or whether changing their execution would preserve the response. It showed the shape of the wait, not the input that created it.
This walkthrough gives an AI coding agent both halves of the explanation:
- Grafana Tempo shows eight non-overlapping downstream calls on one request’s critical path.
- proxymock preserves the inbound body with eight product IDs, records the corresponding dependency traffic, repeats the workload, and compares every stable response field after the fix.
The result is an auditable debugging loop. The agent sees the serial pattern, reads the input that caused it, adds bounded concurrency, and then has to prove that faster still means correct.
What you will build
The companion Tempo lab contains a small Go catalog API, a deterministic inventory dependency, a pinned Tempo and Grafana stack, and automated proxymock replays.
POST /api/catalog accepts eight product IDs. The baseline validates the input
and returns the correct aggregate, but it fetches inventory in a serial loop.
Each dependency response takes about 35 milliseconds. The eight waits become a
roughly 302-millisecond root span.
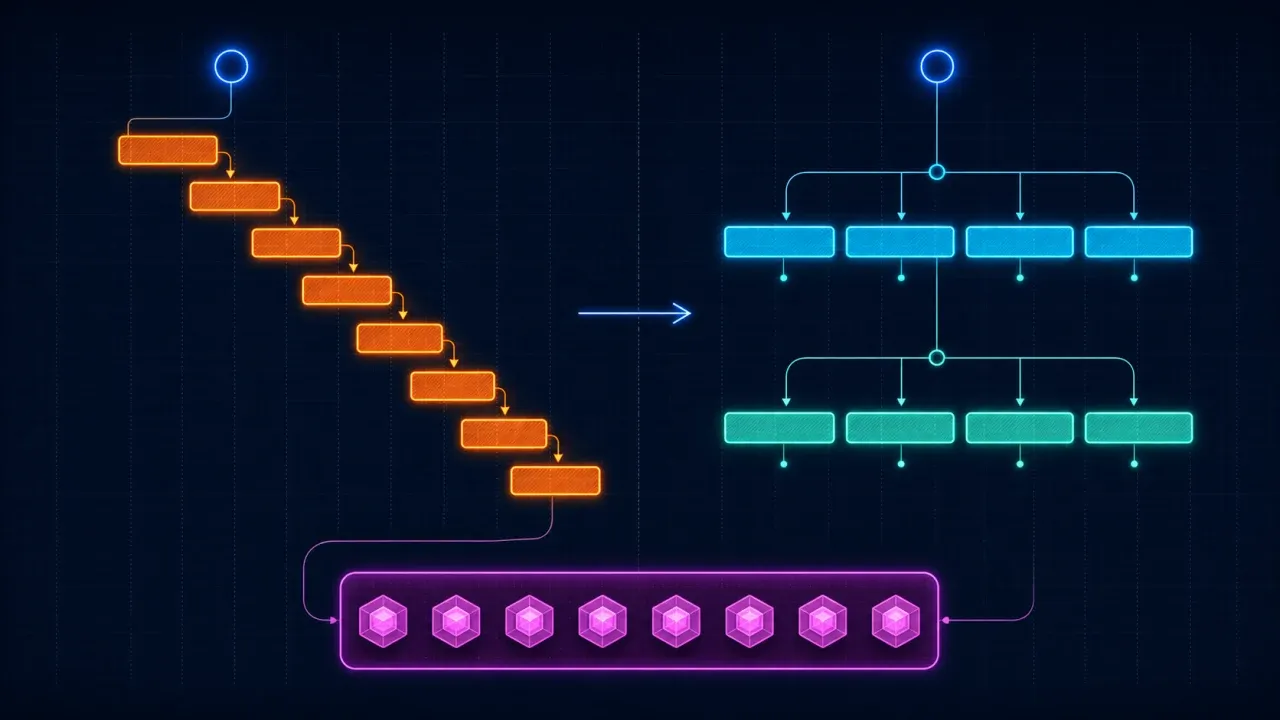
The intended fix allows four calls at a time while keeping results in request order. This is a serial fan-out problem, not a claim that every N+1 must be fixed with concurrency. If the dependency supports a batch API, batching often reduces both call count and critical path. This lab keeps the dependency contract fixed so the before-and-after response can use the exact same recorded traffic.
Prerequisites
- Go 1.23 or newer
- Docker with Compose
- proxymock 2.5.857 or newer, initialized and available on
PATH curlandjq- An MCP client with STDIO support; the commands below use Codex
The lab pins Tempo 2.10.0, Grafana 13.1.0, Grafana MCP 0.14.0,
OpenTelemetry Go 1.37.0, and otelhttp 0.62.0. The reference candidate pins
x/sync 0.16.0.
Install proxymock, initialize its local CLI, and clone the lab:
brew install speedscale/tap/proxymock
proxymock init
proxymock version

mkdir -p "$HOME/s2"
cd "$HOME/s2"
git clone https://github.com/speedscale/mock-lab.git
cd "$HOME/s2/mock-lab/labs/tempo"
The proxymock CLI quickstart covers Linux, Windows, and other installation paths.
1. Record the request that creates the pattern
Start the pinned observability stack and deterministic inventory dependency:
cd "$HOME/s2/mock-lab/labs/tempo"
make observability-up
make inventory
Grafana binds to http://127.0.0.1:3001; Tempo’s query API is on port 3200 and
its OTLP receivers are on 4317 and 4318. All published ports bind to localhost.
Grafana uses admin / admin only for this disposable lab.
In a second terminal, start proxymock recording around the application:
cd "$HOME/s2/mock-lab/labs/tempo"
make record RECORDING_DIR=proxymock/recording
In a third terminal, send the fixture through proxymock’s inbound port:
cd "$HOME/s2/mock-lab/labs/tempo"
curl -H 'Content-Type: application/json' \
  --data @fixtures/catalog-request.json \
  http://localhost:4143/api/catalog
Press Ctrl-C to stop make record and wait for proxymock to exit, then stop
make inventory. Do not leave the recorder wrapping the app: the replay phase
must start a new proxymock mock process. Confirm the recording contains one
inbound exchange and eight outbound exchanges:
find "$HOME/s2/mock-lab/labs/tempo/proxymock/recording" \
  -type f -name '*.md'
You should see nine RRPair files. Do not edit the application yet. The point of the next step is to make the recorded input explain the trace before the agent gets permission to propose a fix.
As an additional check—and a useful way to learn what proxymock recorded—open the capture in the local web UI:
cd "$HOME/s2/mock-lab/labs/tempo"
proxymock web --in ./proxymock/recording
In the browser, open the inbound POST /api/catalog exchange and a few of the
outbound GET /v1/inventory/{productID} exchanges. Inspect their request and
response bodies, headers, status codes, and timing, and confirm that the one
inbound request produced eight outbound lookups. This visual review complements
the file count and makes the recorded dependency pattern easier to understand.
Press Ctrl-C to stop the web UI before continuing.
2. Automate the baseline replays and timestamps
Start the application with the recorded dependency responses and no network passthrough:
cd "$HOME/s2/mock-lab/labs/tempo"
make mock RECORDING_DIR=proxymock/recording
Wait for proxymock to print mocking traffic sent from your app. The mock
exposes a readiness endpoint on port 4141. Both replay targets check that
endpoint and stop with a corrective message if make record is still running
or the mock failed to start. They also verify the catalog health endpoint, and
the functional target waits up to 30 seconds for Tempo’s /ready endpoint.
The local recording stores this fast loopback dependency at 1 ms precision, so
the target applies a fixed 35x timing multiplier. That brings each offline
call close to the dependency’s recorded wall-clock delay and creates a stable
serial critical path.
In another terminal, run the correctness replay and the four-VU load replay:
cd "$HOME/s2/mock-lab/labs/tempo"
make functional-replay \
  RECORDING_DIR=proxymock/recording \
  RESULTS_DIR=proxymock/results/baseline
make load-replay \
  RECORDING_DIR=proxymock/recording \
  RESULTS_DIR=proxymock/results/baseline
The Makefile records UTC immediately before and after each proxymock invocation
with RFC3339 nanosecond precision. It writes window.json only after a
successful replay:
~/s2/mock-lab/labs/tempo/proxymock/results/baseline/functional/window.json
~/s2/mock-lab/labs/tempo/proxymock/results/baseline/load/window.json
It also saves each replay’s machine-readable request metrics as summary.json.
There is no timestamp for you to note, copy, round, or paste. If a window file
is missing, fix the replay and rerun the whole target. Do not infer an interval
from file modification times.
Functional mode repeats the request three times and scores response behavior. It now fails unless there are zero failed requests and the stable response behavior matches 100%; a failed run publishes neither its summary nor its window. Load mode requires that functional gate, runs four virtual users for 30 seconds, and skips body scoring for throughput. The load result is performance evidence, never the correctness contract.
3. Configure the actual Grafana and proxymock MCP interfaces
Tempo 2.10 embeds a Streamable HTTP MCP server at /api/mcp. Grafana MCP 0.14.0
discovers that server through the provisioned Tempo datasource. It exposes the
datasource’s tools with the names tempo_traceql-search and
tempo_get-trace. Those are the runtime names; query_tempo and get_trace
are not the tools this stack exposes.
Add both servers from the lab directory:
codex mcp add proxymock -- proxymock mcp run \
  --work-dir "$HOME/s2/mock-lab/labs/tempo"

codex mcp add grafana -- docker run --rm -i \
  --add-host host.docker.internal:host-gateway \
  -e GRAFANA_URL=http://host.docker.internal:3001 \
  -e GRAFANA_USERNAME=admin \
  -e GRAFANA_PASSWORD=admin \
  grafana/mcp-grafana:0.14.0 -t stdio --disable-write \
  --enabled-tools datasource,navigation

codex mcp list
The static list is deliberately narrow and read-only. Tempo tools are proxied
by default and are not disabled by that --enabled-tools value. Grafana’s
proxied-tools documentation
describes the discovery path, while Tempo’s
MCP server reference
lists the embedded tools.
4. Make proxymock explain the trace before changing code
Paste this exact prompt into the agent:
Work in ~/s2/mock-lab/labs/tempo. Do not edit application code yet.

Call proxymock MCP search_local_traffic with:
{"in-directory":["proxymock/recording"],"direction":"in","method":"POST","query":"product_ids","limit":20,"offset":0}

Call it again with:
{"in-directory":["proxymock/recording"],"direction":"out","method":"GET","query":"/v1/inventory/","limit":20,"offset":0}

Read the inbound RRPair returned by the first call. Report its product_ids
count, the number and operations of outbound matches, and whether the outbound
timestamps are serial or overlapping. Explain why the input produces that
dependency pattern. Do not propose a fix yet.
The expected evidence is one inbound body containing eight IDs and eight
outbound GET /v1/inventory/{productID} RRPairs. Their timestamps advance one
dependency delay at a time. That ties the repeated operations to the request’s
array length without guessing from source code.
Here is example AI output from that prompt:
The inbound RRPair contains 8
product_ids:sku-001throughsku-008.It produced 8 outbound matches, one per product:
Start time (UTC) Operation 17:50:50.049887GET /v1/inventory/sku-00117:50:50.087532GET /v1/inventory/sku-00217:50:50.125078GET /v1/inventory/sku-00317:50:50.163127GET /v1/inventory/sku-00417:50:50.201178GET /v1/inventory/sku-00517:50:50.238582GET /v1/inventory/sku-00617:50:50.277154GET /v1/inventory/sku-00717:50:50.315622GET /v1/inventory/sku-008The calls are serial, not overlapping. Each RRPair records a 1 ms duration, while consecutive starts are approximately 37–39 ms apart.
The pattern occurs because
Builditerates throughproductIDsin order and waits forfetchInventoryto complete before advancing to the next item (internal/catalog/catalog.go:50). Each fetch constructs one/v1/inventory/{productID}request and synchronously executes it (internal/catalog/catalog.go:81). The inventory fixture also deliberately delays every response by 35 ms (cmd/inventory/main.go:15), explaining the spacing and the inbound request’s roughly 307 ms total duration.
5. Pass the saved interval directly to Tempo through Grafana MCP
Paste this prompt next:
Call Grafana MCP list_datasources with:
{"type":"tempo","limit":50,"offset":0}

Parse proxymock/results/baseline/functional/summary.json first. Stop without
querying Tempo unless the -ALL- endpoint reports requests.total=3,
requests.failed=0, and requests.result-match-pct=100. A 0% match or a 502
response means the recorder is still running or the mock failed to start;
correct the process state and rerun the functional replay.

Parse this file yourself:
proxymock/results/baseline/functional/window.json

Pass its start and end strings directly and unchanged to Grafana MCP
tempo_traceql-search with:
{"datasourceUid":"tempo","query":"{ resource.service.name = \"catalog-api\" && name = \"POST /api/catalog\" }","start":file.start,"end":file.end}

Do not ask me to record, copy, substitute, widen, round, or confirm timestamps.
If no trace is returned, make at most three identical calls over 30 seconds. If
all three are empty, stop and inspect docker compose ps and docker compose logs
tempo read-only. Do not retry indefinitely or change the interval.

Choose the longest returned trace. Call tempo_get-trace with:
{"datasourceUid":"tempo","trace_id":the returned traceID}

Report the trace ID, total span count, inventory.lookup count, GET inventory
count, downstream fan-out, root critical-path duration, overlap or seriality,
service.name, instrumentation scope and version, code.file.path, and
code.function.name. Only then propose a fix.
In the reference baseline, Grafana MCP returned trace
72ab046d4903da9b9cbf417c6ee51227. It contained 17 spans: one catalog server
span, eight inventory.lookup application spans, and eight GET inventory
client spans. Every lookup was a direct child of the root, so fan-out was eight,
but their time ranges did not overlap. The 301.876 ms root duration was the
critical path.
Tempo also supplied useful source attribution:
service.name: catalog-api
instrumentation scope: github.com/speedscale/mock-lab/tempo-demo/internal/catalog
HTTP instrumentation: go.opentelemetry.io/contrib/instrumentation/net/http/otelhttp 0.62.0
code.file.path: internal/catalog/catalog.go
code.function.name: catalog.(*Service).fetchInventory
Here is sample AI output from step 5:
The functional replay gate passed:
requests.total=3,requests.failed=0, andrequests.result-match-pct=100.Trace report
- Trace ID:
02c6da9c4ec5342b6edcb4802af6be7f- Total spans: 17
inventory.lookupspans: 8GET inventoryclient spans: 8- Downstream fan-out: 8 inventory requests—one per product ID
- Root critical-path duration: 306.957416 ms
- Seriality: fully serial. Each lookup begins only after the previous lookup ends, with microsecond-scale gaps and no overlap. The eight lookup spans consume about 306.721 ms of the root duration.
service.name:catalog-api- Instrumentation scopes:
- HTTP server/client:
go.opentelemetry.io/contrib/instrumentation/net/http/otelhttp, version 0.62.0inventory.lookup:github.com/speedscale/mock-lab/tempo-demo/internal/catalog, with no version recordedcode.file.path:internal/catalog/catalog.gocode.function.name:catalog.(*Service).fetchInventoryProposed fix
Run the independent inventory lookups concurrently with a bounded concurrency limit. Preserve response ordering by preallocating the result slice and storing each result at its input index; use shared context cancellation and propagate the first error.
That would overlap the eight downstream calls and move the critical path from their summed latency—about 307 ms—toward one or a few approximately 38–40 ms lookup waves, depending on the concurrency limit. No application code has been changed yet.
6. Add bounded concurrency without changing behavior
Now give the agent permission to edit:
Implement the smallest maintainable bounded-concurrency fix in
~/s2/mock-lab/labs/tempo/internal/catalog/catalog.go.

Pin the only new dependency first with:
go get golang.org/x/sync@v0.16.0

Preserve input validation, output order, cancellation, error propagation, and
every response value. Do not hard-code product IDs or quantities. Do not weaken
or rewrite tests merely to pass. Add a focused test proving the concurrency
bound and run make test.
The reference candidate used errgroup.WithContext, limited the group to four
calls, and wrote each result back to the input’s index. Validation stayed in
place. Errors still cancel sibling work. No fixture value moved into application
code.
7. Replay, diff every stable response field, and query again
Stop the baseline make mock, then start it again so it builds the candidate
against the same recording:
cd "$HOME/s2/mock-lab/labs/tempo"
make mock RECORDING_DIR=proxymock/recording
Run both candidate replays in another terminal:
make functional-replay \
  RECORDING_DIR=proxymock/recording \
  RESULTS_DIR=proxymock/results/candidate
make load-replay \
  RECORDING_DIR=proxymock/recording \
  RESULTS_DIR=proxymock/results/candidate
Then paste this validation prompt:
Do not edit application code during validation.

Call proxymock MCP response_diff with:
{"baseline-directory":["proxymock/results/baseline/functional"],"in-directory":["proxymock/results/candidate/functional"]}

Report every stable-field difference. Matching status codes or response schemas
alone are not proof of behavior.

Parse proxymock/results/candidate/functional/window.json yourself. Pass file.start and file.end directly and unchanged to tempo_traceql-search with datasourceUid="tempo" and query="{ resource.service.name = \"catalog-api\" && name = \"POST /api/catalog\" }". Do not ask me for timestamps.

Choose the longest candidate trace and call tempo_get-trace. Compare it with
baseline trace 72ab046d4903da9b9cbf417c6ee51227.

Read both functional/summary.json and load/summary.json pairs. Select the
endpoints entry whose url and method both equal "-ALL-". Build a before-and-after
table with functional failures, every stable response difference, load average
latency, throughput, load failures, trace IDs, span count, repeated operation
count, fan-out, trace shape, and critical path. Declare success only if every
acceptance gate has recorded evidence.
The reference response_diff learned two volatile fields from within-run
evidence and reported no stable-field differences. The candidate functional and
load replays each had zero failures.
Before-and-after evidence
| Evidence | Serial baseline | Bounded-concurrency candidate |
|---|---|---|
| Functional failed requests | 0 | 0 |
| Functional result match | 100% | 100% |
| Stable-field response differences | N/A (comparison source) | 0 (none) |
| Functional average latency | 301 ms | 80 ms |
| 4-VU load average latency | 303 ms | 80 ms |
| 4-VU load throughput | 13.07 req/s | 49.33 req/s |
| Load failed requests | 0 | 0 |
| Trace ID | 72ab046d4903da9b9cbf417c6ee51227 | 2b51700da7a9b62bfb8c2cc974649b07 |
| Total span count | 17 | 17 |
inventory.lookup spans | 8 | 8 |
GET inventory client spans | 8 | 8 |
| Downstream fan-out | 8 | 8 |
| Dependency trace shape | 8 serial calls | 2 waves of 4 calls |
| Root critical path | 301.876 ms | 85.073 ms |
| Source attribution | catalog-api; internal/catalog/catalog.go; catalog.(*Service).fetchInventory | same |
The candidate reduced the selected trace’s critical path by 71.8% and increased load throughput 3.78x. The span count and fan-out stayed constant because this was a concurrency fix, not batching. The original problem was the serial shape, and that shape disappeared.
What this measurement does not prove
- These are directional local results, not production capacity guarantees. Compare both variants on the same machine.
- The fixed timing multiplier models stable dependency latency. It does not model network jitter, connection-pool contention, remote rate limits, retries, or production tail latency.
- The offline trace has catalog application and HTTP client spans but no inventory server spans, because proxymock replaces the dependency.
- One selected functional trace is not a latency percentile. The proxymock load summary supplies aggregate latency and throughput.
- Four concurrent calls are safe for this fixture, not a universal limit. A production bound should follow the dependency’s capacity, client connection pool, and rate-limit contract.
- Load mode does not compare bodies. Only the scored functional replay and
proxymock
response_diffsupport the claim that response behavior matches. - Concurrency keeps eight dependency operations. If an inventory batch endpoint exists, measure batching separately; it can reduce fan-out as well as time.
For the underlying interfaces, use Grafana’s primary Tempo datasource documentation, TraceQL query guide, and Tempo MCP reference. OpenTelemetry documents the Go HTTP instrumentation libraries, and proxymock publishes its generated MCP tools reference.
When you finish, stop make mock and remove only the lab’s Compose stack:
cd "$HOME/s2/mock-lab/labs/tempo"
make observability-down
The agent did not guess from a waterfall. Tempo proved where the request waited. proxymock proved which input created those waits and whether the fix preserved the response. That is the difference between making code faster and proving you made the right code faster.