Speedscale has flexible pricing that adjusts to your needs and organization size.
per GB
Record & replay Kubernetes traffic with auto generated tests, mocks, and CI integration.
Customizable traffic replay with a visual, web-based interface. Browse & choose traffic and auto discover dependencies.
Everything in Pro, plus PII data redaction, multiple load generators, SSO, and single tenant data isolation.
Startup | Pro | Enterprise | |
|---|---|---|---|
Data Limit | 0-50 GB / mo | 0-150 GB / mo | Flexible |
HTTP/s support | |||
Prod traffic generator
| |||
API transaction browser | |||
Multiply / Ramp / Loop traffic
| |||
Automated CI integration | |||
Service virtualization / Mocking | |||
Authentication record / replay | |||
Performance / Regression reports | |||
Dataset augmentation | |||
Service map | |||
Support | Community | Business day | Dedicated Slack |
Chaos mocks (latency, errors, black holes) | |||
Additional protocol support | |||
Sensitive data redaction | |||
Multiple load generators | |||
Single sign-on | |||
Customer-managed encryption keys | |||
Tenant data isolation |
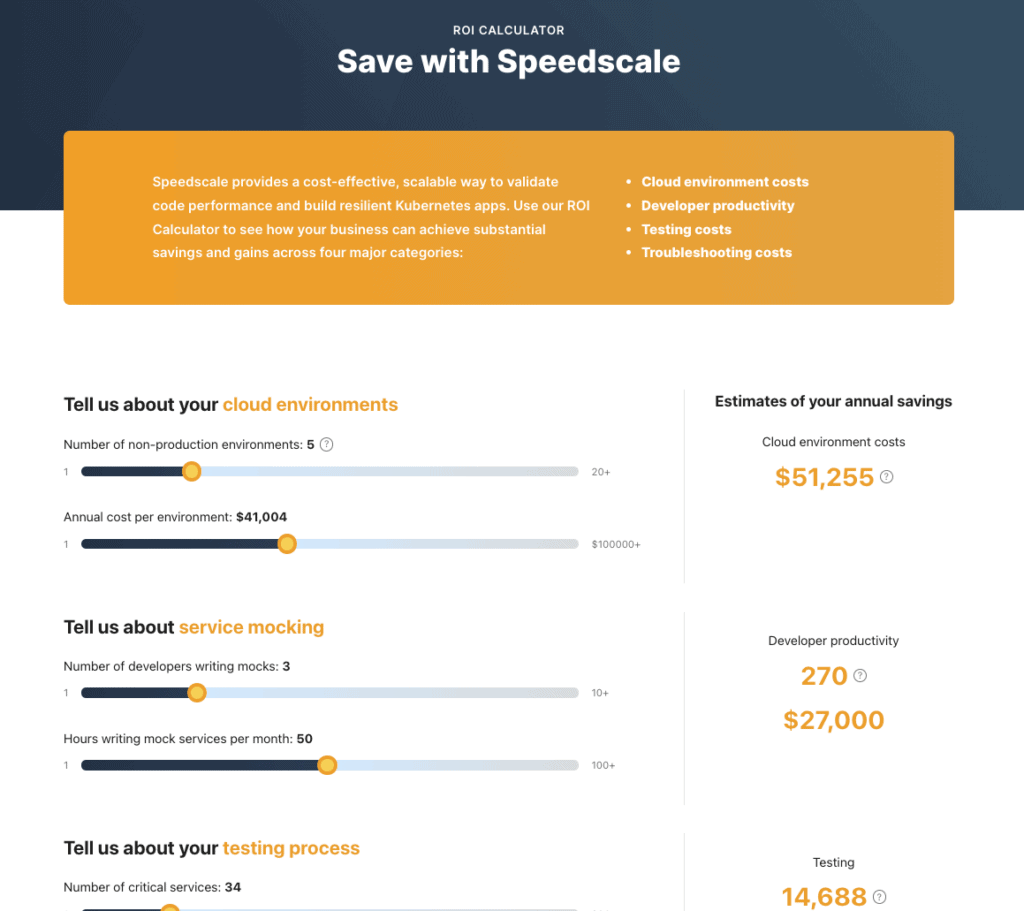
Use our ROI Calculator to see how your business can achieve substantial savings and gains across four major categories: cloud environment costs, developer productivity, testing costs, and troubleshooting costs.

Absolutely! You can request a free trial and also play with an interactive demo.
Yes! Speedscale has an established Security Program, is SOC2 certified and independently audited. All traffic is encrypted during transit and at rest. Code and images are continuously scanned for vulnerabilities. The Enterprise version can be configured with data isolation. Check out our security page for more details.
API Observability refers to the capability of our Traffic Viewer, which you can read more about here.
No problem! Overages are calculated on a per GB basis and stated in the monthly agreement so there are no surprises. Users can see real-time usage within the dashboard.
Shoot us an email or chat with us!
© 2024 Speedscale. All Rights Reserved | Privacy Policy