Observe Opaque Services With OpenTelemetry eBPF + proxymock
Every SRE team operates services it cannot see into: a vendor binary, an inherited legacy deployment, a container whose owning team dissolved two reorgs ago. The routes are undocumented, the dependencies are unknown, and when a request takes 130 milliseconds nobody can say whether that time is application work or a wait across a network boundary. Instrumenting the source is often not an option — there may be no source to edit, no owner to approve the change, and no safe way to redeploy on incident timelines.
This guide builds a lab that answers the first operational questions about such an opaque service without modifying its code:
- discover its HTTP endpoints and dependency topology,
- attribute latency with RED metrics and a distributed trace, and
- capture and replay its real boundary traffic so behavior is validated independently of telemetry.
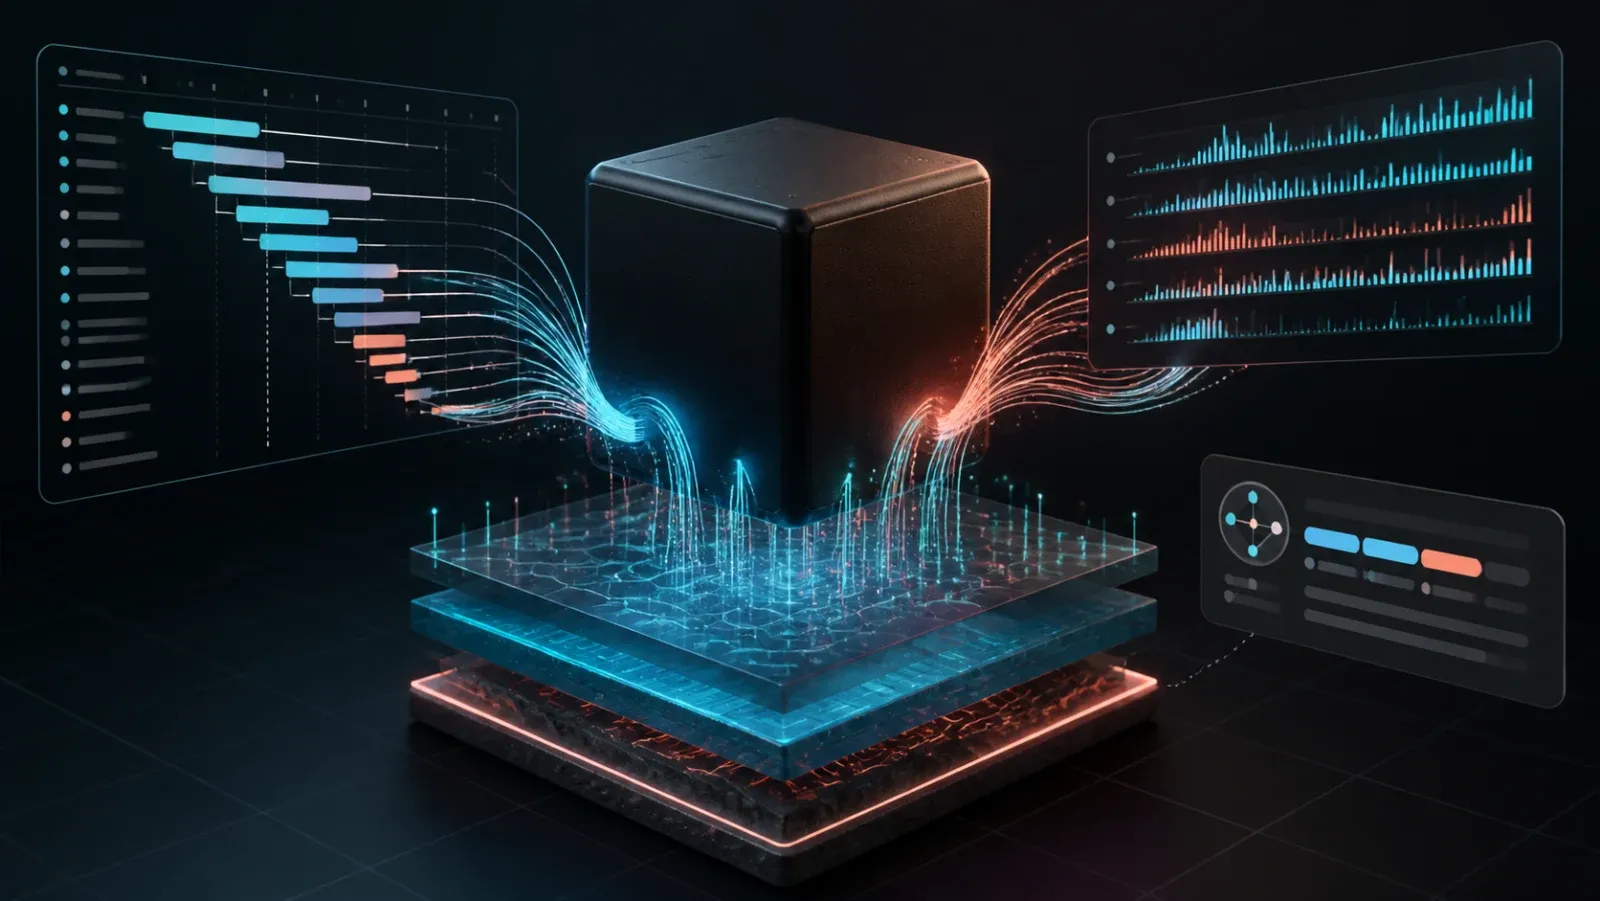
OpenTelemetry eBPF Instrumentation (OBI, formerly Grafana Beyla) observes the service from the Linux kernel: it discovers the HTTP endpoints, exports RED metrics, and assembles a distributed trace with no SDK, agent, or source change. proxymock records the exact inbound request and dependency exchange, then replays them to prove that the observed response is a stable contract, not merely a nice-looking trace.
That separation matters for on-call debugging, human or AI-assisted. Telemetry tells you where a request spent its time. Recorded traffic tells you what actually crossed the boundary and whether an offline replay still behaves the same — evidence an SRE can act on before ever reading the source.
What you will build
The companion OBI lab reuses the repository’s existing Go quickstart application. The initial image contains no OpenTelemetry imports, SDK, agent, or source tracepoints.
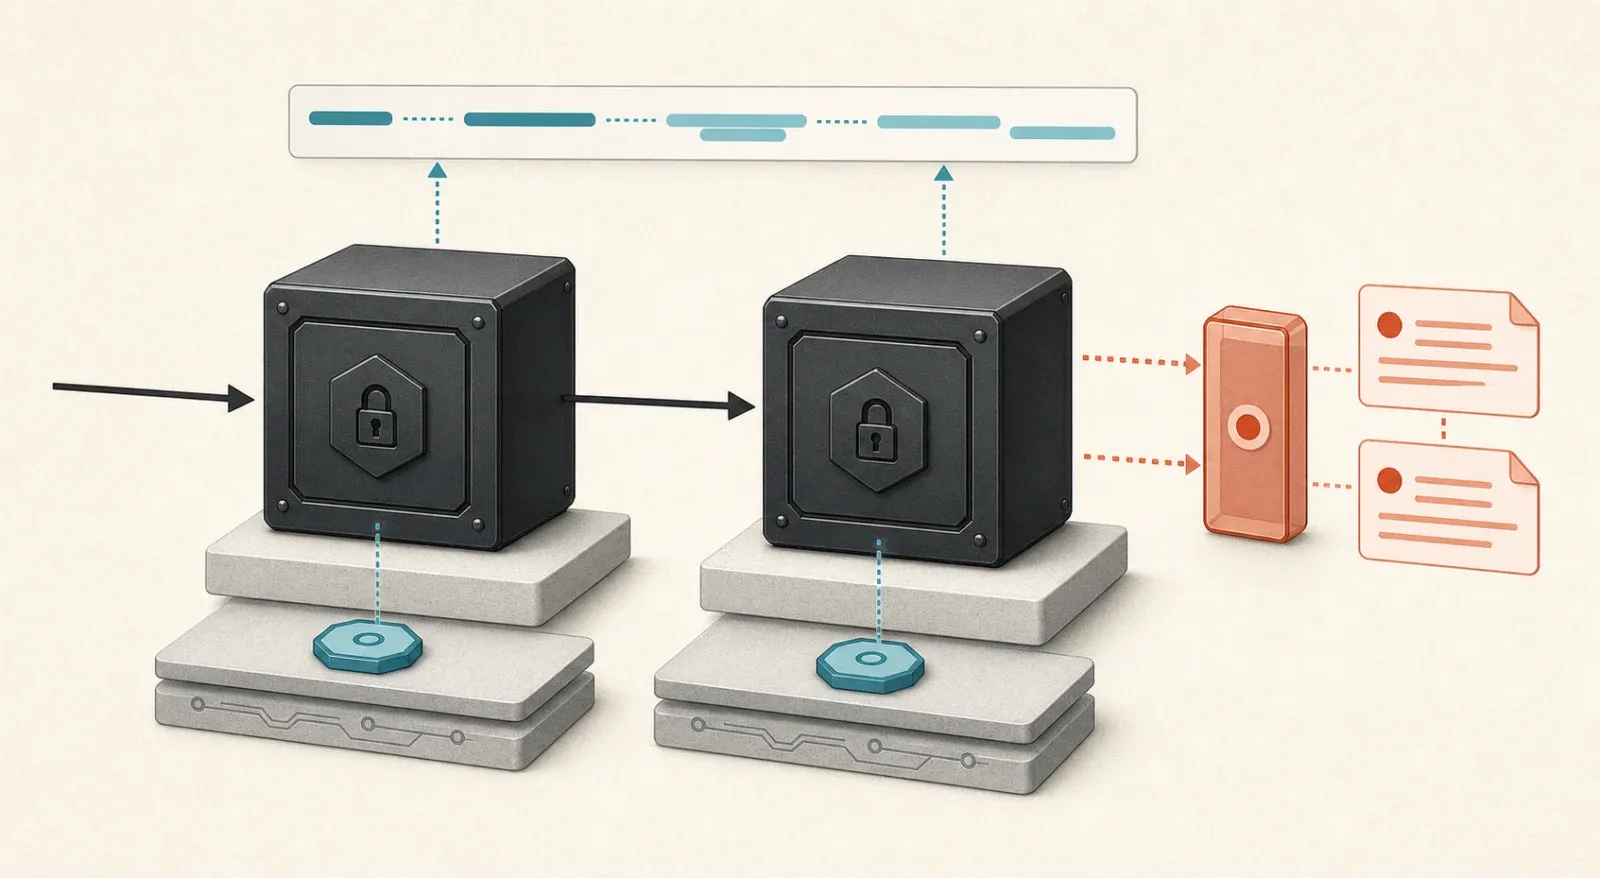
One inbound GET /api/stats request makes one downstream
GET /v1/projects call. The deterministic dependency waits 120 milliseconds.
OBI discovers both Kubernetes services and exports:
http_server_request_duration_secondsandhttp_client_request_duration_secondsRED histograms;- a connected Tempo trace across
catalog-apiandcatalog-fixture; - Kubernetes resource attribution and the
go.opentelemetry.io/obiscope.
proxymock records the inbound and outbound RRPairs, runs a three-request functional gate, and then sends a bounded 100-request load replay. The two tools answer different questions: OBI locates the wait; proxymock explains and validates the boundary.
Prerequisites
- Docker Desktop with at least 8 GiB assigned
- minikube 1.37 or newer with the Docker driver
- Kubernetes CLI 1.34 or newer and Helm 4
- Go 1.23 or newer,
curl, andjq - proxymock 2.5.842 or newer, initialized and on
PATH - An MCP client with STDIO support; the commands below use Codex
The lab pins Kubernetes 1.34.0, OBI Helm chart 0.11.0 and OBI 0.10.0, Tempo 2.10.7, Prometheus 3.12.0, Grafana 13.1.0, Grafana MCP 0.14.0, and Go 1.23.12 on Alpine 3.22.
Install proxymock and clone the lab:
brew install speedscale/tap/proxymock
proxymock init
proxymock version

git clone https://github.com/speedscale/mock-lab.git
cd mock-lab/labs/obi
Every command below runs from the mock-lab/labs/obi directory unless a step says
otherwise.
The proxymock CLI quickstart covers Linux, Windows, and other installation paths. OBI itself still requires Linux. On macOS, this lab runs it in minikube’s Linux node; it does not run eBPF programs in the macOS kernel.
1. Start the source-opaque lab
make test
make up
make up creates only the obi-lab minikube profile, builds the existing app
and fixture, installs the pinned OBI chart, and verifies Linux BTF plus OBI
process discovery. OBI runs as a privileged DaemonSet in this disposable lab.
In another terminal, from mock-lab/labs/obi, keep the observability ports
forwarded:
make forwardGrafana is at http://127.0.0.1:3002 with disposable admin / admin
credentials. Tempo is forwarded to port 3202 and Prometheus to 19090.
Before trusting any signal, confirm that the application module itself has no OpenTelemetry dependency:
(
  cd ../go
  if go list -m all | grep -qi opentelemetry; then
    echo "unexpected OpenTelemetry dependency" >&2
  else
    echo "confirmed: no OpenTelemetry dependency"
  fi
)
The OBI values select the opaque-demo namespace rather than modifying the
application. They also set ebpf.wakeup_len: 1. OBI’s default threshold is 500
events, which is efficient for busy services but can leave a single lab request
buffered long enough to look like missing telemetry.
2. Record one request and its machine-owned interval
make capture RECORDING_DIR=proxymock/recordingThe target starts proxymock around the application and fixture port-forwards,
sends one GET /api/stats, waits for export and scraping, and shuts the
recorder down. It writes exactly two RRPairs and this machine-readable file:
proxymock/recording/window.jsonThe file contains capture_start and capture_end at nanosecond precision. It
also contains query_start and query_end, which the script derives by
flooring and ceiling to whole seconds. That derivation keeps the query interval
conservative and hands the agent clean whole-second RFC3339 values it can pass
through without transforming. The agent parses the file and passes the query
fields directly. The reader never records, copies, rounds, substitutes, or
confirms a timestamp.
3. Configure the actual MCP interfaces
Add proxymock MCP and the pinned Grafana MCP server from the lab directory:
codex mcp add proxymock -- proxymock mcp run \
  --work-dir "$PWD"

codex mcp add grafana -- docker run --rm -i \
  --add-host host.docker.internal:host-gateway \
  -e GRAFANA_URL=http://host.docker.internal:3002 \
  -e GRAFANA_USERNAME=admin \
  -e GRAFANA_PASSWORD=admin \
  grafana/mcp-grafana:0.14.0 -t stdio --disable-write \
  --enabled-tools datasource,prometheus,navigation

codex mcp list
Grafana MCP discovers the Prometheus datasource and the embedded Tempo MCP server. In this pinned stack, the relevant runtime tools and required arguments are:
| Tool | Required arguments used here |
|---|---|
list_datasources | optional type, limit, offset |
list_prometheus_metric_names | datasourceUid; optional regex, limit, page |
query_prometheus | datasourceUid, expr, endTime; range queries also use startTime, stepSeconds, queryType |
tempo_traceql-search | datasourceUid, query; this guide always supplies start and end |
tempo_get-trace | datasourceUid, trace_id |
search_local_traffic | in-directory; this guide also supplies direction, method, query, limit, and offset |
These names came from tools/list against Grafana MCP 0.14.0 and proxymock MCP,
not from guesswork. query_tempo is not the trace tool exposed by this stack.
4. Let the recording explain the boundary first
Do not inspect or edit application code yet. Give the agent this exact prompt:
Work in the obi directory of the mock-lab clone. Do not edit application code.

Call proxymock MCP search_local_traffic with:
{"in-directory":["proxymock/recording"],"direction":"in","method":"GET","query":"/api/stats","limit":20,"offset":0}

Call it again with:
{"in-directory":["proxymock/recording"],"direction":"out","method":"GET","query":"/v1/projects","limit":20,"offset":0}

Read both returned RRPair files. Report the inbound operation, status, duration,
and stable JSON response. Report every outbound dependency operation and status.
Explain which recorded boundary can account for the inbound request. Do not use
application source and do not propose source instrumentation yet.
Example AI output:
The recording contains one inbound
GET /api/statsRRPair. It returned 200 in 138 ms with stable JSON behavior:total=24,Graduated=16,Incubating=5, andSandbox=3.It also contains one outbound
GET /v1/projectsRRPair with status 200. No other dependency operation appears in the recording. The/api/statsresponse is an aggregate of the returned project collection, so this is the boundary that can account for the inbound work. The RRPair establishes the request and response contract; I need the OBI trace to attribute the 138 ms across the client, proxy, and dependency server.
This is the point of recording before reading source. The agent has an observed topology—one incoming route and one dependency edge—and a concrete payload contract to protect.
5. Query RED metrics and the connected trace through Grafana MCP
Give the agent this prompt. Every time argument comes from the saved file:
Work in the obi directory of the mock-lab clone. Do not edit application code.

Parse proxymock/recording/window.json.
Report capture_start and capture_end. Assign query_start and query_end from the
file; do not alter them or ask me to record, copy, substitute, widen, round, or
confirm timestamps.

Call Grafana MCP list_datasources with:
{"type":"prometheus","limit":50,"offset":0}
Then call it with:
{"type":"tempo","limit":50,"offset":0}

Call list_prometheus_metric_names with:
{"datasourceUid":"prometheus","regex":"^http_(server|client)_request_duration_seconds(_bucket|_count|_sum)?$","limit":50,"page":1}

Call query_prometheus three times with queryType="range",
startTime=file.query_start, endTime=file.query_end, and stepSeconds=1.
Use these exact expr values:
1. sum by (service_name, http_route, http_response_status_code) (http_server_request_duration_seconds_count)
2. sum by (service_name, http_route, http_response_status_code) (http_server_request_duration_seconds_sum)
3. sum by (service_name, http_route, http_response_status_code) (http_server_request_duration_seconds_count{http_response_status_code=~"5.."})

Call tempo_traceql-search with:
{"datasourceUid":"tempo","query":"{ resource.service.name = \"catalog-api\" && name = \"GET /api/stats\" }","start":file.query_start,"end":file.query_end}

If the search is empty, repeat that identical call at most three times. Do not
change the interval. If all three are empty, inspect OBI, Tempo, Prometheus, and
Grafana health read-only and stop.

Call tempo_get-trace with the returned trace ID:
{"datasourceUid":"tempo","trace_id":returned.traceID}

Report request count, 5xx count, mean duration, trace ID, total span count,
services, operations, downstream fan-out, root critical path, dependency server
duration, OBI scope, telemetry distribution, Kubernetes namespace, and
deployment attribution. State what zero-code telemetry answers and what it does
not answer. Do not add source instrumentation unless the next question requires
inside-process detail.
In the reference run, the first trace call returned immediately:
The saved capture boundaries are
2026-08-13T01:30:02.898858Z–2026-08-13T01:30:10.074958Z. I passed the machine-derived query interval2026-08-13T01:30:02Z–2026-08-13T01:30:11Zunchanged.
- Trace ID:
aec81f8670794b69bcd88f1e60afe4c2- Total spans: 7
- Services:
catalog-api(4 spans),catalog-fixture(3 spans)- Root:
GET /api/stats, 132.414667 ms- Downstream fan-out: 1
GET /v1/projects- Dependency server span: 121.367125 ms
- RED metrics: one 200 request on each route, no 5xx series, 132.414667 ms mean for
/api/stats, and 121.367125 ms mean for/v1/projects- Scope:
go.opentelemetry.io/obi- Distribution:
opentelemetry-ebpf-instrumentation- Attribution: namespace
opaque-demo; deploymentscatalog-apiandcatalog-fixtureThe dependency server occupies about 91.7% of the root duration. Zero-code telemetry answers the boundary question:
/api/statsis slow because it waits on/v1/projects. It does not identify a slow function or line insidecatalog-fixture. Source instrumentation is unnecessary unless that becomes the next question.
6. Replay behavior independently of telemetry
Run the correctness gate before the load replay:
make functional-replay \
  RECORDING_DIR=proxymock/recording \
  RESULTS_DIR=proxymock/results/baseline

make load-replay \
  RECORDING_DIR=proxymock/recording \
  RESULTS_DIR=proxymock/results/baseline

make verify RESULTS_DIR=proxymock/results/baseline
Functional mode repeats the inbound request three times and fails unless
requests.failed=0 and requests.result-match-pct=100. That is stable response
behavior, not a status-only or schema-only check. Load mode is allowed to run
only after that gate; two virtual users each send 50 iterations with body
scoring disabled for throughput.
The live capture includes the deterministic 120 ms dependency delay. The offline replay replaces that boundary with proxymock, so the performance change is expected. It demonstrates isolation, not an application optimization.
| Evidence | Live boundary | proxymock functional replay | proxymock load replay |
|---|---|---|---|
| Requests | 1 | 3 | 100 |
| Failed requests | 0 | 0 | 0 |
| Stable response match | Recorded contract | 100% | Not scored in load mode |
| Inbound latency | 138 ms RRPair / 132.415 ms root span | 11 ms average | 6 ms average |
| p99 latency | One trace; not a percentile | 10 ms | 15 ms |
| Throughput | Not measured from one request | 79.44 requests/s, directional | 318.55 requests/s |
| Trace shape | 7 spans, 2 services, fan-out 1 | Same OBI boundary types; mock removes server delay | Many traces; use RED metrics for aggregation |
| Dominant live span | /v1/projects server, 121.367 ms | Dependency mocked | Dependency mocked |
The machine-readable reference behind this table is
obi/evidence/reference.json
in the lab repository.
When to add source instrumentation
Do not turn “zero code” into a religion. Turn it into a sequencing rule.
OBI answered the first useful question: which boundary dominates the request?
If the next question is “why does /v1/projects spend 121 ms inside the
fixture?”, boundary spans cannot answer it. At that point, add the smallest
source span or profile to catalog-fixture, not a speculative instrumentation
campaign across both services.
The boundary evidence narrows where to spend that effort. proxymock keeps the input and response contract fixed while you do it.
Measurement limitations
- OBI requires a supported Linux kernel, BTF, eBPF access, and sufficient map memory. macOS and Windows cannot run it directly. Rootless containers, lockdown modes, and managed-cluster policies may reject the required probes.
- This disposable lab uses
privileged: true. Production deployments should follow OBI’s security guide and validate the minimum capabilities for their kernel and context-propagation needs. - OBI emits transaction spans and RED metrics, not arbitrary local function spans, business attributes, or source-line attribution.
- The example uses unencrypted HTTP/1.1 between supported Go binaries. TLS, HTTP/2, gRPC, proxies, CNI behavior, and long-lived connections have specific propagation limits.
- Prometheus counters are cumulative. If both boundary samples exist, calculate a delta. A time series first created by the request begins at one, so its single in-window value is the interval count. An empty 5xx selector here means no error series was created in the saved interval.
- One trace is latency attribution, not a percentile. Local replay latency and throughput are directional, machine-specific, and include the port-forward, mock, and generator harness.
- Load mode deliberately skips response scoring. Only the functional replay is the correctness gate.
Clean up
Stop make forward with Ctrl-C. Then delete only this lab’s isolated minikube
profile:
make down