Explain Non-CPU Latency With Prometheus + proxymock
A p95 latency regression with low CPU usage is one of the most common and most misdiagnosed incident patterns in production services. Most request latency is wait time, not work time: requests queue behind connection pools, semaphores, bounded worker groups, and downstream dependencies, and none of that waiting consumes a core. A CPU profile measures what the process is computing, so for this class of incident it returns a flat, unhelpful answer. The diagnosis requires a different signal: a measurement of what each request is waiting for.
This guide builds a reproducible lab that separates the three signals an SRE needs to diagnose wait-time latency:
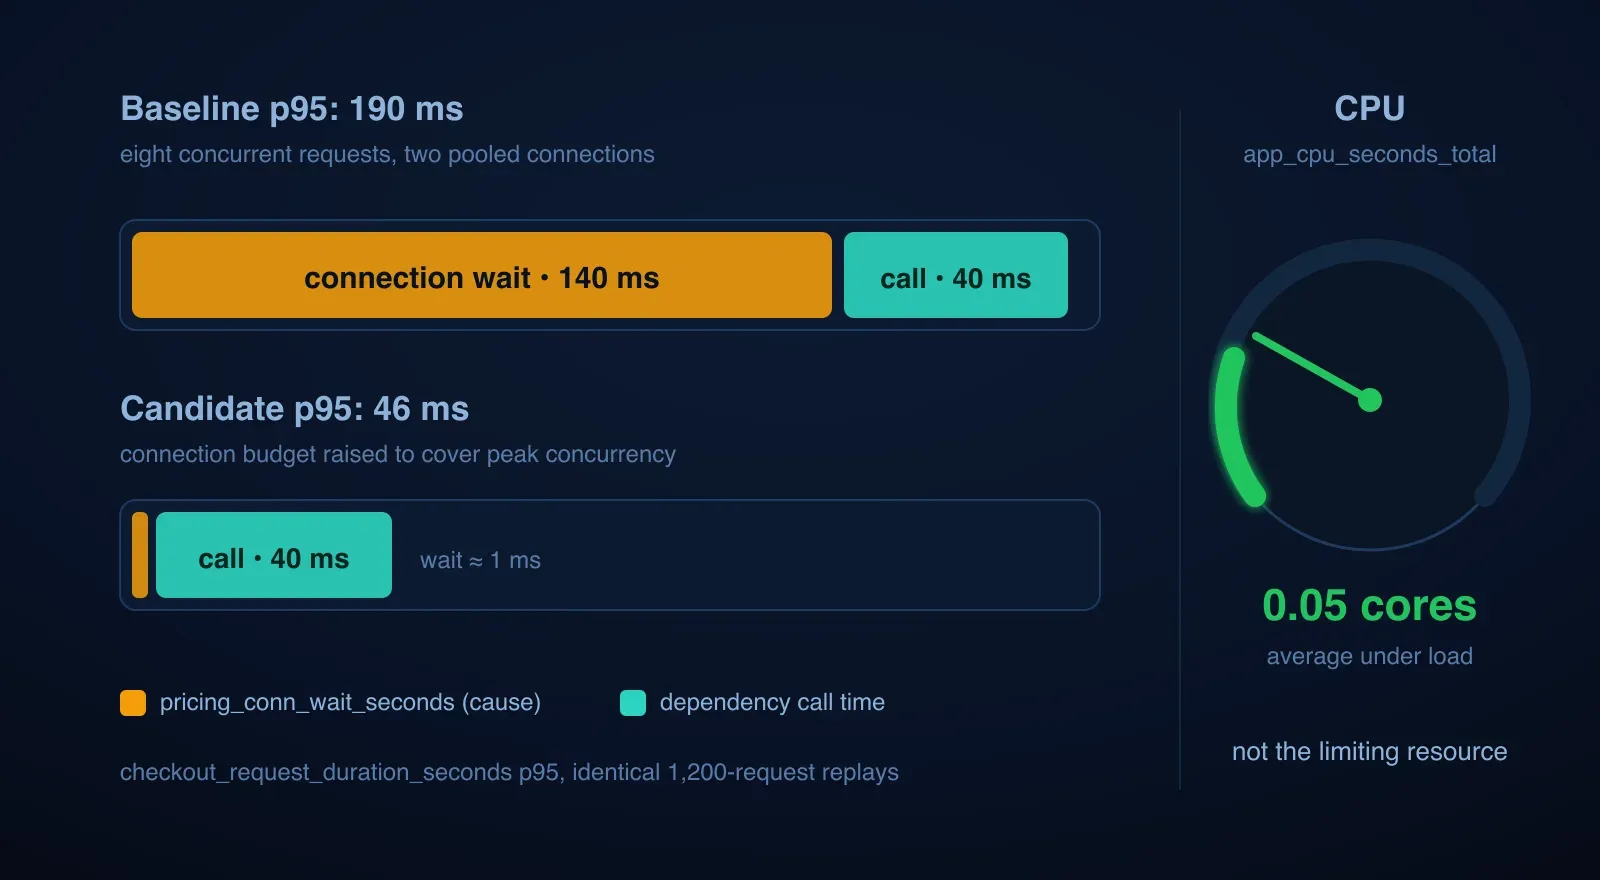
- a request-duration histogram shows the symptom, a p95 nearly 4x the dependency time,
- a connection-wait histogram shows the cause, queueing behind a two-connection budget, and
- a CPU counter rules out compute, at five percent of one core under load.
Prometheus supplies the diagnosis. proxymock supplies the verification, and it does two jobs the metrics cannot. First, replay makes the performance comparison valid: it records the service’s real dependency exchange once, then drives the identical 1,200-request workload against the baseline and the candidate, so the before and after percentiles describe the same traffic instead of whatever happened to arrive. Second, replay makes the fix safe: functional mode requires zero failed requests and a 100% stable response match, and a response diff confirms the candidate changed no stable response field. A latency fix that silently alters response behavior is still a regression; replay verification is the evidence that rules it out.
What you will build
The companion Prometheus lab
contains a small checkout API that answers GET /api/quote by calling a
pricing dependency with a deterministic 40 ms lookup delay. The API’s pricing
HTTP client carries a deliberate two-connection budget, a protective limit
sized for lower traffic than the service now receives.
Under eight concurrent virtual users, requests queue behind connection acquisition. The app exports three signals:
checkout_request_duration_seconds, a route-labeled histogram of inbound request time;pricing_conn_wait_seconds, a histogram of time spent waiting for a pooled connection, observed from Go’shttptracehooks;app_cpu_seconds_total, process CPU time read throughgetrusage.
proxymock records the inbound request and the pricing exchange once, mocks the dependency with its recorded timing, and replays the identical workload before and after the fix. Prometheus locates the wait; proxymock validates the boundary.
Prerequisites
- Docker with Compose
- Go 1.23 or newer,
curl, andjq - proxymock 2.5.842 or newer, initialized and on
PATH - An MCP client with STDIO support; the commands below use Codex
The lab pins Prometheus 3.12.0, Grafana 13.1.0, Grafana MCP 0.14.0, and
prometheus/client_golang 1.20.5.
Install proxymock and clone the lab:
brew install speedscale/tap/proxymock
proxymock init
proxymock version

git clone https://github.com/speedscale/mock-lab.git
cd mock-lab/labs/prometheus
Every command below runs from the mock-lab/labs/prometheus directory unless a
step says otherwise.
1. Start Prometheus and Grafana
make test
make up
make up starts a Compose stack with Grafana at http://127.0.0.1:3003
(disposable admin / admin credentials) and Prometheus at
http://127.0.0.1:9091. Prometheus scrapes the host-side checkout process
every second; that interval keeps short replay windows measurable in a lab,
and it is not a production recommendation.
2. Record the request and its dependency boundary
make capture RECORDING_DIR=proxymock/recordingThe target starts the pricing fixture and the checkout API under
proxymock record, sends one GET /api/quote?sku=SSC-4110&qty=3 through the
inbound reverse proxy, and shuts both down. The recording holds exactly two
RRPairs: the inbound quote and the outbound GET /v1/price/SSC-4110.
One capture detail matters for reproducing the queueing offline: proxymock’s
local HTTP capture stores the dependency response time at 1 ms precision in
this environment, so the lab’s mock command applies a pinned 40x timing
multiplier. The offline mock then takes the same 40 ms per call as the real
fixture, which is what makes connection queueing reproducible without the
fixture running.
3. Replay the baseline and save exact UTC intervals
Start the API against the recorded dependency:
make mock RECORDING_DIR=proxymock/recordingWait for mocking traffic sent from your app, then in another terminal, from
mock-lab/labs/prometheus:
make functional-replay RESULTS_DIR=proxymock/results/baseline
make load-replay RESULTS_DIR=proxymock/results/baseline
make verify RESULTS_DIR=proxymock/results/baseline
Functional mode repeats the request three times and fails unless
requests.failed=0 and requests.result-match-pct=100. Load mode runs only
after that gate and sends 150 iterations from each of eight virtual users. The
fixed iteration count keeps the baseline and candidate workloads identical.
Each successful replay writes a window.json beside its summary:
proxymock/results/baseline/load/window.jsonThe file contains the replay’s nanosecond start and end, plus three
derived fields: query_start floored to a whole second, query_end ceilinged
past the final scrape, and window_seconds, the integer difference. The agent
passes query_end and window_seconds through unchanged as the evaluation
time and the PromQL range. The reader never records, copies, rounds,
substitutes, or confirms a timestamp.
4. Configure the actual MCP interfaces
codex mcp add proxymock -- proxymock mcp run \
  --work-dir "$PWD"

codex mcp add grafana -- docker run --rm -i \
  --add-host host.docker.internal:host-gateway \
  -e GRAFANA_URL=http://host.docker.internal:3003 \
  -e GRAFANA_USERNAME=admin \
  -e GRAFANA_PASSWORD=admin \
  grafana/mcp-grafana:0.14.0 -t stdio --disable-write \
  --enabled-tools datasource,prometheus,navigation

codex mcp list
In this pinned stack, the relevant runtime tools and required arguments are:
| Tool | Required arguments used here |
|---|---|
list_datasources | optional type, limit, offset |
list_prometheus_metric_names | datasourceUid; optional regex, limit, page |
query_prometheus | datasourceUid, expr, endTime; this guide uses queryType="instant" |
search_local_traffic | in-directory; this guide also supplies direction, method, query, limit, and offset |
response_diff | in-directory, baseline-directory |
These names and argument shapes came from tools/list against Grafana MCP
0.14.0 and proxymock MCP, not from guesswork. In this Grafana MCP version,
endTime is the required time field on query_prometheus.
5. Let the recording explain the boundary first
Do not inspect or edit application code yet. Give the agent this exact prompt:
Work in the prometheus directory of the mock-lab clone. Do not edit application
code.

Call proxymock MCP search_local_traffic with:
{"in-directory":["proxymock/recording"],"direction":"in","method":"GET","query":"/api/quote","limit":20,"offset":0}

Call it again with:
{"in-directory":["proxymock/recording"],"direction":"out","method":"GET","query":"/v1/price/","limit":20,"offset":0}

Read both returned RRPair files. Report the inbound operation, status, and
stable JSON response. Report the outbound dependency operation and status.
Explain which recorded boundary accounts for the inbound request time and what
happens to that time when many requests share the dependency client.
Example AI output:
The recording contains one inbound
GET /api/quoteRRPair: status 200 in 46 ms, with stable JSON behaviorsku=SSC-4110,quantity=3,unit_price_cents=1899,total_cents=5697,currency=USD.It also contains one outbound
GET /v1/price/SSC-4110RRPair with status 200. The quote response is the priced form of that single lookup, so the pricing call accounts for nearly all of the inbound time. If concurrent requests share a limited pricing client, each request’s latency becomes its own dependency call plus however long it waited for the client, and only a wait metric can separate those two.
The agent now has the topology, the contract to protect, and a hypothesis worth testing against metrics instead of source code.
6. Query the symptom, the cause, and the compute
Give the agent this prompt. Every time argument comes from the saved file:
Work in the prometheus directory of the mock-lab clone. Do not edit application
code.

Parse proxymock/results/baseline/load/window.json. Report start and end.
Assign query_end and window_seconds from the file; do not alter them or ask me
to record, copy, substitute, widen, round, or confirm timestamps. Write every
PromQL range below as [<window_seconds>s].

Call list_datasources with {"type":"prometheus","limit":50,"offset":0}.

Call list_prometheus_metric_names with:
{"datasourceUid":"prometheus","regex":"^(checkout_request_duration_seconds|pricing_conn_wait_seconds)(_bucket|_count|_sum)?$|^app_cpu_seconds_total$","limit":50,"page":1}

Call query_prometheus four times with queryType="instant" and
endTime=file.query_end. Use these exact expr values:
1. histogram_quantile(0.95, sum by (le) (increase(checkout_request_duration_seconds_bucket{route="/api/quote"}[<window_seconds>s])))
2. histogram_quantile(0.95, sum by (le) (increase(pricing_conn_wait_seconds_bucket[<window_seconds>s])))
3. increase(app_cpu_seconds_total[<window_seconds>s]) / <window_seconds>
4. sum(increase(checkout_request_duration_seconds_count{route="/api/quote",code!="200"}[<window_seconds>s]))

Report p95 request duration, p95 connection wait, average CPU cores, and the
error count; an empty result for query 4 means no error series was created.
Take exact request counts from summary.json, not from increase(), which
extrapolates. State whether the wait accounts for the p95 and whether CPU
could. If a query is empty, repeat the identical call at most three times,
then inspect the Prometheus target read-only and stop.
In the reference run, the baseline interval was
2026-08-13T14:59:55Z–2026-08-13T15:00:24Z, 29 seconds:
Over the unchanged 29-second interval, p95 request duration is 190 ms against a 40 ms dependency. The cause is visible in the second histogram: p95 connection wait is 140 ms, which means waiting for one of the pricing client’s pooled connections accounts for roughly three quarters of the p95. The process averaged 0.046 cores, so CPU cannot explain the regression, and no non-200 series exists. The proxymock summary reports the exact workload: 1,200 requests, 0 failed, average 107 ms, p95 173 ms, 46.4 requests per second. This is connection-acquisition queueing, not compute. The smallest fix is to raise the pricing client’s connection budget to cover the peak concurrency of eight.
Both percentiles come from histogram_quantile over summed le buckets, the
aggregatable form. Averaging per-client quantiles would have produced a
number nobody should trust; the histogram practices guide
covers why.
7. Make the smallest fix and prove both properties
The fix is one constant in internal/checkout/checkout.go: raise the pricing
client’s connection budget from 2 to 16 so eight concurrent requests never
queue behind connection acquisition. Run make test, restart make mock so
it rebuilds the candidate, and repeat both replays into a candidate results
directory:
make functional-replay RESULTS_DIR=proxymock/results/candidate
make load-replay RESULTS_DIR=proxymock/results/candidate
make verify RESULTS_DIR=proxymock/results/candidate
Then have the agent prove the two properties separately. Behavior, through
proxymock response_diff with the baseline functional directory as baseline
and the candidate functional directory as candidate; and performance, by
repeating the four queries from step 6 with the candidate’s own query_end
and window_seconds, both unchanged.
| Evidence | Baseline (budget 2) | Candidate (budget 16) |
|---|---|---|
| Load requests (identical replay) | 1,200 | 1,200 |
| Failed requests | 0 | 0 |
| Stable-field response differences | Comparison source | 0 (none) |
| Load p95 latency | 173 ms | 46 ms |
| Load throughput | 46.4 req/s | 176.8 req/s |
| Prometheus p95 request duration | 190 ms | 49 ms |
| Prometheus p95 connection wait | 140 ms | 0.99 ms |
| Prometheus average CPU cores | 0.05 | 0.10 |
The causal metric and the percentile improved together under the identical
workload, which is the acceptance test for a wait-time diagnosis. CPU roughly
doubled because the same work finished in a third of the wall time; it stayed
an order of magnitude below saturation either way. The machine-readable
reference behind this table is
prometheus/evidence/reference.json
in the lab repository.
When to reach for a CPU profile
The choice between metrics and profiles is a sequencing decision. Request histograms and one saturation metric answer the first question: is this time work or wait? When the answer is work, a profile is the right next tool, and the Pyroscope guide in this series walks that path with the same replay gates. When the answer is wait, as it was here, a profile of an idle process only burns incident minutes. The OBI guide covers the case where you cannot instrument the service at all.
A protective connection limit is still a design decision. Raising it moved concurrency onto the pricing dependency; the lab’s dependency is a mock with recorded timing, but a production dependency must be confirmed to absorb the extra parallel connections before a limit is relaxed.
Measurement limitations
- Bucket boundaries quantize
histogram_quantileestimates, which is why Prometheus reports 190 ms where the replay harness measured a 173 ms p95. Both point at the same regression; neither is wrong. increase()extrapolates counter deltas to the range boundaries. Use it for rates and magnitudes; take exact request counts from the proxymock summary.- The connection-wait histogram observes
httptraceGetConntoGotConntime. It measures pool acquisition, not server think time or TCP handshakes. - A local 40 ms fixture delay is deterministic evidence, not a production latency model. Replay latency and throughput are directional and machine-specific.
- The 1-second scrape interval is a lab setting chosen so short replay windows contain enough samples; production intervals are longer and quantize more.
- Load mode skips response scoring for throughput. The three-request
functional replay plus
response_diffis the correctness gate.
Clean up
Stop make mock with Ctrl-C. Then remove only this lab’s Compose stack:
make down