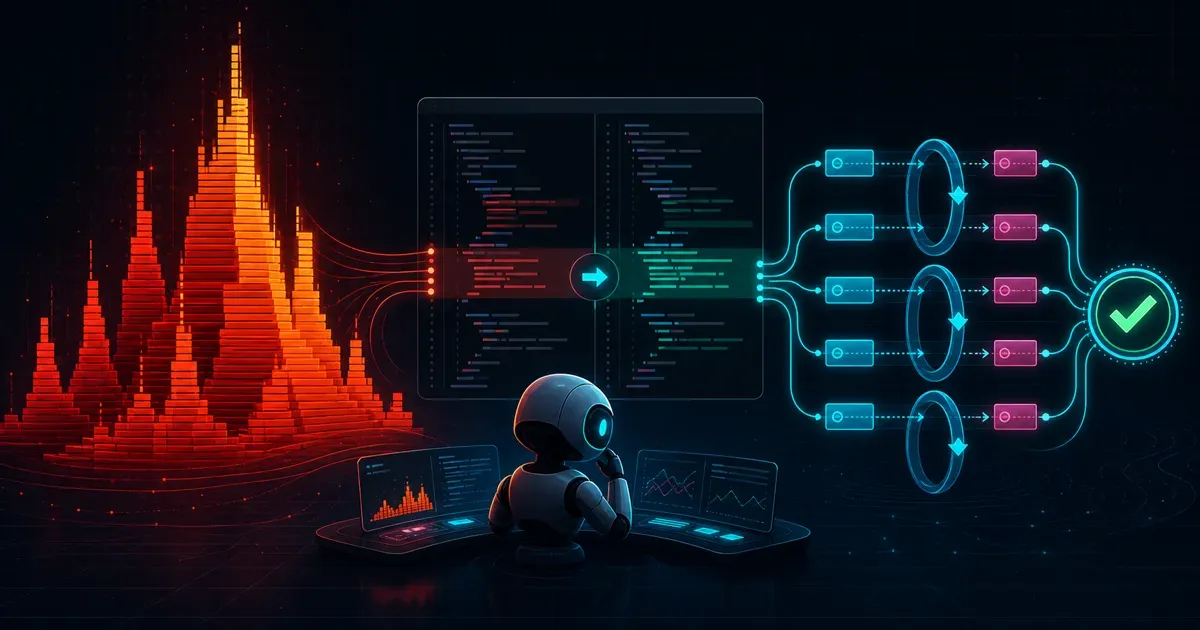
I made an API endpoint 13 times faster. Then I realized my first verification only checked the status, headers, and response schema.
I had not checked the totals. I had made the bug faster.
That is the problem with giving an AI coding agent one kind of evidence. A CPU profile can show where the application is slow, but not whether an optimization preserves behavior. A traffic replay can prove that behavior stayed stable, but not explain why the code burns CPU.
This walkthrough gives the agent two independent witnesses:
- Grafana Pyroscope identifies the hot function and source line.
- proxymock supplies the exact input, repeats the workload, and compares the output.
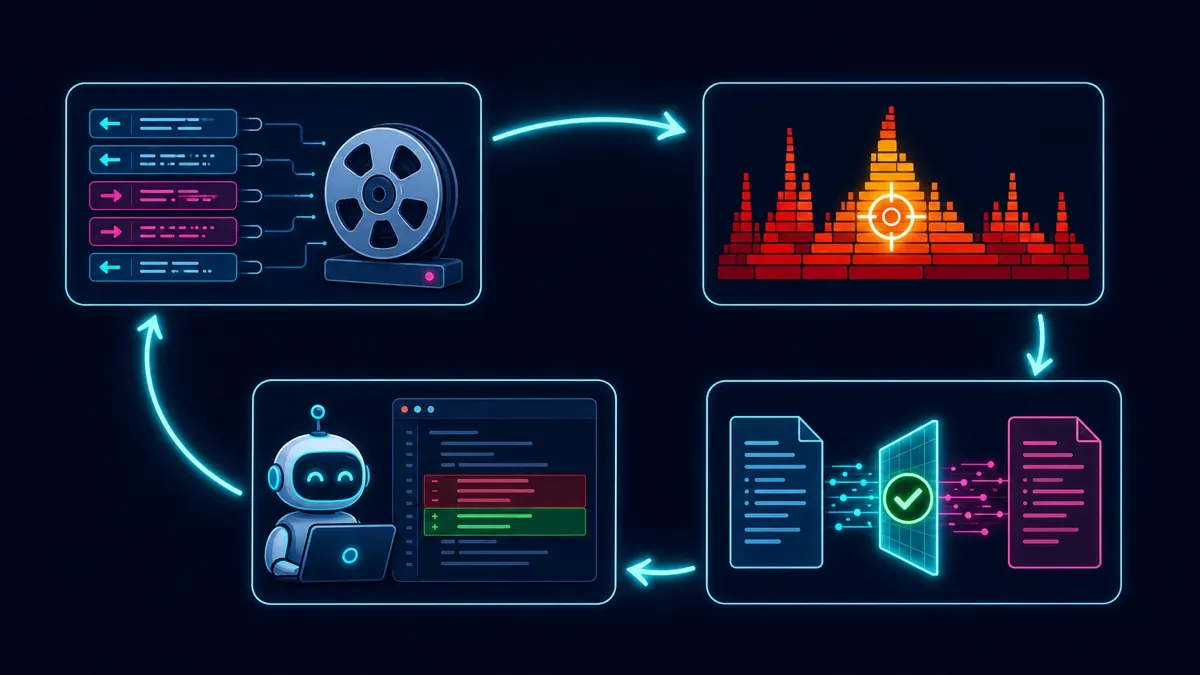
Together, they turn AI code verification into an experiment with two independent checks.
That distinction matters. In Stack Overflow’s 2025 Developer Survey, 87% of respondents expressed concern about AI accuracy and 81% about security and privacy. A 2025 METR study also found that 16 experienced open source developers took 19% longer across 246 tasks with early-2025 AI tools, even though they believed the tools made them faster. Better models help. Better evidence helps more.
What you will build
The companion lab contains a Go API with GET /api/catalog/stats. Its downstream catalog returns 15,120 records, including duplicates and malformed entries. The endpoint is correct but CPU-bound because it deduplicates records with a nested scan.
You will record that traffic, replace the downstream service with a mock, profile a repeatable load, ask an agent to fix the hotspot, and prove that the faster version returns the same stable values.
You need Go 1.23+, Docker with Compose, curl, and an installed and activated proxymock binary.
1. Start Pyroscope and record the contract
Clone the lab, then start Grafana, Pyroscope, and Alloy:
git clone https://github.com/speedscale/mock-lab.git
cd mock-lab/labs/pyroscope
make observability-up
Grafana is available at http://localhost:3000 with admin / admin. This credential is only for the disposable local lab. Alloy pulls the Go /debug/pprof/* endpoints and forwards profiles to Pyroscope, following Grafana’s Go pull-mode profiling pattern.
Start the deterministic catalog dependency:
make catalogIn a second terminal, start recording:
make record RECORDING_DIR=proxymock/recordingIn a third terminal, send one request through proxymock’s recording port:
curl http://localhost:4143/api/catalog/statsStop make record, then verify that proxymock wrote the two RRPair files to the path used by the rest of the guide:
find proxymock/recording -type f -name '*.md'You should see an inbound and outbound exchange under proxymock/recording/localhost. If the directory does not exist, confirm that every terminal is in mock-lab/labs/pyroscope and repeat the record command above. The downstream /v1/catalog response is our traffic contract: an optimization that drops validation or deduplication will change the final totals.
2. Establish correctness and performance baselines
The real catalog is no longer needed. Start the app with recorded downstream traffic and no network passthrough:
make mock RECORDING_DIR=proxymock/recordingIn another terminal, run a three-request functional replay followed by the 8-VU, 45-second load replay:
make functional-replay RECORDING_DIR=proxymock/recording RESULTS_DIR=proxymock/results/baseline
date -u +"%Y-%m-%dT%H:%M:%SZ"
make load-replay RECORDING_DIR=proxymock/recording RESULTS_DIR=proxymock/results/baseline
date -u +"%Y-%m-%dT%H:%M:%SZ"
Keep the two UTC timestamps. The functional replay checks correctness and learns which fields, such as Date, are volatile. The load replay produces sustained CPU activity. Do not use load mode as your correctness check.
3. Give the coding agent both MCP servers
The lab’s mcp.example.json defines a local proxymock MCP server and Grafana’s MCP server. Copy those entries into your agent’s MCP configuration. The Grafana container runs read-only and exposes only datasource, Pyroscope, and navigation tools.
For Codex, run these commands from the lab directory:
codex mcp add proxymock -- proxymock mcp run --work-dir .
codex mcp add grafana -- docker run --rm -i \
  --add-host host.docker.internal:host-gateway \
  -e GRAFANA_URL=http://host.docker.internal:3000 \
  -e GRAFANA_USERNAME=admin \
  -e GRAFANA_PASSWORD=admin \
  grafana/mcp-grafana:0.14.0 -t stdio --disable-write \
  --enabled-tools datasource,pyroscope,navigation
codex mcp list
codex mcp list should show both servers. See the official Codex MCP documentation for configuration scopes and the desktop or IDE setup. If you use another coding agent, follow the equivalent Claude Code MCP instructions or OpenCode MCP instructions, translating the same two entries from mcp.example.json into that tool’s configuration format.
The words “query datasource Pyroscope” do not magically fetch data. The agent uses Grafana’s MCP server to discover the datasource and call query_pyroscope. Grafana documents both the Pyroscope MCP tools and datasource-scoped permissions.
Give the agent this prompt:
Using the Grafana MCP server, find the Pyroscope datasource and
available profile types. Then call query_pyroscope for the Process
CPU profile.

Use matcher {service_name="catalog-api"} and the exact UTC interval
from the baseline load replay.

Identify the hottest application functions and source lines.
Do not propose a fix until you inspect the recorded catalog input
through the proxymock MCP server.
The baseline profile points to deduplicateProjects and runtime.memequal. Inspection confirms the application scans every previously accepted project for every new project: quadratic work on a large catalog.
4. Make the smallest safe fix
Now tell the agent to implement the fix it inferred from the profile and recorded traffic:
Implement the smallest maintainable fix for the CPU hotspot.
Preserve validation and first-valid-record deduplication semantics.
Do not hard-code catalog values or change tests to make them pass.
Run make test and explain the algorithmic and behavioral impact.
In the reference run, the agent replaced the nested scan with constant-time membership checks. The focused benchmark fell from 83.9 ms/op to 0.69 ms/op. That is encouraging, but a benchmark cannot prove the API still returns the right answer.
5. Replay, diff, and profile again
Stop the baseline make mock process, then start the candidate binary against the same recording:
make mock RECORDING_DIR=proxymock/recordingWith the candidate running, paste this prompt into the same agent session:
Validate the candidate using both proxymock and Grafana/Pyroscope.
Do not edit the application code during this validation.

1. Run:
   make functional-replay RECORDING_DIR=proxymock/recording RESULTS_DIR=proxymock/results/candidate
2. Through the proxymock MCP server, call response_diff to compare:
   - proxymock/results/baseline/functional
   - proxymock/results/candidate/functional
   Report every stable-field difference. Do not treat matching status codes
   or response schemas as proof of correctness.
3. Record the exact UTC start time, run:
   make load-replay RECORDING_DIR=proxymock/recording RESULTS_DIR=proxymock/results/candidate
   Then record the exact UTC end time.
4. Through the Grafana MCP server, query the Pyroscope Process CPU profile
   for matcher {service_name="catalog-api"} over that exact candidate interval.
5. Compare the candidate latency, throughput, failed requests, response diff,
   and CPU hotspots with the baseline evidence from earlier in this session.

Report the evidence in a before-and-after table. Declare the candidate valid
only if there are no failed functional requests, no stable response changes,
and the original application hotspot is absent or materially reduced.
The commands and expected evidence are broken out below if you want to follow the validation manually.
make functional-replay RECORDING_DIR=proxymock/recording RESULTS_DIR=proxymock/results/candidateAsk the agent to call proxymock’s response_diff, comparing proxymock/results/baseline/functional with proxymock/results/candidate/functional. The proxymock MCP tools let the agent search local traffic and compare replay results without translating them by hand.
The expected result is no stable-field differences. A matching 200 and schema are not enough.
Now repeat the performance run and query its exact UTC interval through Grafana MCP:
date -u +"%Y-%m-%dT%H:%M:%SZ"
make load-replay RECORDING_DIR=proxymock/recording RESULTS_DIR=proxymock/results/candidate
date -u +"%Y-%m-%dT%H:%M:%SZ"
The validated reference run produced these results on one Apple arm64 machine:
| Evidence | Baseline | Candidate |
|---|---|---|
| Average latency | 168.2 ms | 13.0 ms |
| Throughput | 47.3 req/s | 591.3 req/s |
| Failed requests | 0 | 0 |
| Stable response changes | Baseline | None |
| Dominant application CPU | Deduplication | JSON decoding |
Treat the numbers as directional, not universal hardware guarantees. Compare both versions on the same machine. Pyroscope explains where CPU moved; proxymock supplies absolute workload results and semantic proof.
Give the agent evidence that can disagree
Profiles can expose function names, repository structure, and source lines. Recorded traffic can contain credentials and personal data. Outside this local lab, use a scoped read-only Grafana service account, redact sensitive traffic, retain an audit trail, and decide explicitly where agent data may be sent and retained.
The agent in this walkthrough did not become smarter. It stopped guessing. Pyroscope found the expensive code. The recorded input explained why it was expensive. Replay rejected behavior-changing shortcuts. The second profile showed that the hotspot actually moved.
Flamegraphs find the problem. Replay proves the fix.