The API tests passed. The database didn't.
We shipped v2 of a small products API on a Thursday. Green CI. Green replay. The new search endpoint worked. I went home feeling competent.
Friday morning I ran the same traffic against both builds with proxymock and compared the SQL. v2 had added 80 queries on the same HTTP script. A per-product audit COUNT was firing inside the list handler. A startup migration had run ALTER TABLE and CREATE TABLE audit_log. Total DB time was up 70 ms on a demo that should have been boring.
The HTTP layer never told me. The database layer screamed it.
The lesson: if you only test APIs, you only test APIs. Compare the SQL workload between releases and the regressions show up before production does.
Why HTTP green lies
API tests answer “did we return 200 with the right JSON?” They do not answer “did we quietly 10× our database chatter?”
That gap gets wider with AI-assisted development. The 2025 DORA report found AI adoption correlates with higher delivery throughput and higher instability when control systems lag behind. More code, faster. Same blind spot on the database side.
The classic failure mode is the N+1. One list endpoint. One innocent loop. A SELECT COUNT(*) per row. HTTP response looks fine. Query count explodes.
Schema drift is quieter. A migration runs at boot. New columns appear in INSERTs. An audit table starts collecting writes. None of that shows up in a contract test.
You need a diff of what the app actually executed against the database, not what you wish it executed.
Record two releases, compare the workload
We built a demo for this on purpose. The node-mariadb app is a Node.js CRUD API backed by MariaDB. Flip APP_VERSION=v1 or v2 and you get two simulated releases with realistic database sins baked in.
Clone it:
git clone https://github.com/speedscale/demo.git
cd demo/node-mariadb
make certs && make infra && npm install
Record v1 and v2 with proxymock intercepting both HTTP and MariaDB traffic. The mysql:// prefix on the port map matters — without it you capture opaque TCP, not parsed SQL:
proxymock record \
  --app-port 3001 \
  --map 13306=mysql://localhost:3306 \
  --out proxymock/recorded-v1 \
  --svc-name node-mariadb-v1
Start the app (no TLS to the mapped port while recording), drive traffic, stop, repeat with APP_VERSION=v2 and recorded-v2. The full step-by-step is in the proxymock guide.
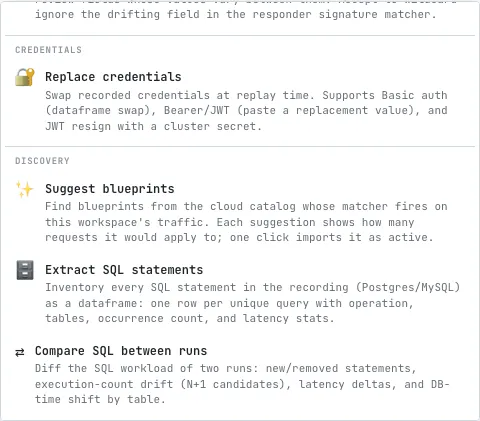
Then open proxymock web and run Compare SQL between runs:
Pick your baseline and candidate:
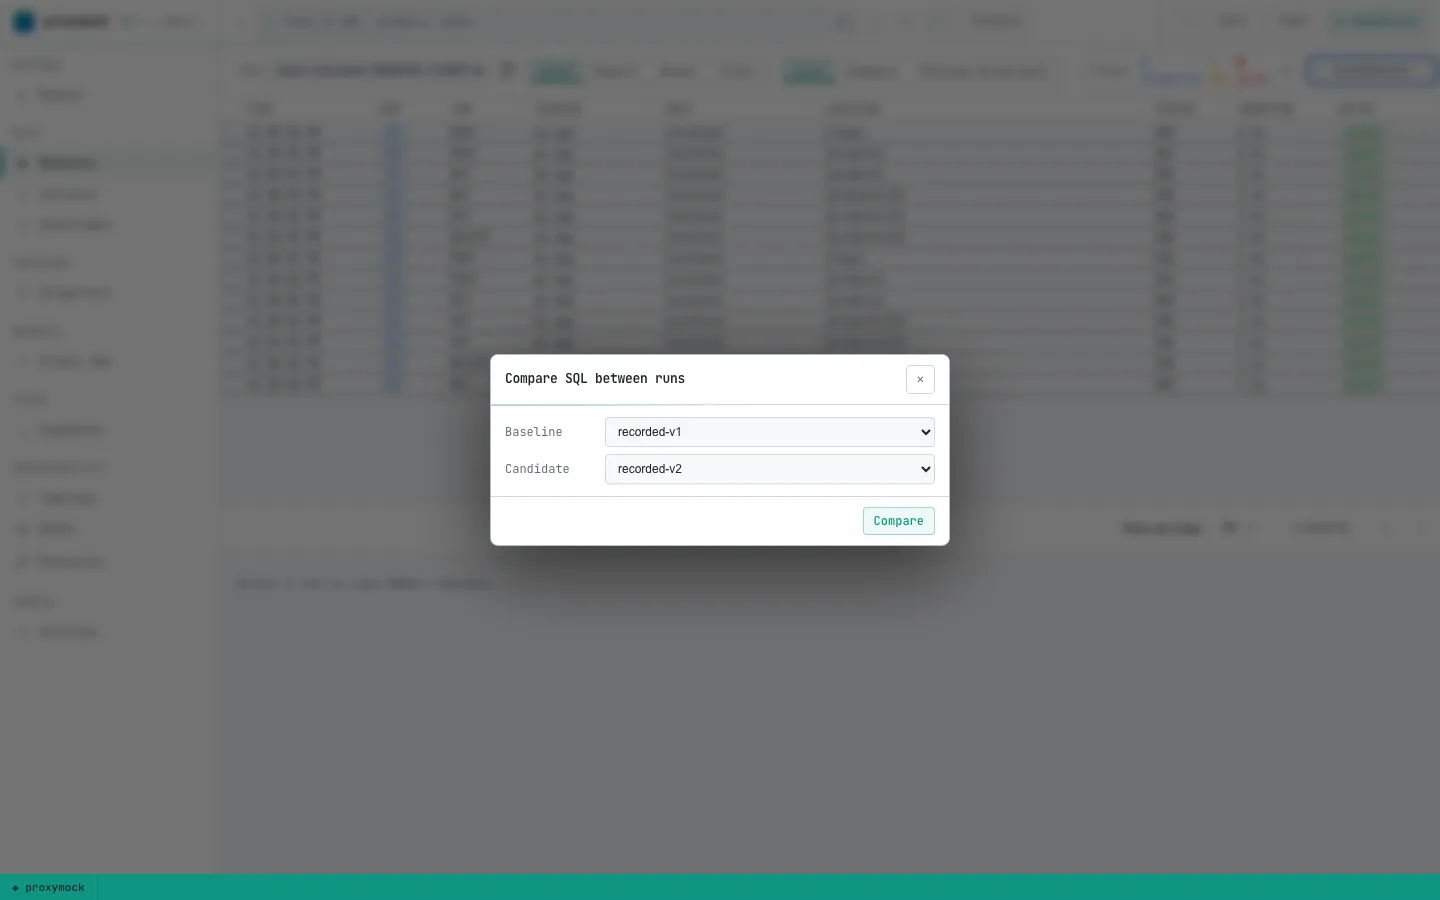
No database credentials. No ORM hooks. Just the wire traffic you already recorded.
What the report catches
proxymock normalizes literals to ?, fingerprints each statement, and buckets the diff into new, removed, changed, and persistent queries. The headline row tells you whether v2 added statements, queries, DB time, or tables before you scroll.
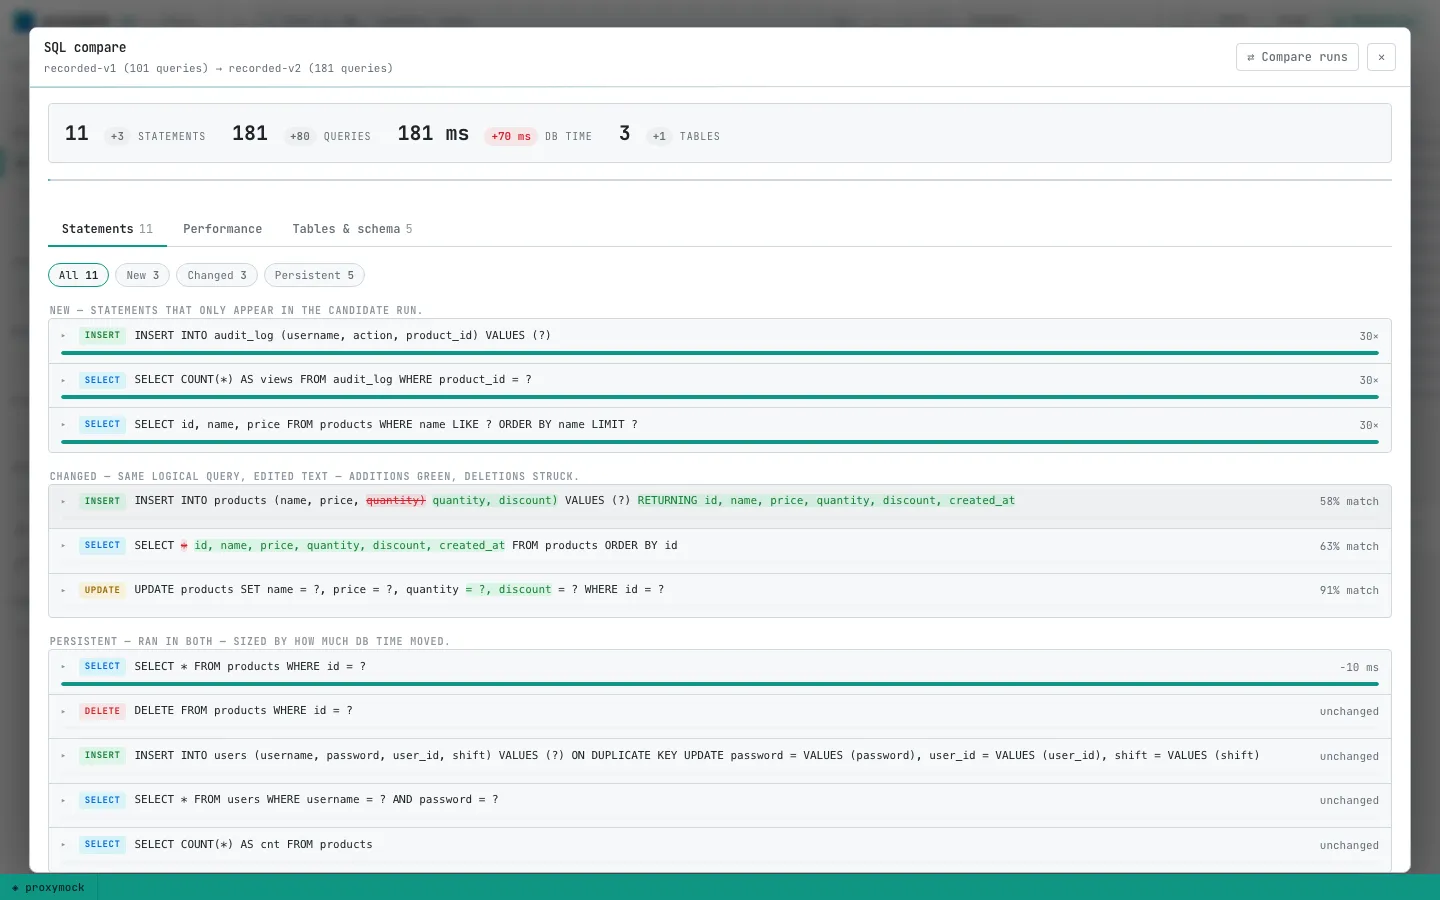
On our demo run, v2 surfaced:
- An N+1 — a new per-product audit COUNT with an execution rate that dwarfed everything else
- Shape changes —
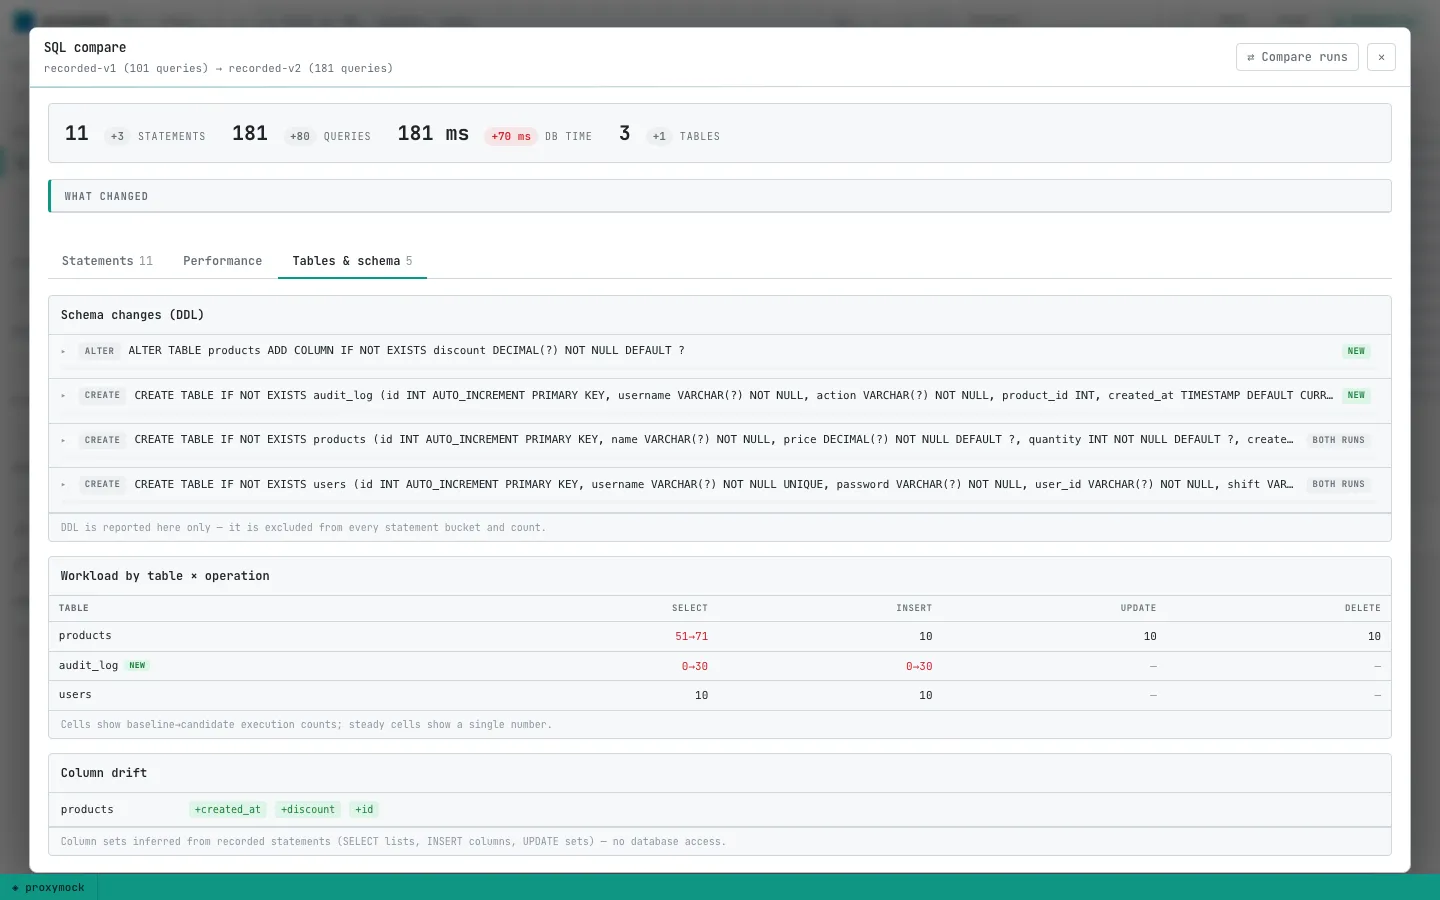
SELECT *became an explicit column list; INSERT grew adiscountcolumn and picked upRETURNING - Schema migrations — DDL captured from the recording, not guessed from migrations folders
- DB time by table —
audit_logappearing from zero and eating most of the delta
The Changed panel shows inline token diffs so you can see exactly what shifted:
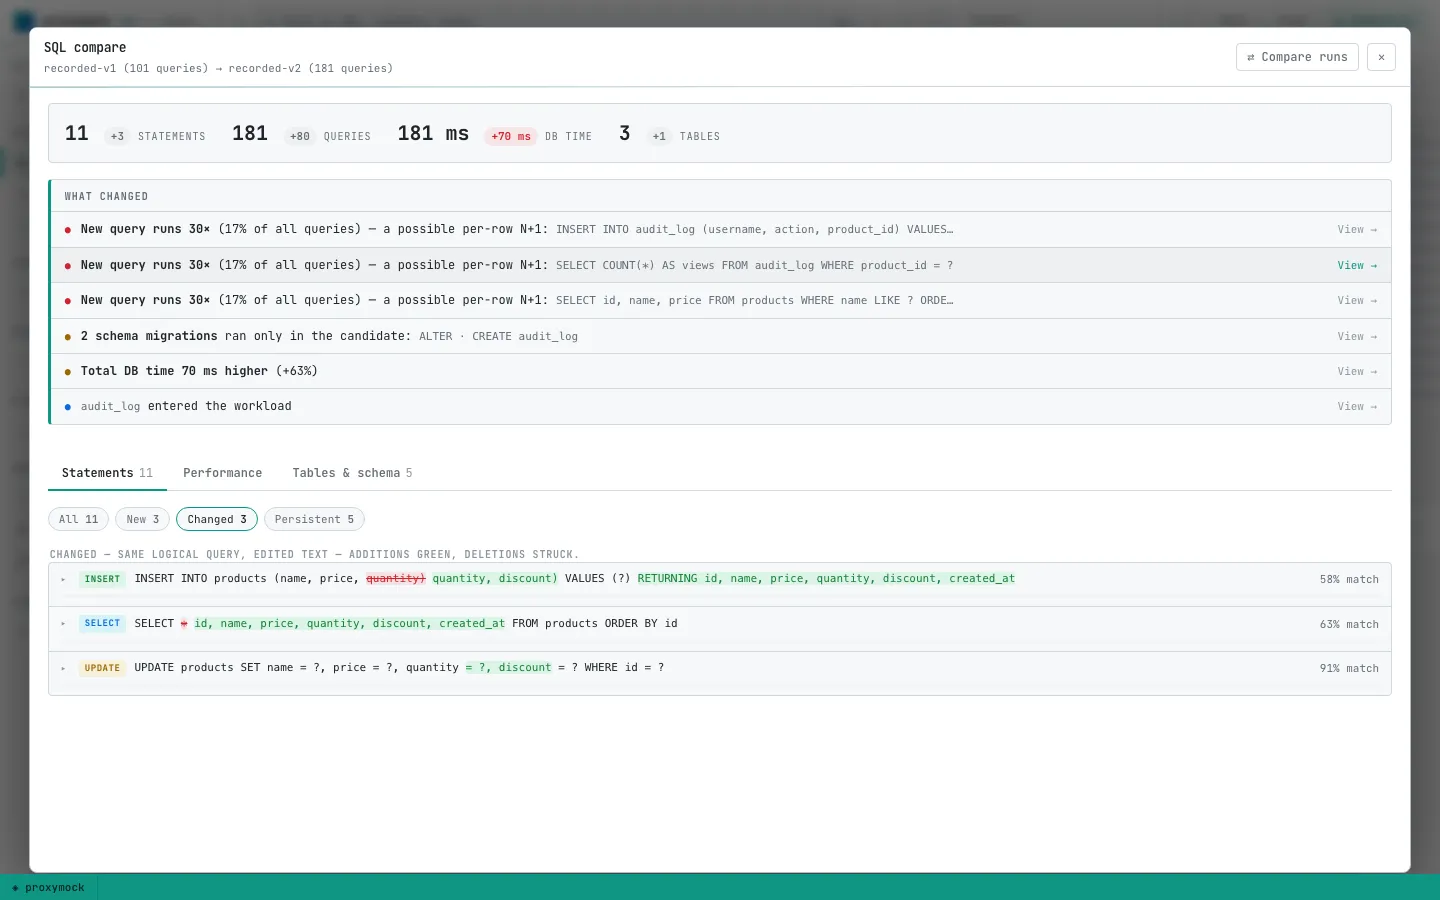
That is the regression story HTTP tests miss. Same endpoint. Different query shape. More columns. More round trips.
Performance panels that mean something
Switch to the Performance chapter and the drift is rate-normalized per 1000 queries. Runs of different lengths still compare fairly. That is how the N+1 stands out even when you recorded slightly different traffic volumes.
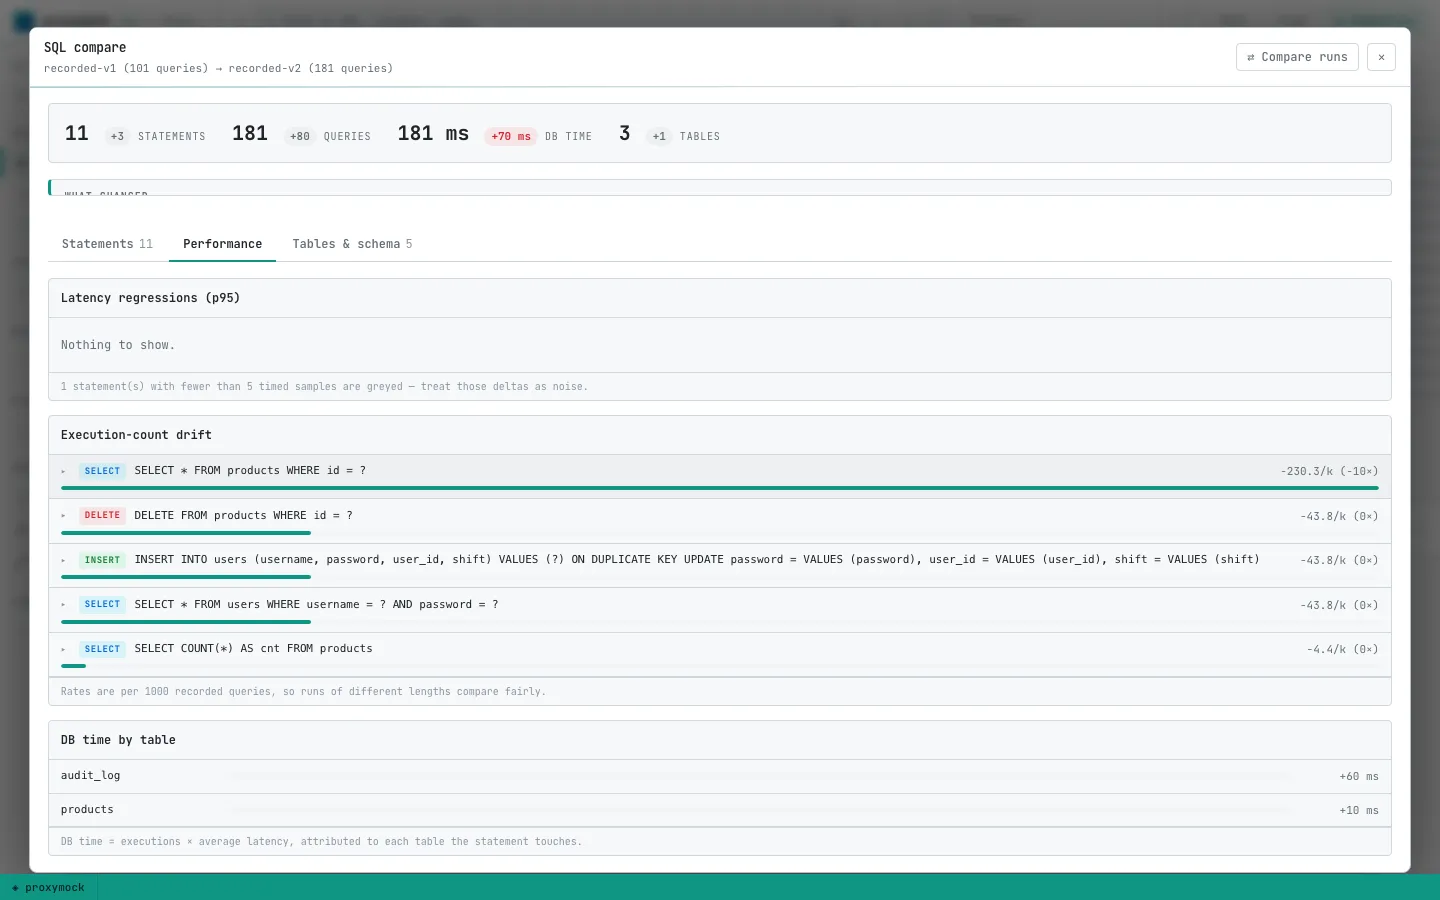
p95 latency regressions only flag when both sides have enough timed samples. Low-sample deltas grey out on purpose. I have been burned by chasing noise from a ten-request recording.
The Tables & schema chapter adds the structural layer: DDL events, an operation × table workload matrix, and column drift inferred from query text. No live schema introspection required.
For CI, the same diff is available headless:
proxymock automation sql-compare \
  --baseline proxymock/recorded-v1 \
  --candidate proxymock/recorded-v2 \
  --output json
Exit code 2 means a side had no SQL — usually a recording that missed the mysql:// map or ran with TLS on the DB connection.
The enterprise angle
My customers ask the same two questions: do we need another agent in the path, and does our traffic leave the laptop?
This workflow needs neither for the comparison itself. You record during a normal test run. The diff runs locally against RRPair files. That is a shorter security conversation than “install our database proxy in every cluster.”
It also complements what you already have. OpenTelemetry tells you aggregate latency moved. SQL compare tells you which statements moved and which tables paid for it. I still want traces for always-on dashboards. I want this diff before I merge a release that touched data access.
Try it on your next release
If you have two builds and a way to drive the same traffic through both, you have enough to diff the database workload. Start with the node-mariadb demo if you want deliberate regressions to practice on.
The API tests passed on my v2. They would have passed in production right up until MariaDB got expensive. The SQL diff caught it on a laptop on Friday. That is the test I wish I had run on Thursday.