It was 2am and I was paying for the privilege.
Something was on fire in production, and I’d done the modern thing: I pointed an AI agent at it. It ingested the dashboards. It read the logs. It walked the traces. Then it handed me back a beautifully formatted paragraph that said, in effect, “latency is elevated on the checkout path.”
I knew that. The page told me that. I had wired three pillars of observability and a frontier model into my incident response, and the best it could do was narrate the symptom back to me in complete sentences.
The dumb part wasn’t the AI. The dumb part was me assuming more telemetry was the answer. It wasn’t. The model didn’t need a better description of the problem. It needed somewhere to try a fix.
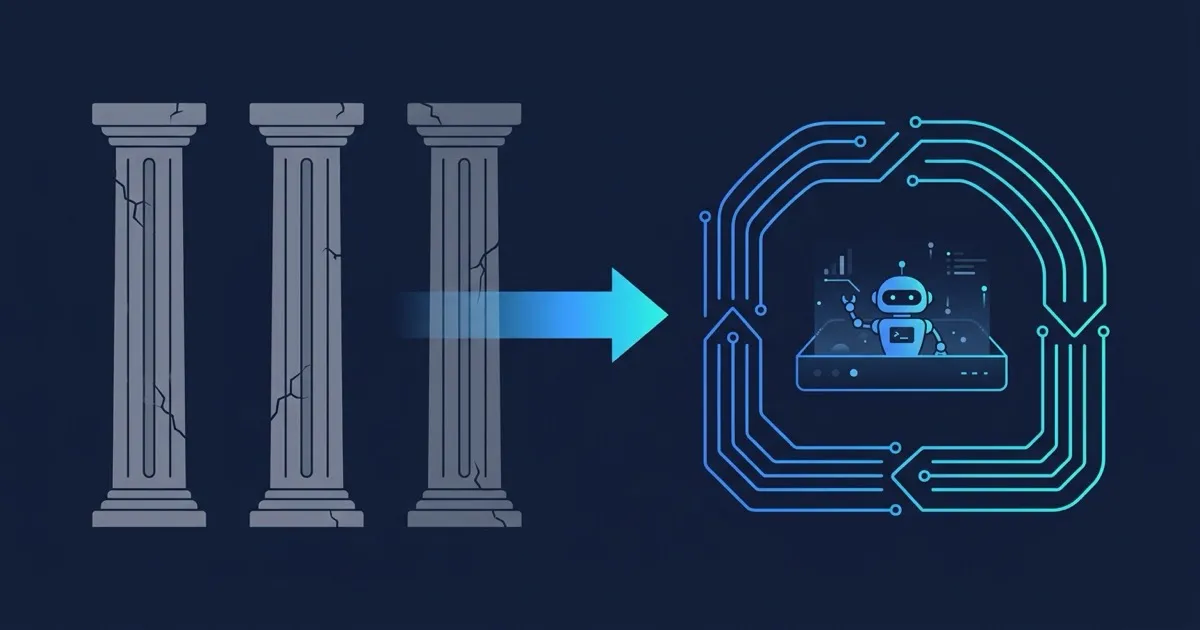
The three pillars were a budget decision
Metrics, logs, and traces feel like physics. They’re not. They’re a compression strategy.
A human on-call can’t read raw production events at volume. So we threw the events away and kept summaries — a counter here, a sampled trace there, a log line if you were lucky. We did that because human attention is narrow and storage was expensive. Both were rational constraints in 2015.
Neither constraint aged well. Enterprise log data is now growing more than 250% year over year, and by most estimates a large share of observability spend goes to storing logs nobody ever queries. Gartner found 36% of enterprises now spend over $1 million a year on observability, and 4% are over $10 million. We are paying a fortune to keep a lossy summary of a reality we already deleted.
That trade made sense when a human was the consumer. The whole point was to fit an incident into one tired brain.
AI doesn’t need the summary
Here’s what changed. The consumer isn’t a tired brain anymore.
The two assumptions under the three pillars both broke at once. Pattern-matching across huge, messy context used to be the expensive part — that’s exactly what a language model does for cents. And curated raw context, the thing we used to compress away, is now the thing the model wants most.
Feeding an AI pre-aggregated dashboards is like handing a chess engine a blurry photo of the board and asking what it thinks. You’ve thrown away the precision before the thing that’s actually good at precision ever saw it. The summary was for me. The model would rather have the game.
So the instinct to build a “fourth pillar” — one more stream of telemetry, now with AI — solves the wrong problem. The bottleneck was never how the data is displayed. It’s that the data is read-only.
Reading isn’t diagnosing
Telemetry answers “what happened.” It cannot answer the only question that matters at 2am: “will this change fix it?”
You can’t read your way to that answer. No volume of metrics, no density of traces, gets you there. The only thing that answers it is a re-run — same inputs, new code, look at what comes out. Diagnosis is an experiment, not a query.
This is exactly where AI-in-the-loop stalls today, and the timing makes it worse. As teams scaled AI adoption, the incidents-to-PR ratio rose 242.7% — a Faros analysis of the 2025 DORA report, which found that AI accelerates delivery while degrading stability. So we’re shipping more change, lighting more fires, and the AI we brought to the fire can only describe the smoke. More velocity, same read-only forensics.
Give it deterministic guardrails
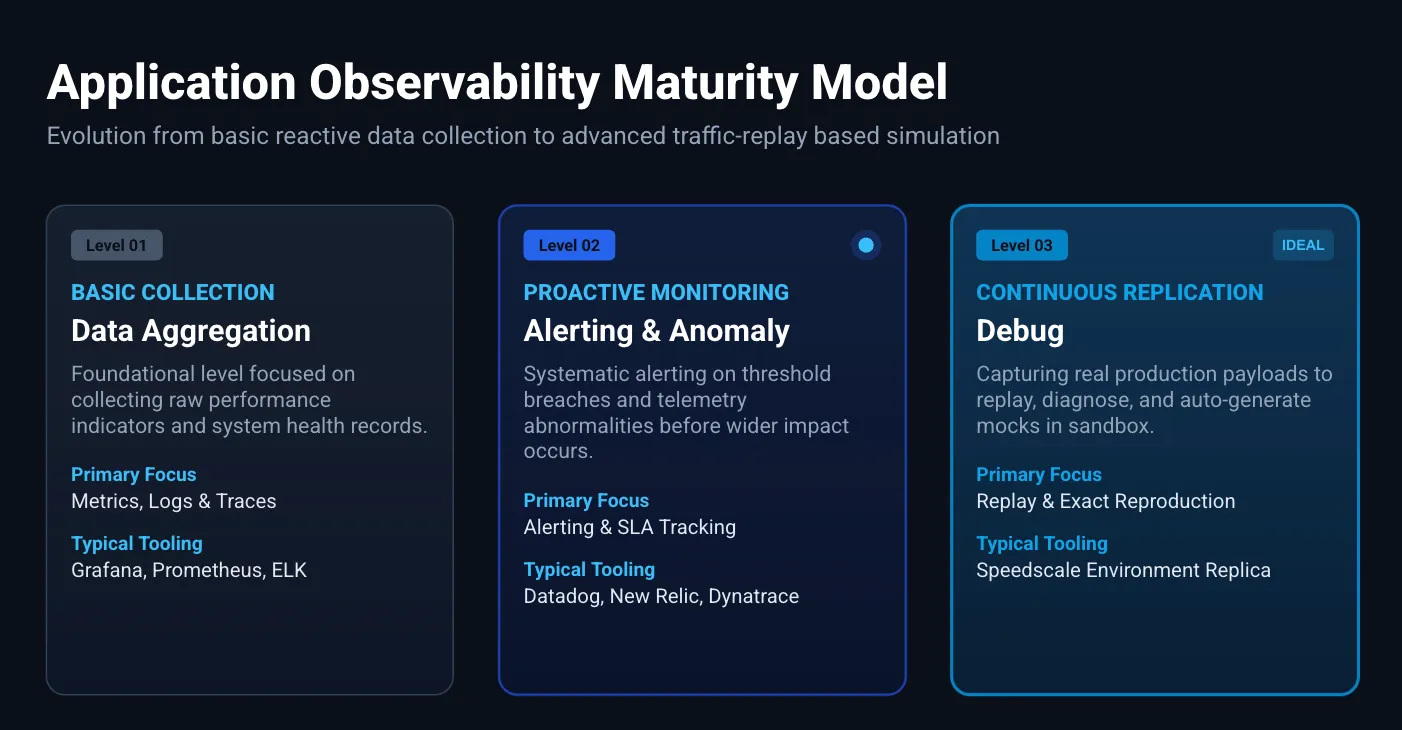
The next maturity level isn’t another data source. It’s a place to run the experiment.
The serious work on AI incident response already points here. The defensible architectures split root cause analysis into two layers: a deterministic layer that produces verifiable findings, and a generative layer that interprets them. The model brings the hypotheses. Something deterministic has to check them. Otherwise you’ve automated confident guessing.
Traffic replay is that deterministic layer. You take real recorded production traffic, run it against a patched build in a sandbox, and watch what comes out. Same inputs every time. Observable outputs. Zero blast radius on prod. It’s the guardrail that lets an agent act without letting it act on customers.
This isn’t theoretical, and it isn’t one vendor’s idea — replay sits next to chaos engineering and contract testing in the same “let the machine try it safely” family. At Speedscale it’s literal: proxymock ships an MCP server so an agent in Claude or Cursor can record real traffic, mock the dependencies, and replay it against a candidate build itself — no human translating the dashboard in between. The agent gets a hypothesis and a way to test it.
The loop, closed
Put it together and the cycle finally closes on its own.
- Alert fires. Telemetry is great at this — it’s the trigger, not the diagnosis.
- The agent forms a hypothesis from the curated context.
- It replays real production traffic against the patched build.
- It diffs the responses against the known-good recording.
- Only then does it propose the fix — with evidence, not vibes.
Metrics, logs, and traces start the loop. Replay is what closes it. That’s the jump from proactive monitoring to what the maturity model calls continuous replication — the agent isn’t watching the system, it’s re-running it.
The next time an agent reads my dashboards and tells me latency is elevated on the checkout path, I don’t want a better paragraph. I want it to have already tried the fix. Twice. And to lead with which one worked.
More telemetry makes the AI a better narrator. A sandbox makes it an engineer.