
A customer emailed on a Tuesday: checkout hung for ten seconds. I opened our tracing tool, punched in the time window, and got nothing.
The trace was sampled out. We keep 1% of traces, like most shops with real traffic do. The one request that actually mattered was in the 99% we threw away.
I spent twenty minutes admiring our observability stack before admitting it couldn’t answer a first-grader’s question: what happened to this person?
Here’s what I know now. You don’t need trace IDs to follow a request across services. You need the thing that’s already in the traffic — the customer’s identity — and a copy of the traffic to find it in.
The trace you need is the one you dropped
Sampling isn’t a bug. Keeping every trace from a high-volume system is absurdly expensive, so you keep a slice and hope it’s representative. It usually is. Right up until an actual human complains about one specific request, and that request is gone.
And sampling is the happy path. It assumes you have a trace at all. Grafana’s 2025 Observability Survey found that “more than half (57%) of organizations” include traces in their stack. More than half. Which means a huge number of teams are debugging distributed systems with no distributed tracing at all.
Even when you have it, the waterfall has holes. The service someone forgot to instrument. The vendor SDK that doesn’t propagate your context. The third-party payments call that’s a black box by definition. The gap is always right where the bug is.
A trace is just a reconstruction
Step back. The request physically happened. It really did travel from your gateway to your auth service to your order service. That journey is a real thing that occurred on the wire.
A trace is one way to reconstruct that journey — by asking every service to narrate its own part and hoping they all agreed on an ID beforehand. That’s a lot of coordination for a reconstruction.
Recorded traffic is another way. And the customer’s identity is smeared all over it. Their email is in an X-User-Email header on one hop, in a JSON request body on the next, echoed back in a response body on a third. That identifier is the actual through-line of the transaction. It’s better than a trace ID because it’s business data — it survives across the services you never instrumented, because they were all handling the same customer.
Filter on a human, not a trace ID
So I stopped looking for a trace and started looking for the person.
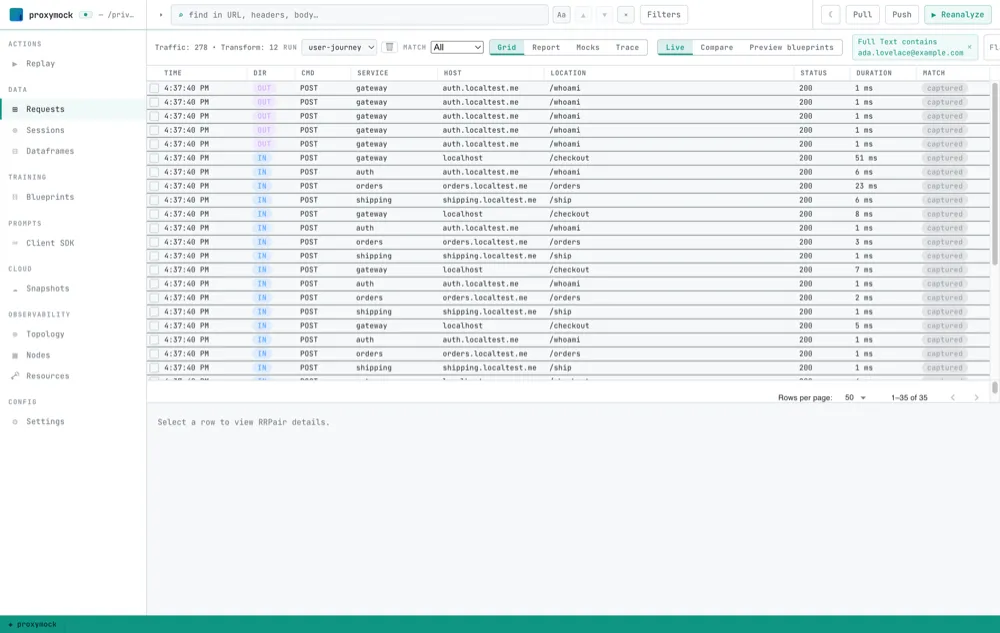
We record traffic with proxymock, which sits in front of and behind services and captures every request and response — no instrumentation, no SDK, no code change. I opened a recording of a four-service checkout flow and typed the customer’s email into a Full Text filter. It matches the whole request/response pair, so it doesn’t care where the email hides.
The grid collapsed from every customer to one, across all four services at once:
The same email showed up in a header on one hop and inside the request body on another:
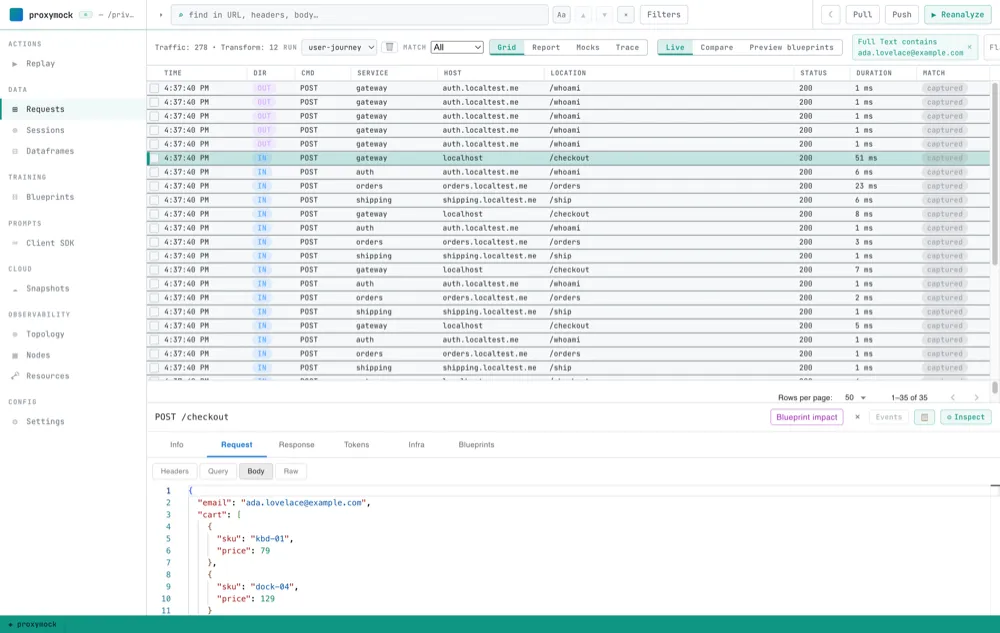
That’s the part a trace ID can’t do. A trace ID only works if every service agreed to carry it. A business identifier just needs to be in the traffic — which it always is, because the traffic is about that customer.
Read the waterfall
Then I switched the filtered list to the Trace view, and proxymock drew the whole thing as a waterfall — one customer, every hop, in order, with timings:
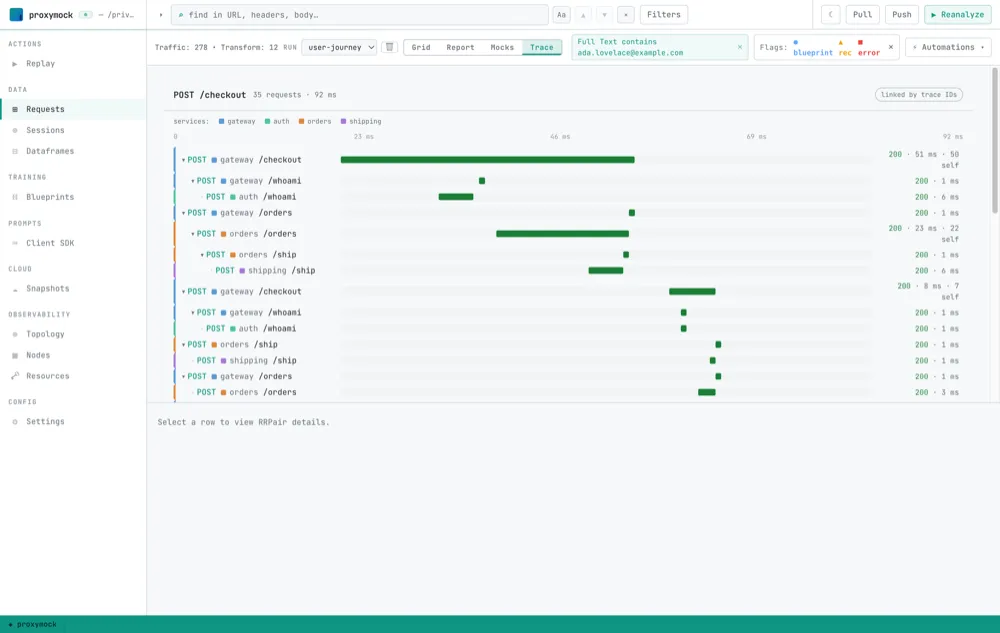
Gateway takes the checkout, calls auth to verify the customer, calls orders to place the order, and orders calls shipping for a delivery estimate. Every bar is a real recorded request I can click into. No spans, no exporter, no sampling decision made three weeks ago.
There’s a traceparent header in that traffic, and the waterfall uses it to nest the hops. But I never filtered on it. The grouping key was the email. That distinction is the whole point: when tracing is missing or broken, the business identifier still works.
When I still reach for OpenTelemetry
I’m not telling you to rip out your tracing stack. I still want OpenTelemetry when I control every service, I’ve instrumented them, and I need always-on aggregate visibility — p99s across millions of requests, alerting, the big dashboards. That’s real, and recorded traffic doesn’t replace it.
But for the Tuesday-morning question — what happened to this one customer — recorded traffic wins. It’s unsampled, it includes the hops you don’t own, and the key you search on is the one the customer literally handed you in their support ticket.
It also clears the bar my enterprise customers actually care about: there’s no new agent to push through change management, and the recorded traffic stays local instead of getting shipped to another vendor. “We can debug this without instrumenting anything” is a much shorter security review than “we’re adding a tracing SDK to every service.”
If you want to try it, the full four-service demo and the click-by-click steps are in the proxymock guide.
The trace was never the source of truth. The traffic was. One email, one filter, the whole ten-second journey.