A customer escalation hit my queue when I was on the customer smoke jumpers team at an observability vendor. My team was the group that parachutes into Fortune 500 accounts one bad week from churning and usually after a big customer outage. The customer had filed a billing dispute three weeks earlier and their on-call engineers were stuck. They had our full stack: logs, metrics, traces, end-to-end instrumentation, every product we sold and some we didn’t. They could see the request came in. They could see it returned a 500. They could not see the body. The trace was sampled out. The log line was truncated at 4KB. The response body was never persisted because storing every response would have cost more than the disputed charge.
I worked for the vendor. I had every internal tool we shipped including the ability to decompile the app’s source code. I spent four hours guessing at the payload and then remembered my life’s goal of being lazy. The customer waited three more weeks.
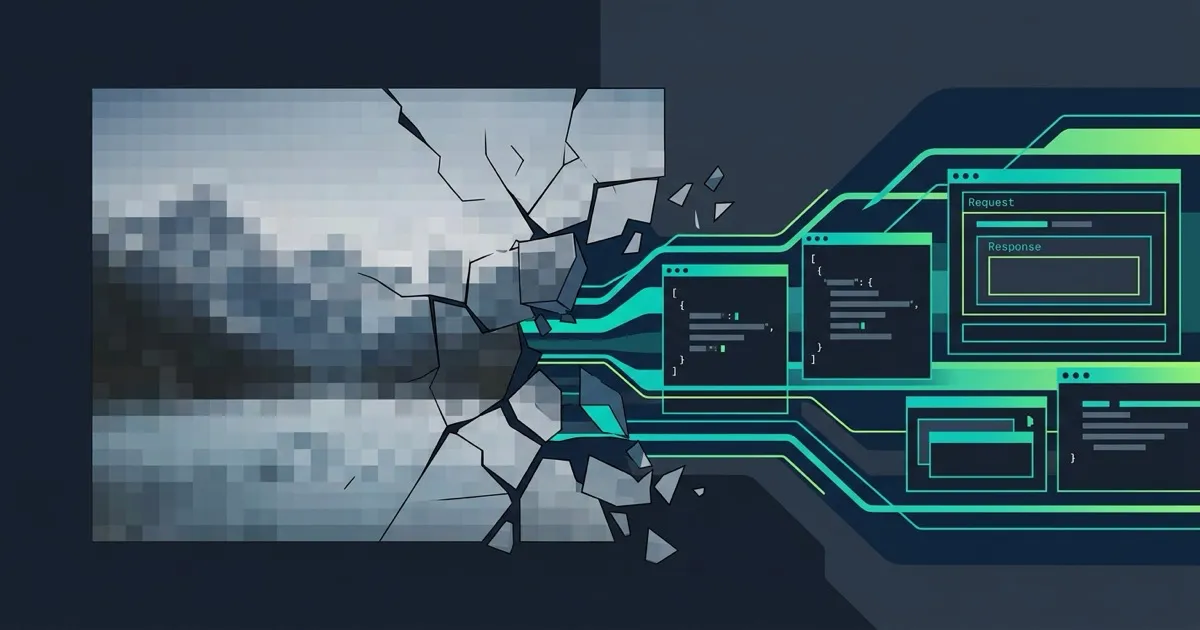
That’s when I stopped treating observability as the answer and started treating it as the thumbnail. Logs, metrics, and traces are a lossy compression of production. They’re great for dashboards. They’re useless when you need the actual bytes.
Here are five things you can do with a traffic data lake that you can’t do with normal observability tools. A traffic data lake is a raw recorded request/response pairs, usually persisted for some amount of time like seven days.
flowchart LR
    R[Real production<br/>request/response] --> S[Sampled trace]
    R --> L[Truncated log<br/>4KB cap]
    R --> M[Aggregated metric]
    R --> T[Traffic data lake]
    S --> X[Lossy thumbnail]
    L --> X
    M --> X
    T --> Y[Original bytes<br/>replayable]
1. Replay last week’s bug instead of guessing at it
The 2025 DORA report found that incidents per pull request are up 242.7% as AI accelerates code velocity. Bugs per developer are up 54%. Given my experience debugging my own AI’s output… I find these number suspiciously low. Fundamentally, the bottleneck has moved from writing code to verifying it doesn’t break production.
Unit tests don’t help here. They test the code your team wrote against the inputs your team imagined. The inputs that actually break prod are the ones nobody imagined: the legacy mobile client sending an Accept-Language header you’ve never seen, the partner integration that double-encodes JSON, the cron job firing at 3:14 with a 90th-percentile payload size.
If you recorded yesterday’s traffic, you can replay it against today’s code before you ship. The same goes for last week’s, last month’s, and the malformed request from the customer who’s about to file a dispute.
2. Load test the shape of reality
Synthetic load tests (k6, JMeter, Locust) test the load you imagined. You write a script. You ramp it up. The script doesn’t know about the long-tail endpoint that gets 0.3% of traffic but holds a database lock for 800ms. The script doesn’t know about the customer who polls your status endpoint every 250ms because their integration is broken. The script knows what you told it.
A traffic lake doesn’t need you to imagine anything. You replay an hour of last Tuesday at 2x speed and find out which endpoint melts. Then you fix it before next Tuesday.
The cost of getting this wrong is well-documented. IBM’s 2025 Cost of a Data Breach report puts the average breach cost at $4.44M. A meaningful fraction of those start as availability incidents that cascade — the kind of incident a realistic load test would have caught.
3. Mock the rest of the org so devs can work offline
Dev environments rot the moment they go up. The payment processor sandbox returns stale data. The claims service has different IDs than prod. The auth provider rate-limits your CI pipeline. Engineers spend two hours a week working around their own infrastructure. I’ve seen hundreds of customer apps and the next time I see a staging environment that mirrors production will be the first. Trying to pull an app out for testing leaves wires hanging out.
A traffic lake lets you generate realistic mocks from recorded responses. proxymock does exactly this: it captures traffic through a passive proxy and turns the recorded request/response pairs into a local mock server. No OpenTelemetry instrumentation, no SDK, no code change.
flowchart LR
    subgraph Prod["In production"]
        A[App] --> P1[proxymock<br/>passive proxy]
        P1 --> U[Upstream API]
    end
    P1 -. records .-> S[(RRPair store)]
    subgraph Dev["On a laptop"]
        D[Dev's app] --> P2[proxymock<br/>mock server]
    end
    S -. replays .-> P2
You can do this with hand-rolled fixtures too. People have for twenty years. The difference is that hand-rolled fixtures drift from prod the day you write them, and recorded traffic stays honest.
4. Cut MTTR from days to minutes
IBM’s 2025 report found organizations take an average of 158 days to identify a breach and 83 days to contain it. Breaches closed in under 200 days cost $3.61M; ones that drag past 200 days cost $5.49M. Time is the entire game.
The same dynamic plays out at incident scale. The difference between “I think it was the malformed header” and knowing is the difference between a one-hour incident and a one-week witch hunt. With raw request/response pairs in a queryable store, the on-call engineer pulls the exact payload from 02:14 last Tuesday and is done.
I should have been able to do this for that smoke jumper escalation. The vendor I worked for didn’t keep the bytes.
5. Find the secrets and PII you’re shipping right now
This is the one engineering leaders consistently underestimate. Salt Security’s 2025 report found 91% of APIs are exposing PII or sensitive data, and 34% of respondents admitted they have no visibility into it. The 2025 Verizon DBIR found stolen credentials drive 88% of basic web application attacks.
The leaks are almost never in the places you’d guess. They’re in error messages echoing the auth token back. They’re in debug headers nobody remembered to strip in prod. They’re in response bodies returning the full user object when the spec said “id only.” You will not find them by reading code. You will find them by grepping a week of real responses.
A traffic lake is a regex away from answering “which endpoints are returning anything that looks like an SSN, today?”
The thumbnail is fine for the dashboard. For everything else — replay, load, mock, debug, audit — you need the original file.
I can pull that customer’s billing dispute payload in thirty seconds now. Back then I spent four hours guessing and the customer waited three more weeks for the wrong answer. The vendor sold visibility. The customer needed evidence. Nobody kept the bytes.