
AI writes code in seconds, but delivery still takes days
AI pushed throughput up 59%, yet median delivery got worse. The bottleneck moved to validation. How replaying production traffic in CI closes the gap.
Browse 32 posts in this category
AI pushed throughput up 59%, yet median delivery got worse. The bottleneck moved to validation. How replaying production traffic in CI closes the gap.
The trace was sampled out. I found the bug anyway — by filtering recorded traffic on the customer's email instead of a trace ID. Here's how to follow one request across four services with no trace IDs and no OpenTelemetry.
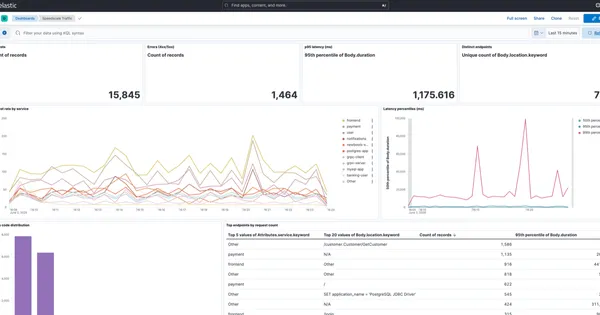
Capture production traffic and store it in your own Elasticsearch with Speedscale BYOC. Pull it locally with es-gather.py and reproduce bugs with proxymock.
Observability tells you what failed—but not how to recreate it. Why reproducibility is the missing fourth pillar, and what that means for incident response.
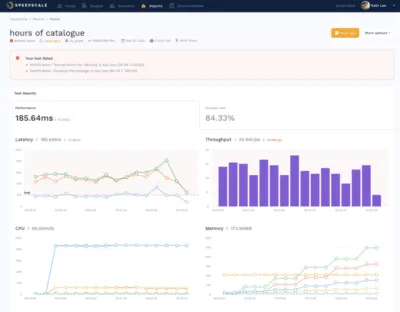
Learn the 4 golden signals — latency, traffic, errors, and saturation — and how to use them for monitoring, alerting, and pre-release testing.
From memes to market meltdowns: Explore how a multi-billion dollar Super Bowl prop bet involving Kim Jong Un pushed prediction markets and SRE teams to.

Speedscale transitions from Kubernetes sidecar-based observability collection to eBPF for lower latency, reduced resource consumption.
Connect an MCP server to your LLM coding assistant so it can pull real production data on demand, validate its assumptions.

See how to get visibility into your Kubernetes workloads and run realistic load tests without writing YAML files or kubectl commands.
Choose the desktop proxymock or the hosted cloud trial to get started.