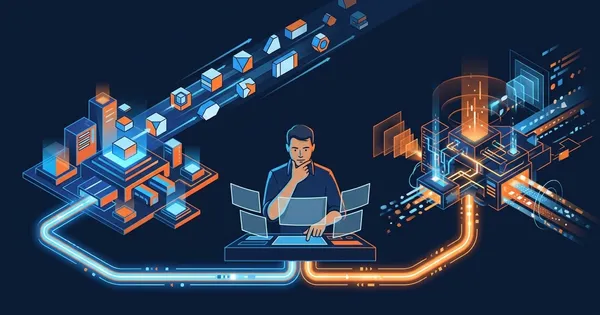
Reliability Engineering in the AI Era
See why reliability engineering must span code, testing, telemetry, and incidents as AI agents erase the boundary between pre-production and production.
Co-founder and CTO of Speedscale, expert in Agentic AI and cloud data warehousing. • 9 posts published
See why reliability engineering must span code, testing, telemetry, and incidents as AI agents erase the boundary between pre-production and production.
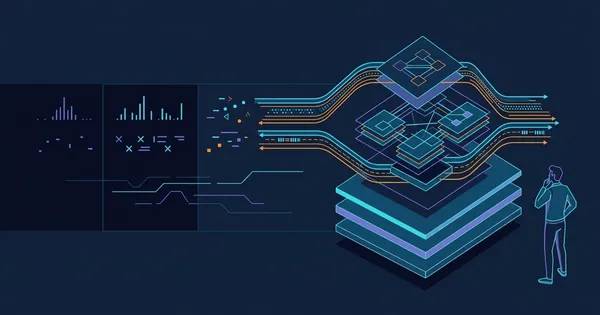
Compare eBPF, sidecars, telemetry agents, OpenTelemetry, APM, and proxies through an evolving ladder of production visibility.
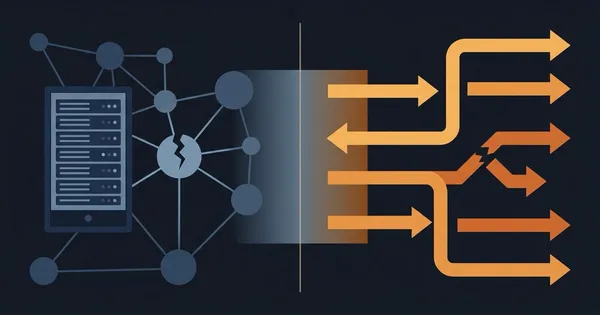
Infrastructure and application chaos break different layers and find different bugs. Netflix built two systems for a reason. Most enterprises buy just one.
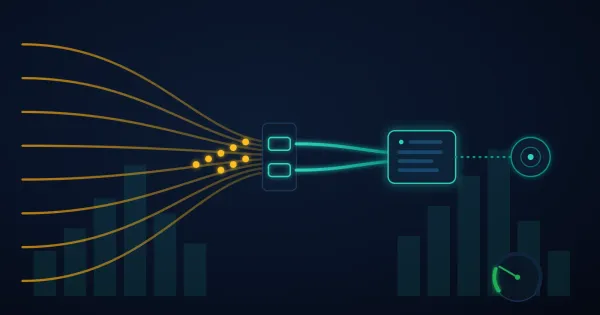
Diagnose a p95 latency regression that CPU profiling cannot explain using Prometheus histograms, then prove the fix with identical proxymock replays.
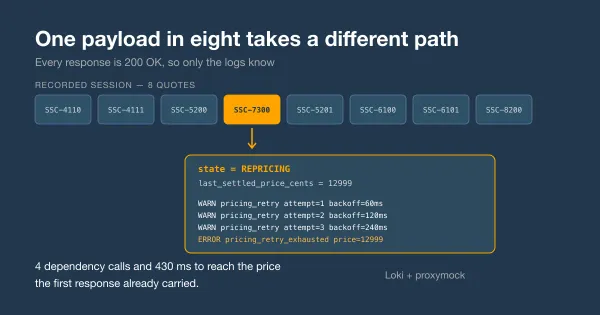
Find the rare payload that sends a service down a retry path, correlate it to the recorded response, and prove the fix with proxymock replay.
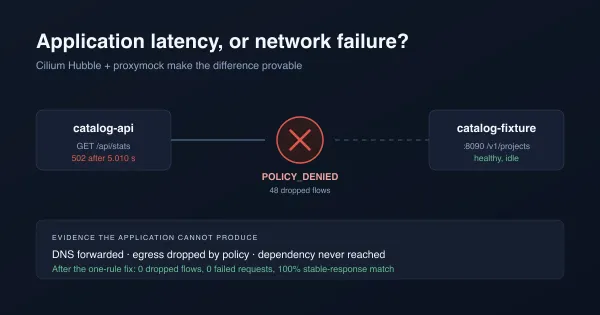
Use Cilium Hubble flow evidence and proxymock replay to prove whether a Kubernetes timeout came from your code, a dependency, or a dropped packet.
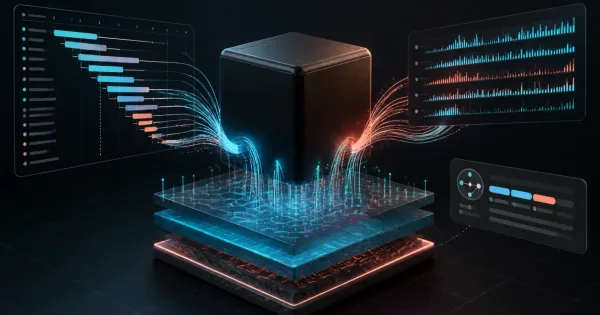
Discover endpoints, RED metrics, and traces in an opaque Kubernetes service with OpenTelemetry eBPF Instrumentation, then replay traffic with proxymock.
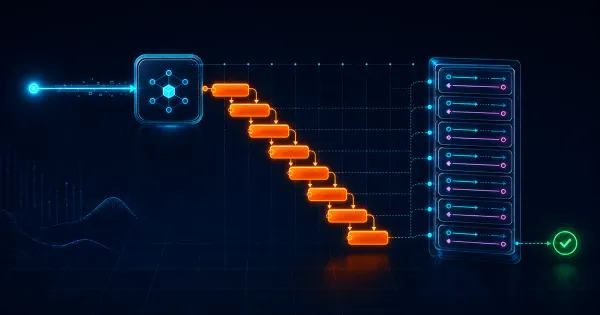
Diagnose serial N+1 API calls with Tempo and proxymock. Replay recorded traffic, inspect trace windows, and prove a concurrency fix preserves behavior.
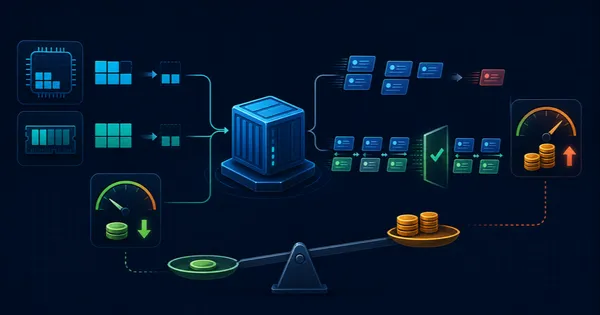
Use OpenCost and proxymock to prove Kubernetes rightsizing lowers cost per successful request without hiding behavior or throughput regressions in testing.
Choose the desktop proxymock or the hosted cloud trial to get started.