Gatling vs. Speedscale for Kubernetes Load Testing
Gatling and Speedscale are two popular performance testing tools and load testing web applications.
The first version of Gatling was released in 2012 by its founder, Stéphane Landelle. What began as an open source load testing tool is now also a paid version called Gatling Enterprise (formerly Gatling Frontline). Gatling offers a testing framework based on Scala, Akka, and Netty.
Speedscale is newer performance testing tool on the market that autogenerates load tests and mocks from real traffic, and replays traffic snapshots to simulate user behavior for more accurate, cost-effective software testing. Rather than writing scripts to contrive tests, Speedscale reduces test cycles from weeks down to just days as well as provisioning tests data from transactions it records in production.
Outline
This blog post compares the two tools on the following criteria:
- Ease of setup
- Developer experience
- CI/CD integration
- Documentation and support
- Pricing
For more Kubernetes load testing comparisons, check out our other posts:
Kubernetes Load Testing: Top 5 Tools & Methodologies
For an overview comparison & to learn the best methodologies for efficient Kubernetes load testing:
Ease of setup
Setting up Speedscale
Speedscale provides you with a Quick Start Guide when you log into the web app. This guide stays at the top of the screen until you finish it, but no need to worry, it’s quickly finished as it only has three quick points. Should you need it again at any point down the road, it can always be easily found in the left-hand menu.
The first time you log into the dashboard it’s very helpful, as it shows you the two ways Speedscale can be installed. You can either use Helm to install the Kubernetes Operator, with the quick start guide showing you exactly what values need to be set. Should you decide that Helm isn’t for you, you can also install Speedscale’s command line interface (CLI) tool speedctl, which is the other option provided by the Quick Start Guide. With speedctl installed, it’s as simple as executing speedctl install and from there, speedctl will take care of the rest.
Once you’ve followed either of these options you will have Speedscale installed in your Kubernetes cluster. From here, you can instrument your services with the Speedscale sidecar and start running load tests.
Setting up Gatling
Getting started with Gatling starts with figuring out what kind of Gatling installation you need. There are three options to choose from:
Getting started with Cloud or AWS/Azure is fairly easy as it’s just a point-and-click installation through the respective platform’s interface. Should you want to self-host then you need to first set up a system with the proper JDK version installed, then you need to set up Cassandra to store your data. As part of this, you need to make sure your network is configured properly. With Cassandra set up, you can install Gatling.
Gatling Enterprise configuration

Note that the previous paragraphs detail what it takes to install Gatling Enterprise / Gatling Frontline. You can also install Gatling’s testing framework locally, in which case you will only have to worry about installing the right JDK version. However, it’s unlikely that you’ll be using a local version in an enterprise environment.
Comparing the two, it’s clear that Speedscale has the easiest setup. There are two different installation options, both of which are scripts that take care of everything for you. With Gatling it’s a much more manual process, with the installation in AWS/Azure even requiring manual work. Speedscale requires you to have some prior knowledge of Kubernetes, whereas Gatling requires you to know about Java and JDK installation.
Developer experience
Working with Speedscale
With Speedscale’s Quick Start Guide, you’ll quickly have your first test running. Because Speedscale works by adding annotations to your Kubernetes Deployments, anyone with prior Kubernetes knowledge should be able to get started working with the tool quickly.
As soon as you’ve instrumented your services with the Speedscale sidecar, Speedscale will start recording and storing traffic. This traffic is used as the base of your tests, so at any point you can easily create a test based on actual traffic that’s been processed in your cluster. More on that in a later section.
A test in Speedscale is easily created by first defining a Snapshot, which represents a period of traffic. From here, you need to either patch your existing Deployment in Kubernetes, or deploy a new Deployment. The key thing is that either of these two needs to have some specific annotations, like so:
annotations: replay.speedscale.com/snapshot-id: “1e4c2995-9acb-4fa7-af1b-9c757e17ed55” replay.speedscale.com/testconfig-id: “standard” replay.speedscale.com/cleanup: “inventory”
These three annotations define what snapshot it should use, like what traffic needs to be replayed. The test config defines how the traffic is replicated, with “standard” being a one-to-one replication. There are also test configs available which will replicate the traffic 100 times, or you can create your own test configs. The cleanup field will instruct Speedscale to return your cluster to the original state it was before running any tests.
Software testing is dead
Traditional testing is difficult to scale. Read how AI-generated API traffic simulations can shift-left and validate your apps quickly.
Working with Gatling
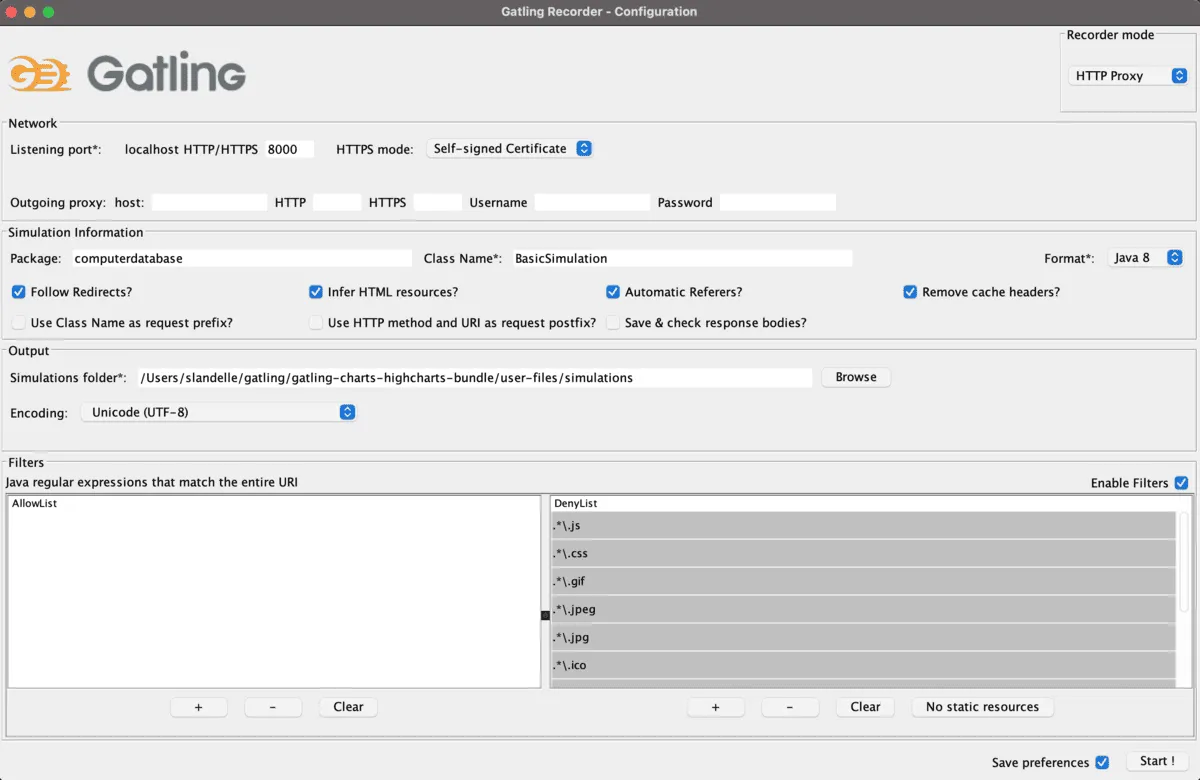
Once you’ve gotten Gatling installed, you can use a recorder.sh script that is installed alongside Gatling. Running this Gatling script will open a GUI where you can configure options like the name of your Gatling project, a package name, whether the load test should follow redirects, as well as a few other options. Once you click “Start!” in the GUI, it will act as an HTTP proxy and you can now visit your site in your browser. Remember that because it acts as a proxy, you will first need to change the proxy settings on your local system to be “localhost”. Now, start clicking around on your web app and act like a user, the recorder will record all your actions. Once you click “Stop” in the recorder interface, the “Simulation” will be recorded in the folder user-files/simulations/
From here, you can take a look at the Gatling test file to see exactly what the recorder has recorded. To run your test, run the Gatling script gatling.sh that was installed alongside Gatling. Doing so, Gatling will check through the user-files/simulations folder and list out all your simulations, which it will present in a menu like this:
Choose a simulation number:
[0] FirstLoadTest
Comparing developer experiences
It’s tough to say which tool is the easier performance testing tool, as both tools are fairly straightforward once you know how they work. However, it’s clear that Speedscale is by far the most modern of the two options. It provides you with a proper CLI to use, rather than different Gatling scripts that need to be run.
Should you want to use a graphical interface, Speedscale provides you with one at app.speedscale.com, where Gatling has to be hosted somewhere.
Speedscale also makes it easier to create realistic performance tests, as it collects data directly from your services. With Gatling, you have to either script and generate the data yourself, or manually listen to traffic with Gatling Recorder their own HTTP proxy. Gatling Recorder’s proxy is not transparent, so your services will need to be manually configured. Gatling Recorder also has a HAR converter which can generate tests from a HAR file. If Speedscale’s automatic solutions aren’t feasible, Speedscale also supports manual tests from a HAR file.
CI/CD integration
Integrating with Speedscale
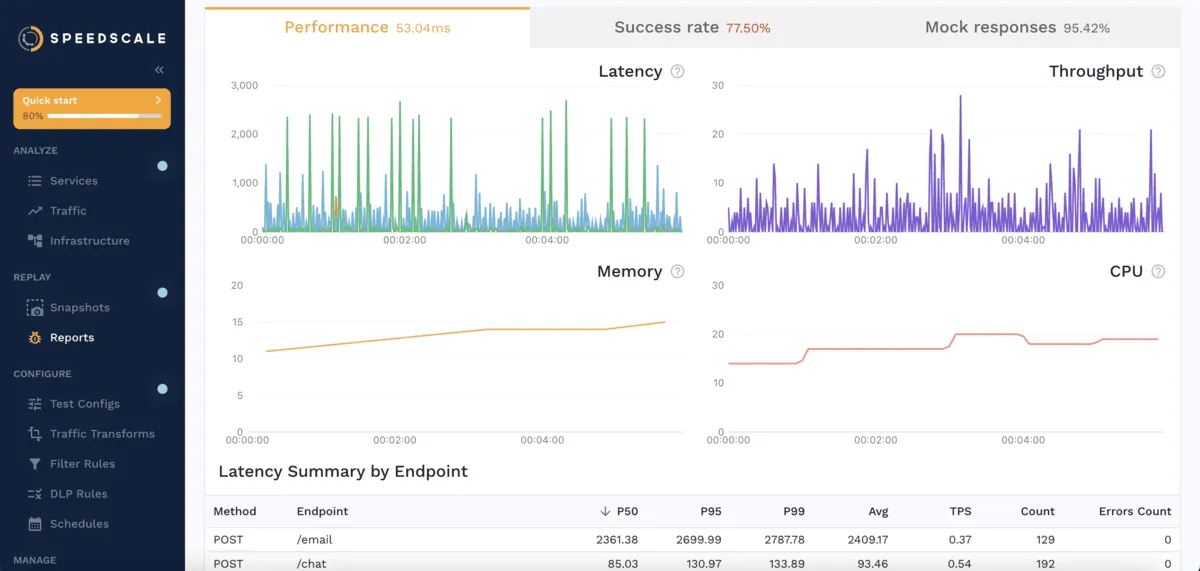
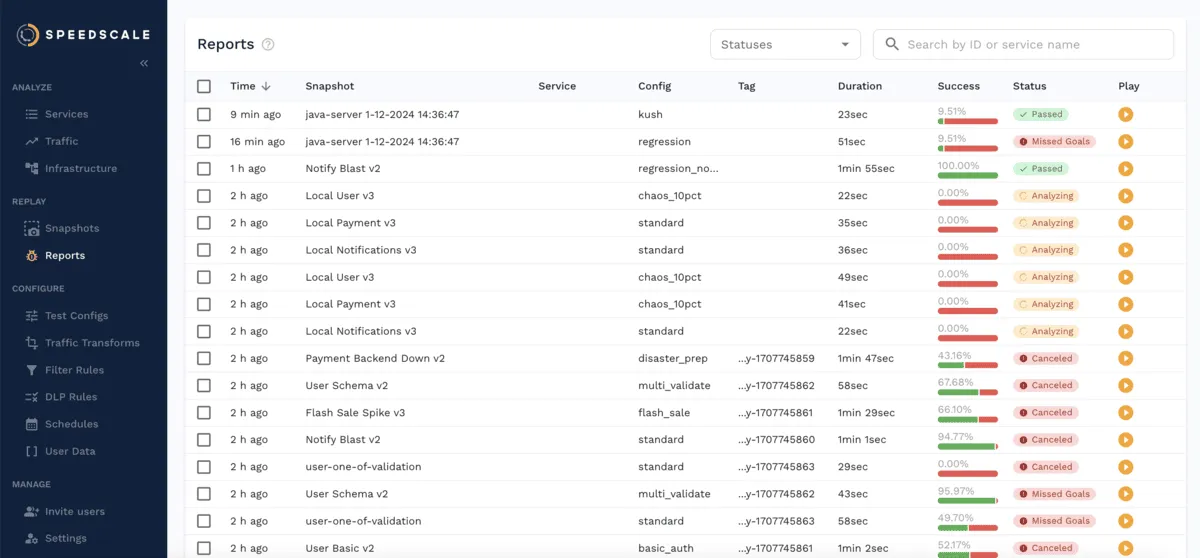
Speedscale is easy to integrate into any CI/CD pipeline seamlessly. When you’ve run a test a report is generated, which has a status field. This status field is an ENUM, defining one of a list of options. In a CI/CD test scenario, this means you can deploy your test, wait for it to be done, check the status report, and from there make a gated check. One key thing to know about Speedscale is that you can define assertions as well as define a load test.
For example, you may decide that it’s not enough to know that your application didn’t crash, you also want to make sure that all requests return a status code of 200. This is possible with Speedscale, and is something you can include in your CI/CD pipeline. Speedscale has official documentation on implementing CI/CD for guides on running a continuous load test. Because it’s just a script, you should be able to implement Speedscale in whatever CI/CD system you are using.
Integrating with Gatling
To implement Gatling into a CI/CD provider, you first need to make sure you have all the dependencies like Java installed. The second thing to do is to figure out a way to deploy the software that’s in your Pull Request. This can easily be done via Helm or some other software like it, but with Gatling it’s something you will have to manage yourself.
If you are using the free, open source version of Gatling, you will have to rely on third-party resources and workarounds to use Gatling in a CI/CD pipeline, as there’s no official documentation. If you are using Gatling Enterprise, you can find documentation on using a Gatling plugin in Jenkins, Teamcity, Bamboo, and a short post on how to do it manually.
There’s no way around it, Speedscale is the clear winner when it comes to continuous integration. It’s easy to get set up, it’s easy to check a report for whether the load test has completed successfully, something that’s not clear how to do with Gatling, and there aren’t multiple versions you need to keep track of.
Documentation & support
Speedscale’s documentation
Speedscale provides a thorough Docs resource to help readers easily find what they need. Clicking through the sections on the left-hand menu, you will find precise and succinct information on what you need to know. Everything is structured in a way that’s understandable, and if you can’t find what you’re searching for by clicking through the menus, you will find a search button in the top right corner which can help you get to what you need.
Speedscale also hosts a Slack community where anyone can join and connect directly with the team to help answer questions.
Gatling’s documentation
On the surface, Gatling has a documentation page that looks like what you’d expect from a corporation. It has many sections, long pages, and tons of links to other resources. However, taking a closer look and reading through something like the installation instructions, it becomes apparent that not much focus has been put into the documentation. You’ll often find that the wording is a bit weird, and at times the way everything is structured can be quite confusing.
Also, as mentioned previously Gatling has three different options; local, self-hosted, or cloud. These three options have three separate tabs for documentation, so you need to be aware of what type of product you’re using.
Pricing
Speedscale’s pricing
Speedscale offers a free, 30-day trial of the product. With this, you get access to the CLI, TLS decryption, and visibility into all the protocols supported by Speedscale. This is mostly used by those who want API observability, API debugging, and contract testing.
Speedscale also offers a Pro and Enterprise version with additional features. With these tiers, you get all the functionality described in this post, like a WebUI, load generation, service mocking, reporting, CI integration, as well as other features like chaos testing. This is intended for those wanting to do API load testing, automated mocking, and complete CI and GitOps integration. Should you need anything beyond this, like more storage or additional security controls, you can reach out for an enterprise version at a custom price.
Gatling’s pricing
Since Gatling is open source, the source code is free to use on GitHub. Otherwise, Gatling Enterprise pricing starts at 89€/month for their baseline “Scout” plan and 356€/month for their “Scale” plan. For teams needing a tailor-made plan, Gatling Enterprise offers a “Custom” plan with enterprise features like SSO and guaranteed support responses.
Lastly, there’s the option of installing from the marketplace on AWS or Azure. The basic package starts at $3/hour, the next one being $9/hour, with the “high-scale” version being $19/hour. It’s unclear how many hours Gatling considers to be in a month, but assuming it’s 730 like AWS and Azure do by default, the cheapest option will then be $2190/mo. This is excluding the underlying hosting cost of VMs in AWS/Azure.
From this, it can be determined that there are options in Gatling that are cheaper than Speedscale, however Gatling is trying heavily to push the options that are more expensive. Also, Speedscale only has three different options to choose from, where it can be a much tougher task to figure out what Gatling package you will need.
Conclusion
All in all, it’s clear Gatling load testing has its place in the world, however it appears it’s not in the world of modern engineering. Gatling seems to be much more focused on the big enterprise companies that haven’t optimized the development workflow in the past decade.
If you are looking for a traffic-driven test tool that can work with more modern technologies and principles, it’s more likely that Speedscale is the choice for you. On top of being able to integrate directly into Kubernetes, it’s also easier to integrate into your workflow like CI/CD pipelines.
If you’ve yet to decide what load testing tools are the right one for you and your Kubernetes infrastructure, check out our other comparisons.