GoReplay vs Speedscale for Kubernetes Load Testing
GoReplay and Speedscale are two popular tools commonly used for load testing. Both share traffic shadowing as a core feature. This article compares both tools against the following criteria:
- Ease of setup
- Developer experience
- CI/CD integration
For more Kubernetes load testing comparisons, check out our other posts:
Introduction to Load Testing
Load testing is a critical component of software development that ensures applications can handle expected loads and provide a good user experience. It involves simulating a large number of users or requests to test the performance, scalability, and reliability of an application. By subjecting your application to these simulated conditions, you can identify bottlenecks, optimize system resources, and prevent potential crashes or downtime.
In the context of GoReplay and Speedscale, load testing is essential to ensure that applications can handle the replayed traffic without breaking. This process helps developers understand how their applications will perform under real-world conditions, allowing them to make necessary adjustments before deploying to production. Effective load testing can lead to more resilient applications, better user experiences, and smoother code deployments.
Kubernetes Load Testing: Top 5 Tools & Methodologies
Compare tools & learn the best methodologies for efficient Kubernetes load testing, and see how to ensure performance of your app under load.
Traffic shadowing and mirroring: A brief overview and benefits
Traffic shadowing, also known as traffic mirroring, is a software testing approach that allows you to record real user traffic, and replay it later against any service. By leveraging existing traffic to replicate how real people use your app, software testing is more accurate and realistic.
Shadowing traffic allows you to:
-
Stop manually writing tests
-
Test networking rules, such as the API gateway or Ingress level
-
Leverage real user traffic to generate tests
-
Use traffic to test autoscaling rules
-
Use recorded traffic to test circuit breaker patterns/failovers
Critical Path Testing
Critical path testing is a type of testing that focuses on the most crucial components of an application, such as the traffic mirroring or shadowing process. In GoReplay, critical path testing involves testing the capture traffic feature, which records live HTTP traffic and replays it to a test environment. This ensures that the recorded traffic is accurate, reliable, and does not negatively impact the production environment.
By focusing on the critical path, developers can identify potential issues early in the development process. This type of testing is particularly important for ensuring that the traffic mirroring process works seamlessly, allowing for accurate and effective load testing. For instance, testing the capture traffic feature in GoReplay ensures that the recorded traffic can be replayed without discrepancies, providing a reliable basis for further testing and optimization.
In summary, critical path testing helps developers optimize the traffic mirroring process, ensuring that the application can handle production traffic effectively. This leads to more robust applications and smoother deployments, ultimately enhancing the overall user experience.
Ease of setup: GoReplay vs. Speedcale
Setting up Speedscale
Speedscale requires a few steps to get started. The provided Quick Start Guide is easy to follow and has three distinct sections:
- Install
- Observe
- Replay
Speedscale can be installed using Helm or by utilizing Speedscale’s own speedctl CLI tool. For both options, the Quick Start Guide provides the exact commands you will need, which you can copy & paste into your terminal.
Helm is one of several installation options. Speedscale does not work by installing onto your local system, rather, it installs directly into your Kubernetes cluster as an Operator. Once you use the Helm chart or the speedctl tool to instrument your services with Speedscale, you’re ready to start.
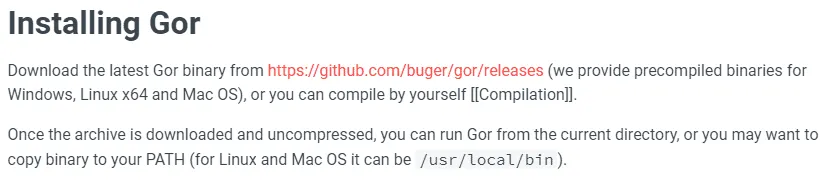
Setting up GoReplay
GoReplay has a somewhat simpler installation process. To get started, you need to download the latest binary from the release page. With the binary downloaded, you then need to add it to your PATH. On Linux, this could mean moving it to /usr/local/bin. At this point, you’re ready to start using GoReplay.
While GoReplay is the easier tool to set up, this is largely because it has less functionality, and doesn’t integrate directly with Kubernetes. Speedscale was designed to support the Kubernetes space specifically, whereas GoReplay is more focused on HTTP traffic in general.
This means you don’t need any specific prior knowledge of GoReplay to use it, while Speedscale requires you to have at least a basic understanding of Kubernetes. If you’re looking for a Kubernetes load testing tool, it’s safe to assume this won’t be an issue.
Generating traffic with Speedscale
To shadow a service with Speedscale, you first need to instrument your service using the speedctl tool. Instrumenting a service with Speedscale adds a sidecar to your service. This sidecar acts as a proxy and captures all traffic going in and out of your service.
This ensures Speedscale will always capture all the traffic linked to your instrumented service–therefore, you will always have relevant traffic available to create snapshots and use.
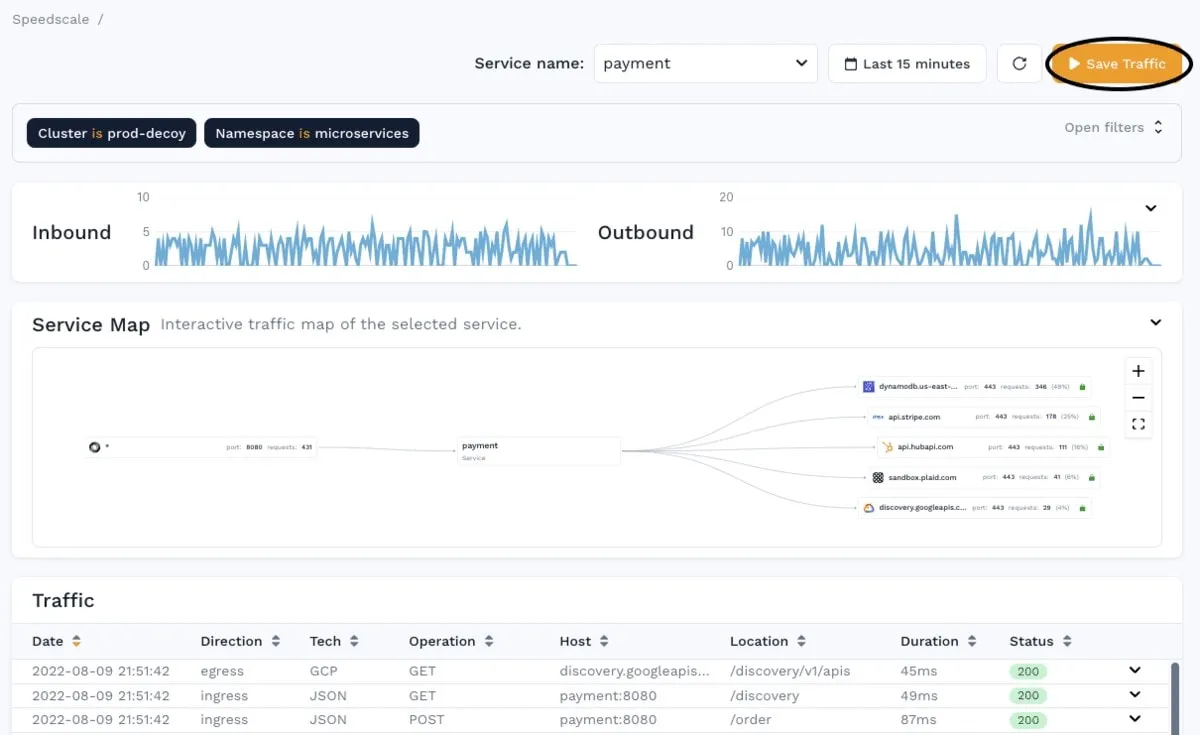
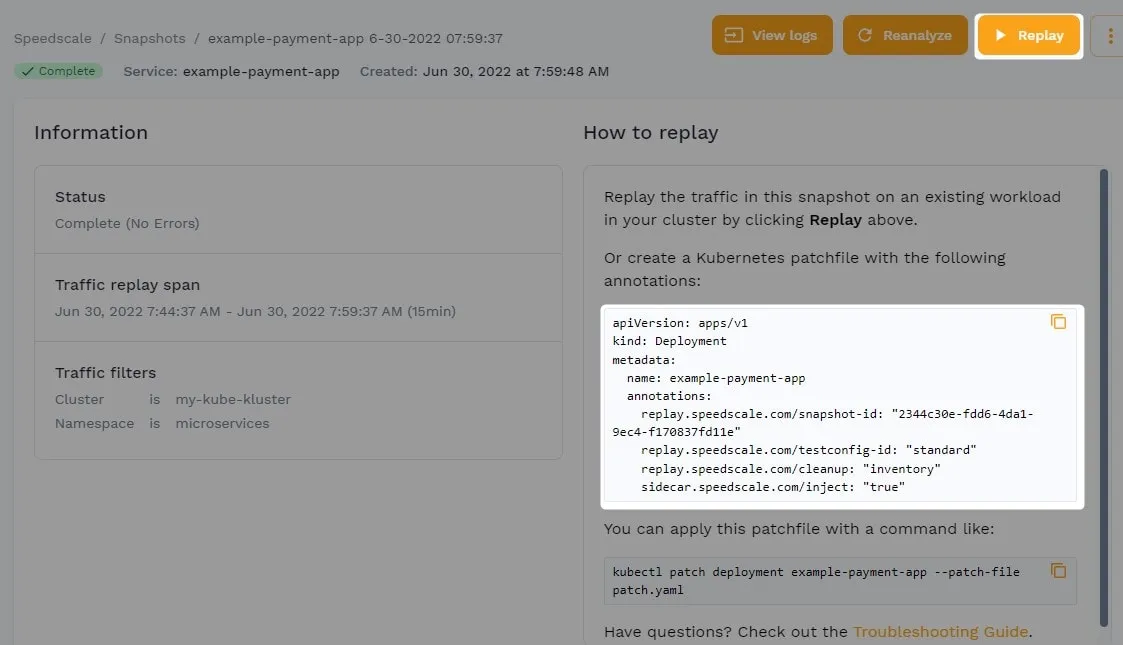
With a snapshot of traffic saved in Speedscale, you can now replay that traffic to any service in your Kubernetes cluster. This is done either by clicking “Replay” in the Speedscale WebUI, adding annotations to an existing deployment, or by pushing a new deployment with given annotations.
Generating traffic with GoReplay
As there is no WebUI for GoReplay, you will spend a lot more time in the terminal. To capture traffic with GoReplay, you need to run:
$ sudo gor –input-raw :8000 –output-file ./requests.gor
This will save all requests to a file. The –input-raw :8000 defines that GoReplay will record any traffic that occurs on port 8000.
Configuration changes can be managed and tested effectively using GoReplay, reducing risks associated with live environments and ensuring stability during critical updates.
Important note: GoReplay needs to run on the same system that you want to record traffic. In a Kubernetes setup, this can be tricky. The best approach is to add a GoReplay container to your pod, use that container to record the traffic, and then save the recorded requests to some persistent storage.
Also, note that GoReplay is not a proxy. Instead, it creates a hook at the system level and records any traffic occurring at the HTTP socket, on a given port.
Once traffic has been recorded, you can use almost the same command to replay the traffic:
$ sudo gor –input-file ./requests.gor –output-http http://staging.example.com
As a GoReplay alternative, Speedscale is continuously recording traffic. GoReplay requires you to manually set up the tool and save the files somewhere, plus, it only collects and replays inbound traffic. Speedscale allows you to mock outgoing requests, so you only load test your own service.
While GoReplay is a great tool, Speedscale wins when it comes to testing services inside a Kubernetes cluster. We’ve shown you how shadowing is implemented in each of these services–the principles of regular load testing are the same. Speedscale allows you to modify the captured traffic and generate more powerful load tests. By comparison, GoReplay only allows you to replay the captured traffic (unless you manually edit the file of the captured requests).
Developer experience
When it comes to tool implementation, Speedscale requires more steps, and GoReplay is as simple as downloading a binary. When you start using these tools, however, you may notice that GoReplay lags behind, as Speedscale has a lot more features and is specifically built for Kubernetes. Additionally, Speedscale’s PRO version comes with a commercial friendly license, which facilitates commercial use and supports high-quality open source development and dedicated support.
If you have a service that you’re running locally, such as a new service or feature that you’re developing, GoReplay is probably the most optimal. It allows you to capture traffic and replay it locally, which is great for a quick and easy test.
When you need to implement shadowing and load testing within your infrastructure–as part of your CI/CD pipeline, for example–Speedscale is a better choice. Overall, Speedscale offers a more comprehensive tool for load testing, as well as API mocking and traffic visualization. Moreover, Speedscale eliminates the risks associated with introducing a third party component in critical system paths, ensuring reliable analysis and testing without impacting application performance.
API Mocking: Top 8 Tools & Methodologies
Understand the key benefits, drawbacks, and use cases for Postman, MockServer, GoMock, MockAPI, and Speedscale.
CI/CD integration
When starting with load testing, most development teams do a one-off test to ensure that their application can handle the expected load. However, using tools like GoReplay, teams can continuously test their systems by capturing and replaying live HTTP traffic. This approach allows for continuous testing with real data, minimizing risks associated with third-party components and enhancing confidence in code deployments.
As the organization and infrastructure grows, however, most teams realize that including load tests as part of their CI/CD pipeline can yield major benefits, such as:
-
Continuous feedback on the resiliency of their application
-
More trust in the CI/CD pipeline, with more parts of the application being tested
-
Closer proximity to continuous deployments, as more parts of the application are verified
-
Predictable infrastructure changes alongside code deployments and configuration adjustments
So, how easily do Speedscale and GoReplay integrate into a CI/CD pipeline?
Integrating with Speedscale
Speedscale has detailed instructions for integrating with CI/CD providers. Depending on the CI/CD provider you choose, specific integration steps can vary a bit, but they all boil down to this basic sequence:
- Create a snapshot
- Deploy the test
- Fetch the report
- If the status says “PASSED”, the check will pass
You can find detailed instructions for integrating with specific CI/CD providers within Speedscale’s documentation. All integrations utilize the speedctl CLI tool, so if your CI/CD provider is not on the list, you should be able to implement a script yourself.
Integrating with GoReplay
As a comparison, GoReplay provides no specific official instructions for integrating with a CI/CD provider, so you must create a custom script.
Before you implement this script, it’s assumed that you’ve used the gor CLI tool to create a file of requests. This file needs to be uploaded (or accessible) to your CI/CD server.
With access to the replay file, you can now run your load test by running:
$ sudo gor —input-file ./requests.gor —output-http http://staging.example.com
While this part is easy with GoReplay, there are a few other areas that you’ll need to handle yourself, which Speedscale handles for you.
The next step is to spin up a new instance of your application where you’ll perform your load test; then, run the test. Verifying that the requests were successful will require a third-party approach, as this capability is not supported by GoReplay. Then, you need to pass that verification off to the CI/CD provider.
Deciding which tool is best for you
In the end, both tools let you record traffic and replay it, and accomplish the goal of traffic shadowing. While GoReplay is a great tool for replaying traffic locally, using it efficiently in a Kubernetes setup is a challenge, so Speedscale may be a better fit for modern architectures.
Speedscale has always been focused on matching the modern nature of a Kubernetes setup. Not only does it integrate directly with your cluster via the sidecar mechanism, Speedscale’s deeper intelligence allows for more flexible shadowing and detailed analysis of network traffic. This enables users to perform in-depth evaluations of application performance and traffic patterns, ensuring more confident code deployments and infrastructure changes.
Take for example, a service where requests must be within a certain prior timestamp (e.g. within the past 2 hours). You’ll have an issue if you record your traffic and replay it 3 hours later, as the timestamp is outdated.
Speedscale can automatically detect this gap and shift the timestamp, so it will still match the age criteria. This automatic detection is also the case with tokens and unique IDs. Even if Speedscale can’t detect and change the values automatically, you can manually configure Traffic Transforms
When it comes to shadowing in Kubernetes especially, Speedscale will likely provide a much better experience since it was built for containers. If you’re still not sure what tool is best for you, check out our other load testing tool comparisons:
Happy load testing!