Traffic replay is a way of capturing real-world traffic, with the purpose of being replayed against services in any environment for more accurate, reliable testing. Imagine you’re an engineer working on an e-commerce website and Black Friday is just around the corner. On that day, your site experiences more load than anticipated and ends up crashing. Ouch.
To find the root cause of the problem and debug the issue, you need to be able to replicate the surge in traffic you saw on Black Friday.
By capturing and storing the traffic from the exact time period when the crash occurred, you can spin up a version of your application in a test environment, replicate the exact conditions from Black Friday, and hopefully be able to identify and resolve the issue.
Traffic replay vs. traffic mirroring
Traffic replay is similar to a known development concept, traffic mirroring, with a few key differences. Traffic mirroring involves duplicating production traffic and sending that copy to another system for analysis. Although helpful for network and security testing, traffic mirroring is difficult to use for application testing. Here’s why:
- Traffic mirroring doesn’t persist any traffic it collects: Without the ability to store traffic and move back and forth through time, it’s very difficult to test situations like Black Friday surges.
- Traffic mirroring also does not perform any application validation: Instead, you as the developer must write fragile and specialized single use validations.
- Raw data from traffic mirroring has not yet been sanitized: For reasons like authentication, timestamp shifting, and protecting sensitive data, raw data often needs to be sanitized to use in lower environments. Traffic mirroring does not take this step into consideration
But traffic replay addresses these issues firsthand, making it the ideal solution for proper application testing. Traffic replay with Speedscale offers features like transforms and data loss prevention to ensure your testing data is accurate, usable, and secure.
An overview of traffic mirroring options in Kubernetes
There are many ways to implement traffic mirroring in Kubernetes. This post helps you make an informed decision on which to choose.
This is just part of why traffic replay can be a powerful addition to any team’s tool belt. Read more about traffic replay in the definitive guide, which aims to provide you with a high-level overview of what traffic replay is. However, this post will be focusing on the specifics of getting it implemented with Speedscale.
The definitive guide to traffic replay
Traffic replay is quickly gaining traction as the best way to recreate production scenarios.
This will include not only the implementation steps you need to follow, but also what to know before you begin the technical implementation.
Topics are often best explained with examples, and in this post Kubernetes will be used as the primary example. However, even if you’re not experienced with, or don’t use, Kubernetes, the explanations of why things work as they do should still make sense, and by extension this guide should still be relevant to you.
What to consider before getting started?
There are some important considerations to weigh before you begin implementing traffic capture and replay.
Understand your goals
It’s important to first get a clear understanding of what your goals might be, whether it’s to optimize performance and reliability, increase trust and confidence in the codebase, or other. Having a specific goal or pain point you want to solve will act as the North Star and help guide the decisions you and your team make.
Determine what traffic to replay
Knowing what your goals are will influence the type of traffic you choose to capture and replay. While you might feel the need initially to capture everything, it’s always best to start small and broaden the scope from there. We often recommend starting with business-critical pages, like a checkout page (for an eCommerce website) or key product pages. Honing in on specific pages help to keep your tools, infrastructure, and storage costs down as well.
Consider the impact on the surrounding environment
Perhaps the most important part of planning your traffic capture and replay implementation is to determine the impact on the surrounding environment. In the case of Kubernetes, there’s nothing stopping you from replaying traffic inside your production cluster, and in some cases that might be what you want.
However, traffic capture and replay has a variety of use cases, one of which is load testing. Load testing checks to see if an application still works properly under a large amount of load. Although the testing should be contained to only your Service-Under-Test (SUT), generating large amounts of load within a Kubernetes cluster runs the risk of impacting other applications if you haven’t configured proper resource limits.
Even in development, you want to make sure that your implementation isn’t going to affect someone else running tests on their own.
Prepare the environment
Once you’ve determined the impact of your implementation, you can start preparing the environment. If you’ve decided to run replays in your production environment, make sure you’ve set proper resource limits. If you’re using a development cluster, make sure it simulates production as closely as possible, e.g., node sizes, network policies, and storage classes.
Consider data privacy
Given the current legislations that exist in the world today (GDPR, CCPA, etc.), it’s highly unlikely that you can capture traffic in production, and replay it 1:1 in your development environment, as there are strict rules governing the storage of personally identifiable information (PII).
This is a crucial step to consider, as PII scrubbing (usually) can’t be done after the fact, and has to be done as part of the capture. This topic is too big to cover in depth in this single blog post, so I encourage you to check out the post on preventing PII in test environments.
Prerequisites for traffic capture and replay
In order to keep this tutorial relevant and to the point, here are a few things you need:
- An understanding of HTTP traffic: You’ll need a general understanding of how HTTP traffic works, like headers, request body, etc. If you’ve yet to gain this understanding or need a refresher, check out this great guide from Mozilla.
- Access to a terminal: The steps in this post will be executed on an Ubuntu Server 22.04 LTS system; however, there will be resources available on how to run steps on other operating systems, where applicable.
- A Speedscale account: Sign up for a free trial, or if you are only interested in following along in a WebUI, you can play around with the interactive demo.
- An understanding of basic Kubernetes principles: You’ll need a general understanding of concepts like Pods, Deployments, and Services. As mentioned in the introduction, this is only necessary in order to follow along with the specific implementation steps. Even without Kubernetes knowledge, you should still gain a proper understanding of the principles of how to get traffic capture and replay implemented.
Setting up the demo application
NOTE: It’s come to our attention that the microservices demo used below does not support ARM-based systems, like those using Apple’s M1 or M2 chip. The maintainers are aware of this. For now, ARM users may have to implement a workaround.
The best way to explain this is by using examples, and as such you’ll first need to set up a demo application. Rather than spending time developing a small unrealistic application, you’d be better off taking advantage of the microservices demo gracefully provided by Google. As described in their README:
Online Boutique is a cloud-first microservices demo application. Online Boutique consists of an 11-tier microservices application. The application is a web-based e-commerce app where users can browse items, add them to the cart, and purchase them. Google uses this application to demonstrate the use of technologies like Kubernetes/GKE, Istio, Stackdriver, and gRPC. The application works on any Kubernetes cluster, as well as Google Kubernetes Engine. It’s easy to deploy with little to no configuration.
When testing out new tools with the core purpose of providing realistic insight, it’s important to make sure that the demo application is realistic as well. This is why you’ll be using this demo app from Google, rather than just replaying traffic to a simple “hello-world” app.
Now, you’ll need a cluster in which to deploy the demo app. You’re free to use any cluster you want, as only standard kubectl commands will be used. If you don’t have a cluster available, let’s go over how to set up minikube.
Setting up minikube
In case you’re not familiar, minikube is a tool developed specifically to spin up local Kubernetes clusters for development. If you’re not using a Linux system, you can find general installation instructions here. If you are using Linux, start out by making sure you have Homebrew installed, which is a package manager for Linux that works as an alternative to apt-get, with the main benefit being that it offers a wider variety of available packages.
$ /bin/bash -c "$(curl -fsSL https://raw.githubusercontent.com/Homebrew/install/HEAD/install.sh)"NOTE: Make sure you follow any instructions output by the end of the homebrew installation.
With Homebrew installed, you can then install minikube by running:
$ brew install minikube
Assuming that no errors appear in your terminal, minikube should now be installed and ready to use. Verify this by creating a cluster (you may receive an error, which is explained in the next paragraph):
$ minikube start
You might experience an error stating that minikube is “unable to pick a default driver.” The rest of the message will contain further information about why minikube is unable to start, which is most likely because you haven’t installed Docker. If you’re using a desktop system, it’s recommended that you install Docker Desktop. If you’re using a Linux server (i.e., a server without a graphical user interface), you’ll want to install Docker Engine instead, which can be easily done using the convenience script provided by the company.
$ curl -fsSL https://get.docker.com -o get-docker.sh && sh get-docker.shThese two commands will first download the installation script, and then execute it. Note that it’s always recommended to verify any script you download, but that step is omitted here for the sake of simplicity.
Before you try to run minikube start again, you’ll need to modify your Linux user so it can use Docker without sudo. Once again, this is done for the sake of simplicity, and should be carried out with caution as it can present a security risk. That being said, it would be a good idea to add your user to the docker group to enable sudo-less docker:
$ sudo usermod -aG docker $USERFor the changes to take effect, you’ll need to log out and log back in. Test that it works by running docker run hello-world, which should download the hello-world image and print out a “hello world” message. If that works, you can then create your minikube cluster by running:
$ minikube start
Give it a minute or so—depending on your internet connection—and you should have a functioning Kubernetes cluster. Test this by running:
$ kubectl get pods --all-namespaces NAMESPACE NAME READY STATUS RESTARTS AGE kube-system coredns-787d4945fb-62qpg 1/1 Running 0 2m29s kube-system etcd-minikube 1/1 Running 0 2m41s kube-system kube-apiserver-minikube 1/1 Running 0 2m41s kube-system kube-controller-manager-minikube 1/1 Running 0 2m41s kube-system kube-proxy-9ttz4 1/1 Running 0 2m29s kube-system kube-scheduler-minikube 1/1 Running 0 2m41s kube-system storage-provisioner 1/1 Running 1 (118s ago) 2m40sBefore moving on to the next step, you’ll also need to make sure that metric-server is enabled in your cluster. In minikube, this is done by running:
$ minikube addons enable metrics-serverDeploying the demo app
Now that you have a working cluster, you can get to work on deploying the demo app. Start by cloning the GitHub repo so you have all the needed files available locally, then change into the directory of the demo app.
$ git clone https://github.com/GoogleCloudPlatform/microservices-demo && cd microservices-demoIf you look at the files in the directory ($ ls), you’ll see that you’ve downloaded all the files needed to build and develop this application. For the purposes of this tutorial, you only need to be concerned about the file ./release/kubernetes-manifests.yaml, as that contains definitions for all the needed Deployments, Services, etc.
To get the application deployed, run the following command:
$ kubectl apply -f ./release/kubernetes-manifests.yamlYou can verify that the application is deployed by running:
$ kubectl get pods NAME READY STATUS RESTARTS AGE adservice-85464c648-dvcxp 0/1 ContainerCreating 0 16s cartservice-59655cfc5f-74k9l 0/1 ContainerCreating 0 17s checkoutservice-b48888c64-4zk28 1/1 Running 0 17s currencyservice-75db674968-glpxf 0/1 ContainerCreating 0 16s emailservice-768497cf5d-x2dsk 1/1 Running 0 17s frontend-555565c6dd-bmxzb 0/1 ContainerCreating 0 17s loadgenerator-7668f8fcf7-79q5c 0/1 Init:0/1 0 16s paymentservice-99969bfd-fg6nc 0/1 ContainerCreating 0 17s productcatalogservice-7ff5d874c6-gwvnc 0/1 ContainerCreating 0 17s recommendationservice-6d5554b8b-b2ps9 0/1 ContainerCreating 0 17s redis-cart-7f9cc97c69-k6x2b 0/1 ContainerCreating 0 16s shippingservice-5454bf7586-7tm8k 0/1 ContainerCreating 0 16sWait until all Pods are in the running state, which shouldn’t take more than a minute or two. At that point, you have a Kubernetes cluster with a functioning demo application.
One added benefit of using this specific demo application is that it also deploys a load generator Deployment, which takes care of generating user traffic to the different services. While it’s not generating the same load that a regular e-commerce website would receive, it does allow you to work with traffic that closely resembles real user behavior.
The last step is to verify that the application works as expected, which is done by checking the response from the frontend service. The frontend service receives traffic on port 80—you can verify this by running kubectl get services.
By using the kubectl port-foward TYPE/NAME [LOCAL_PORT:]{REMOTE_PORT} command, you can access the Service by forwarding traffic to a local port. So, to access the microservices demo locally on port 8080, execute:
$ kubectl port-forward svc/frontend 8080:80If you’re using a desktop system, you can now open your browser and see the microservices demo. If you’re using a server-based system, you can verify it by running:
$ curl localhost:8080
It’s important to note that this should be done in another terminal window, as the cancellation of the kubectl port-forward command will close the connection.
How to set up Speedscale
There are many traffic replay tools available on the market but only one with a sole focus on Kubernetes: Speedscale. By only focusing on this specific platform, Speedscale can take full advantage of Kubernetes-specific features like Sidecars and Operators.
GoReplay vs. Speedscale
Both Speedscale and GoReplay boast traffic shadowing as one of the unique selling points of the product.
If you want to follow along with the next steps and haven’t yet signed up for a Speedscale trial, now is the time to do so.
The next section covers how to use the speedctl command line tool to initialize a wizard, guiding you through the installation process. Let’s cover what those steps are first.
- Choosing the infrastructure
To start off you’ll be asked what infrastructure you’re running on, e.g. Kubernetes, Docker or VM. This is done so Speedscale can optimize for your specific infrastructure. For example, if you’ve selected that you’re using minikube and you don’t have metric-server enabled, the wizard will provide you with the exact command you’ll need to enable it.
- Installing the Operator
When you run the speedctl install command, it will check your current kubectl context and determine whether the Operator is already installed. If not, it’ll ask you to install it.
- Enabling DLP
Data Loss Prevention (DLP) is the process that helps redact PII from captured traffic; however, that’s not needed in this tutorial.
- Choosing a Namespace and resource type
This step is a way for Speedscale to narrow the scope of what applications to instrument, aiming to simplify the process as much as possible for the user.
- Adding Speedscale
This is just a simple question to let you instrument either all or only a subset of services in a given Namespace.
- Unwrapping inbound TLS
The traffic generated as part of the microservices demo is plain HTTP, so currently, there’s no need to enable this. In production you will likely have to enable this, as Speedscale otherwise can’t read the traffic going in and out of your application—and by extension won’t be able to replay it properly.
The exact steps needed to unwrap TLS will depend on your application, but in general it will be a case of pointing Speedscale to your certs.
- Adding annotations
The last part of the wizard concerns asking you whether or not to add annotations to your services. This is an important step to cover, as it reveals the fundamental principle of how the Operator knows what applications to instrument with the sidecar.
In this example the annotation sidecar.speedscale.com/inject: “true” is added, which simply tells the Operator to instrument this Pod with the sidecar. As you’ll see later, annotations are also used to initiate replays, define SUT behavior during tests, and much more.
Installing and configuring Speedscale
With that covered, you can go ahead and download the speedctl command line tool. You’ll use this to install Speedscale into your cluster, and in the future, you can use it to interact with different Speedscale resources like traffic snapshots and test reports.
$ brew install speedscale/tap/speedctl
Once the CLI installation is complete, you’ll need to initialize the tool. In other words, it has to be linked to your account. Go ahead and run:
$ speedctl init
This will take you through the initialization, in which you’ll be asked for your API key. This can be found on your profile page.
Speedscale’s way of capturing traffic from applications is to instrument them with a sidecar proxy. This proxy will read every request going in—and out—of your application, which is then sent to the Speedscale cloud to be stored.
This process is taken care of by the Speedscale Operator. In case you’re not familiar with what an Operator does, I encourage you to check out this overview from RedHat. The simple version is that an Operator interacts with your cluster directly, managing state and resources. And in this case, it installs sidecars into your Pods.
To get the Operator installed, and to inform it of which applications you want to have instrumented, run the following command:
$ speedctl install
This will guide you through the wizard mentioned above where you’ll be asked what sort of infrastructure you’re running on (minikube), whether you want the Operator to be installed (yes), and whether you want to enable Data Loss Prevention (no). As mentioned before, this tutorial will not include any PII, and as such there’s no reason to use DLP. If you’re going to be using Speedscale in a production environment, you need to seriously consider enabling this option.
After declining DLP, the Operator is going to be installed, after which you’ll be asked about which Namespace your service is running in. If you’ve followed this tutorial so far, you should choose [1] default. Then, you want to choose [1] Deployment when asked for the type of workload your service is.
Now the wizard will ask you whether you want to add Speedscale to all Deployments in the chosen namespaces, which you do. After this, choose no for unwrapping inbound TLS, as that’s not needed for this tutorial. Now confirm that you want the annotations added to your workloads, and lastly, decline the addition of Speedscale to another workload.
Where does the traffic go?
While you’ve been reading through the above explanation, Speedscale has been capturing traffic from the microservices demo, which you can see by going to the traffic viewer in the WebUI. Remember the load generator installed along with the microservices demo? Here you can see what traffic it’s generating.
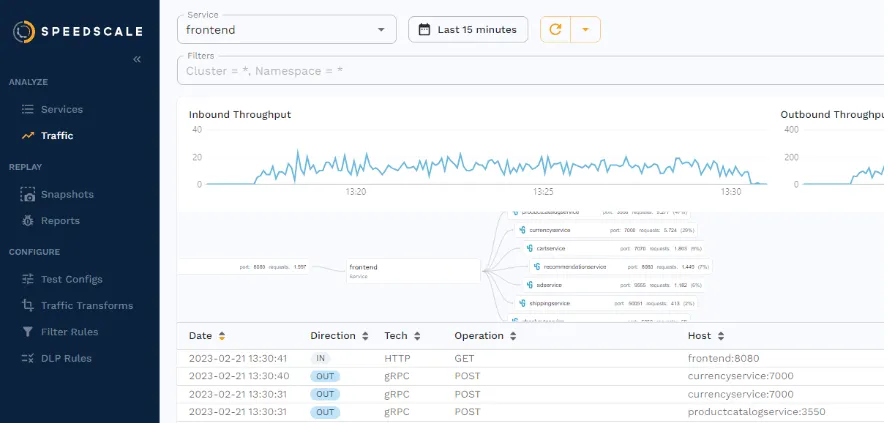
The important question now is—where is the traffic stored? To ensure proper reliability, efficiency, and performance, Speedscale stores the data on their servers rather than in your cluster. Not only does this remove the burden of having to maintain storage but it’s also what allows you to record traffic in one environment, and replay it in another, without having to establish a direct connection between different clusters.
For those of you with concerns about the security of the data, the solution is developed with a strong focus on only storing desensitized, PII-redacted traffic, in a single-tenant, SOC2 Type 2 certified architecture.
How to replay traffic with the WebUI
All the steps up until now are the ones you will have to configure anytime you need to either install Speedscale in a new cluster, or capture traffic from a new application. In other words, they only have to be performed once per cluster or application.
In this section you’ll get to see how Speedscale is used in your daily workflow, like when you need to replay traffic, which can be done in one of two ways: through the WebUI, or with the command line tool.
While most developers will likely want to use the CLI, the benefit of also having a WebUI is that even non-tech members of the organization can utilize the power of traffic replay, carrying out tests without relying on developers.
This section will showcase how replays are performed through the WebUI, with the subsequent section showcasing the CLI approach.
Creating a snapshot
In order to replay traffic, you first have to define what traffic you’re interested in—also known as a Snapshot. This Snapshot will contain all relevant information about incoming requests, outgoing requests, any transformations you may want to perform on the traffic as it’s being replayed, etc.
To create a snapshot, go back to the traffic viewer and click on “Save Tests/Mocks.” You’re more than welcome to change the time period or apply any filters, but for the sake of this tutorial you can just leave the defaults as they are.
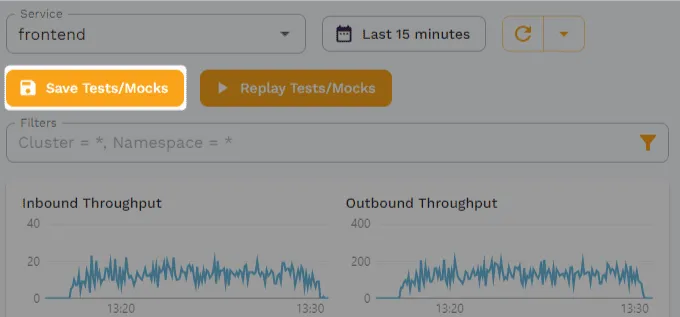
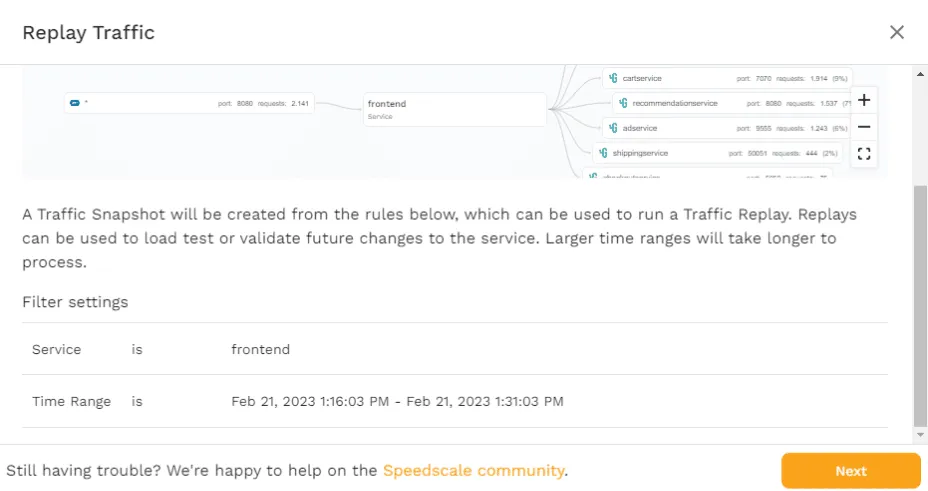
On the page that pops up after clicking “Save Tests/Mocks,” you’re first presented with an overview of what traffic you want to capture, i.e., what time period and what service, as well as any filters you may have applied.
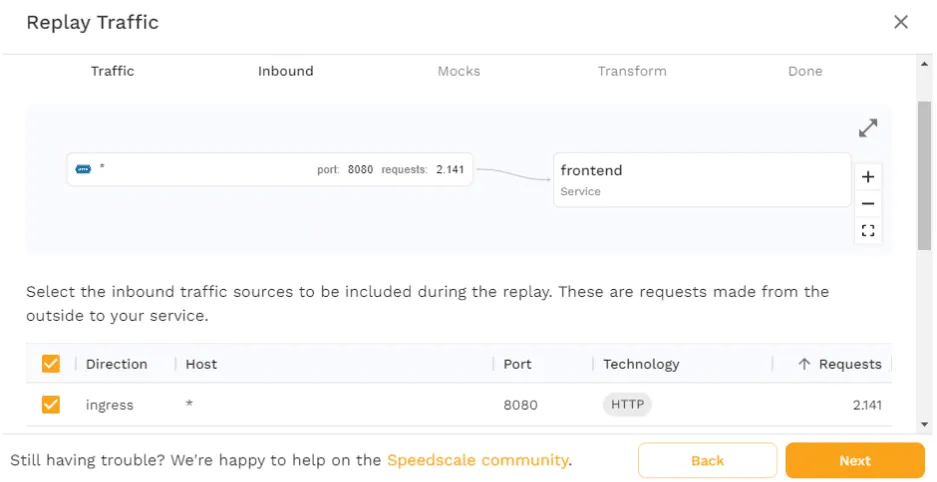
Click “Next” to move on, where you’ll be presented with an overview of the inbound traffic that’s found within the parameters shown on the previous page. Here you have the option of deselecting certain types of requests. Because the microservices demo is only generating HTTP requests towards port 8080 on the frontend service, there’s only one option. If you had other types of requests like gRPC, you would be able to choose which requests you’d want to include in the snapshot.
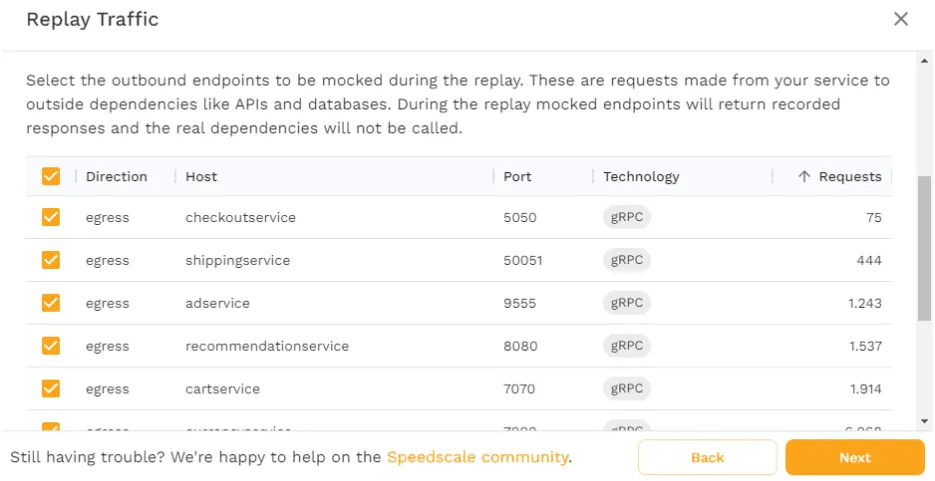
Move on by clicking “Next” and you’ll see a list of all outgoing requests. This is used when Speedscale is going to generate mocks as part of replaying traffic. The use of mocks in traffic replay will be covered further later, so we’ll leave this as is for now.
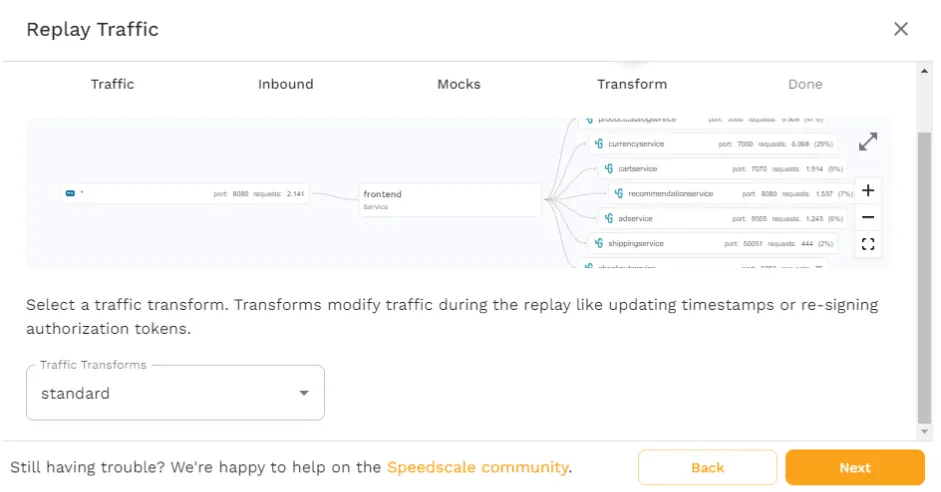
Clicking “Next” again will bring you to a page where you can choose different “traffic transforms.” Transforms can be useful for updating timestamps, or modifying auth headers, to ensure your application functions correctly. In this case you don’t need anything to be transformed, so leave the “standard” option as the chosen one.
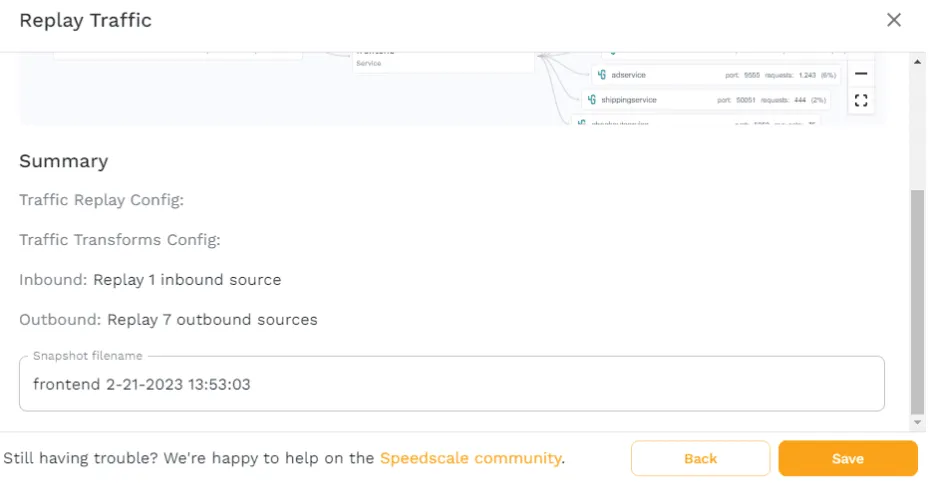
Finally, you’re provided with an overview of the settings you’ve chosen, as well as the option to change the name of the snapshot. Changing the name has no effect other than being helpful when organizing snapshots, so you can just leave the default filename and click “Save.”
Once you’ve clicked “Save,” you’ll be brought to the snapshot overview. You can always return to the snapshot by clicking on “Snapshots” in the sidebar and finding it there.
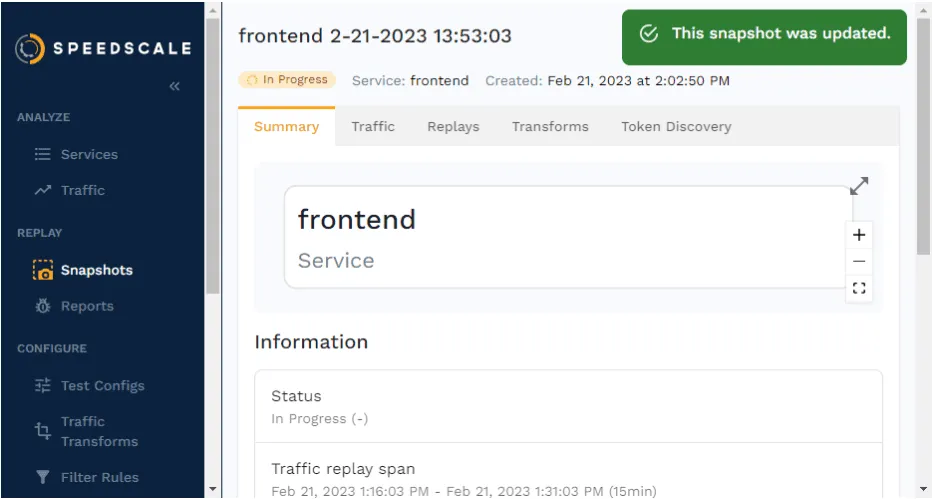
As you can see in the upper-left corner, the status is “In Progress” as Speedscale is gathering the traffic into a single snapshot file, which you can then reuse.
Once the status changes to “Complete,” you can try and replay the traffic in your cluster.
Replaying traffic
To replay the traffic from the WebUI, click on “Replay as Tests/Mocks” in the upper-right corner. This will take you through a wizard very similar to the one you’ve just seen, when creating the snapshot, with the first page just being an overview of the settings.
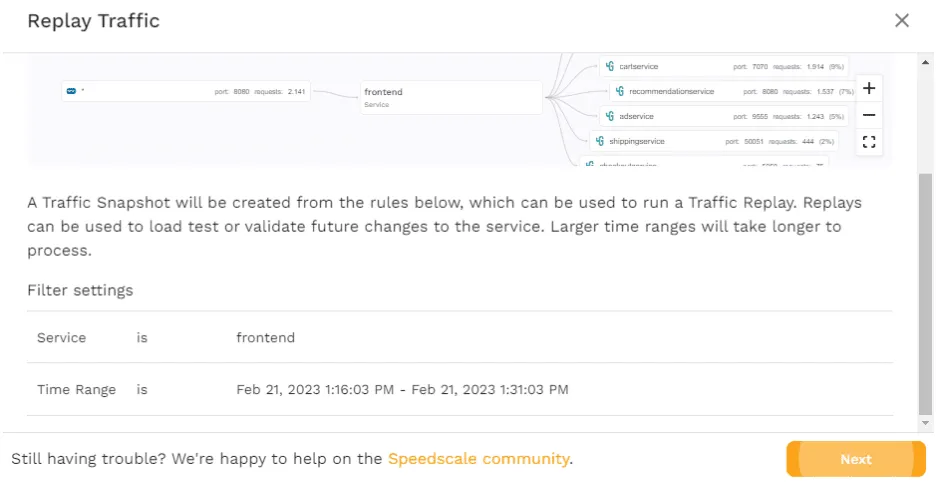
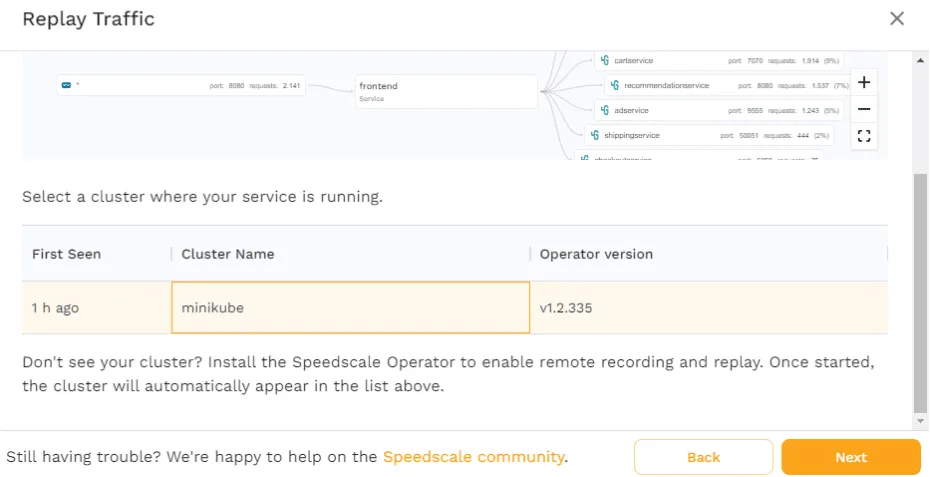
Click “Next” and you’ll see a page where you have to choose the cluster to replay the traffic in. If you’re following along with this tutorial, you’ll only see the minikube cluster. However, if you’ve configured the Operator in multiple clusters, then you’ll see them all here. This is exactly where you should see the power of having Speedscale store the traffic, rather than relying on storage inside your cluster.
Whether it’s a snapshot you’ve created some time ago, or a snapshot you’ve just created, this feature allows you to very quickly use traffic from one cluster—e.g., production—and replay it in another—e.g., staging or development.
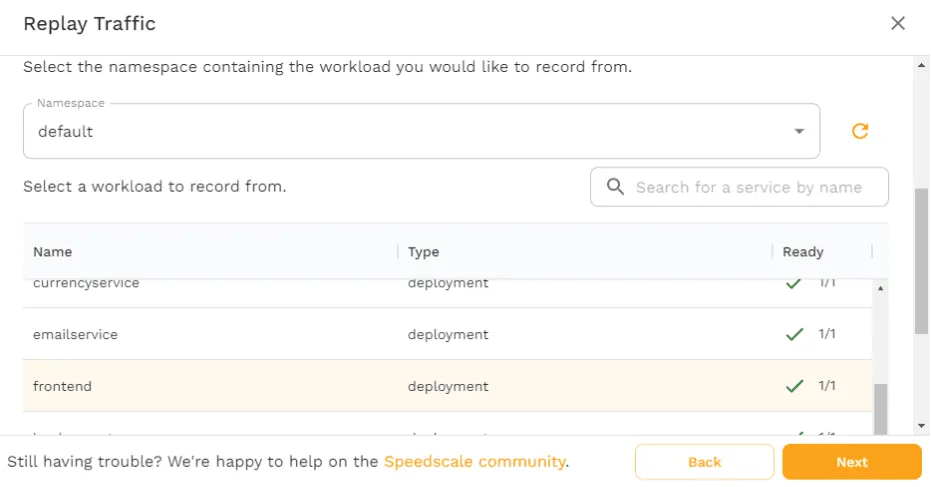
Now, choose minikube and click “Next” and you’ll then have to select what service you want the traffic to be replayed against. For the purposes of this tutorial, choose the default namespace and the frontend workload.
Note, however, how it’s possible to choose any workload you want, rather than being locked into using only the service that traffic was recorded from. This is how you can test multiple different versions of an application, or how you can test ingress resources.
Upon clicking “Next,” you’ll see a page where you can select a “traffic replay config.” The standard option is configured to replay traffic exactly how it’s defined within the snapshot. However, other options exist as well to test specific use cases, like the performance_300replicas which will replay 300 copies of the snapshot. Or the performance_chaos_100replicas which will replay 100 copies of the snapshot while also introducing chaos elements like latency and bad responses from the application’s dependencies.
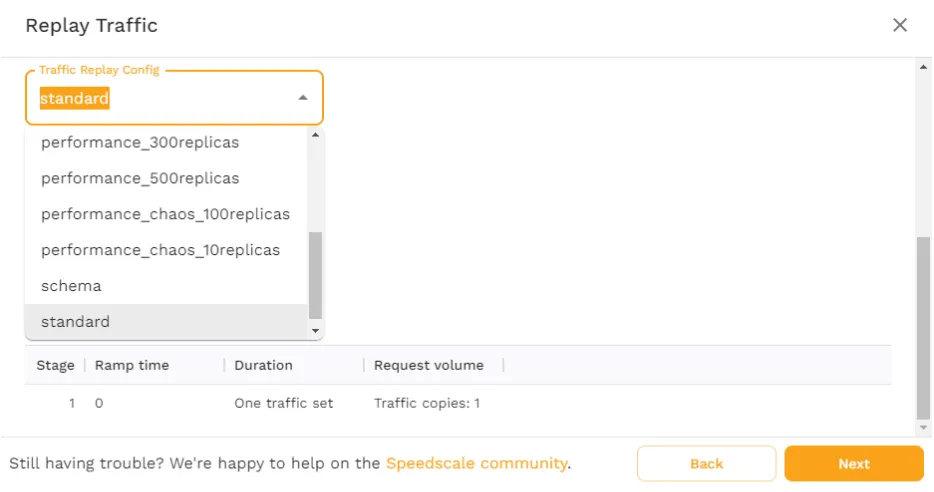
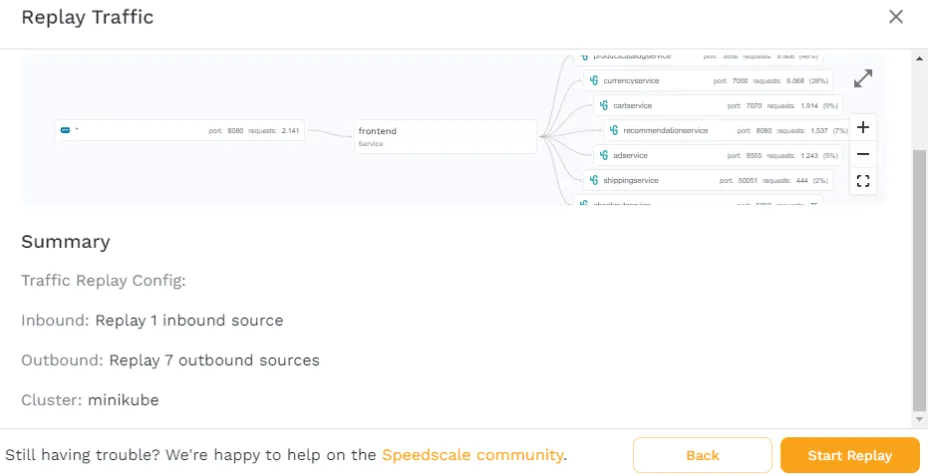
For now, choose the “standard” config and click “Next.” Here, you’ll see an overview of what the replay is going to do, and where it’s going to execute it. Click “Start Replay” to get it going.
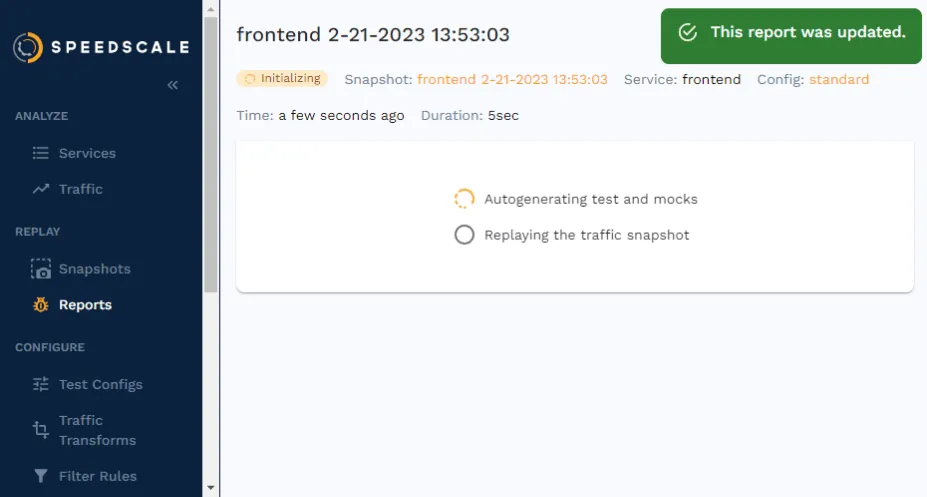
Once the replay has started, you’ll be taken to the report page. Here, you can follow along with what’s currently happening in your cluster.
Analyzing the report
Once the replay is done and Speedscale has analyzed the metrics it’s gathered, you’ll be presented with a report on how the test went.
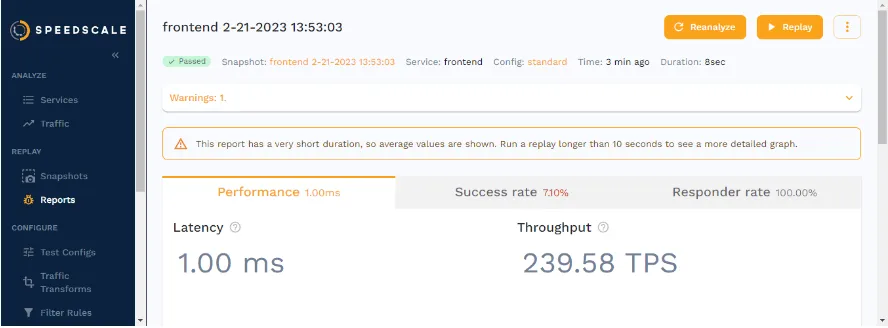
As you can see in the screenshot above, this is where you get to see valuable metrics like latency and TPS. You can then use these metrics to determine whether they live up to your performance goals.
You’ll get an overview of the success rate of the replay, which is defined by the assertions in the test config. Outside of determining how many copies of traffic to generate, and whether any chaos should be introduced, test configs also contain a number of assertions.
This feature allows you to use traffic replay as part of a variety of performance tests, like validating autoscaling rules, performing load tests, and much more. In the case of the standard config, the assertions are checking whether the responses (e.g. status code, headers, body, and cookies) from the frontend match those of the recorded traffic.
These are just a few examples of what the report can be used for, and I encourage you to click around and see what interesting insights you could use in your own application.
How to replay traffic with the CLI
Replaying traffic from a WebUI has a number of advantages, although it doesn’t lend itself to the typical developer workflow, like implementing traffic replay as part of CI/CD pipelines. For that purpose, you’ll want to look at the CLI.
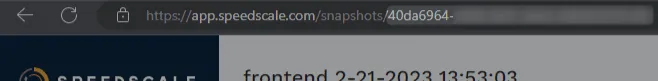
Before diving into the terminal, you first need to get the ID of the snapshot. Find the snapshot in the WebUI by clicking “Snapshots” in the sidebar and finding it in the list. Now look at the URL, where you’ll see the snapshot ID as the last part of the URL.
You should be aware that not everything can be done within the CLI. You still need the WebUI to create the snapshot first.
With the snapshot ID noted down, open up your terminal and run the following command:
$ speedctl infra replay --test-config-id standard
--cluster minikube
--snapshot-id
-n default
frontend
Make sure you replace the
To check the results, you can use this ID along with the speedctl analyze report command. The command outputs the entire report as a json object, so you can use jq to parse the result. Make sure you install jq—for example, by running brew install jq.
$ speedctl analyze report | jq '.status' "Passed"If you receive a message stating that the report is still being analyzed, give it a bit more time and then try again. Hopefully you should get an output saying “Passed” within a few minutes.
Using this approach you can easily get traffic replay implemented in your CI/CD pipelines, as you can simply check whether the output of the command is either “Passed” or “Missed Goals.” If it’s neither, check again in 5 seconds.
You may also have noticed in the speedctl infra replay command above that it contains a —test-config-id flag, which you can easily change to match whatever sort of testing you want to perform.
Supercharging traffic capture and replay with automatic mocking
Earlier in this post you encountered a screen that detailed how to configure mocks as part of creating a snapshot. This is because the Speedscale team knows how important it is to have good mock servers when performing any sort of load generation.
Oftentimes you’re only interested in testing a single application, and not all of its dependencies, in which case mock servers are the only real solution.
However, mocks often come with the downside of being hard to maintain and keep up to date. So Speedscale integrates them directly into the workflow, and takes care of automatically generating mocks.
Perhaps you didn’t realize, but when traffic was being replayed against the frontend service in the previous sections, no traffic was generated towards any of the other services.
When you chose to keep all the outgoing requests checked as part of creating the snapshot, you told Speedscale that those needed to be mocked. So every time you utilize that snapshot as part of a traffic replay, Speedscale is spinning up a mock server in a new Pod, using the sidecar proxy to intercept all outgoing requests, and forwarding them to the mock server instead. And, you can be certain that the mocks are realistic because they’re modeled directly off the responses recorded in production.
This approach has many advantages, like avoiding rate-limiting, and many more that you can read about here.
Test efficiently with traffic replay
At this point you’ve gotten to see the entire pipeline of getting traffic replay implemented in your own organization—from the initial considerations to the specific steps needed when you’re ready to actually get started.
All in all, traffic replay can provide lots of benefits like cost savings, but it’s still important to plan properly, by ensuring that you’re still optimizing your infrastructure as much as possible. Always consider whether or not you really need to capture traffic for a static landing page.
In any case, whether it’s because you’ve experienced downtime during Black Friday, or because you’re expecting growth of your current application, being able to capture, modify, and replay traffic provides you with an entirely new level of insight.
By now, you can either start exploring how traffic replay could work in your specific infrastructure, or if you’re still curious about what other use cases might be possible, check out the series on optimizing Kubernetes performance with traffic replay.