How to Mock APIS in Kubernetes Best Practices
Mock APIs in Kubernetes are used to simulate actual API requests during API testing. This is useful for detecting issues early in development, improving application performance, speeding up development, performing integration tests, and checking the behavior of new features in a controlled environment.
You may be wondering, If using mocks is so advantageous, why do some developers hesitate to use this technique?
The problem is that manually creating mocks in Kubernetes can be so overwhelming that the effort required to code them can outweigh its benefits. However, there is a way to mock a Kubernetes API server effortlessly using Speedscale as a testing tool so that you can take advantage of all the benefits of mocking APIs without the overwhelmingness that often comes with it.
What Is a Mock?
As mentioned in the introduction, a mock is a kind of simulation where you can make requests to the Kubernetes API server with the goal of getting realistic responses. These responses can be used to analyze traffic, detect failures, improve performance, and more.
There are two different kinds of mocks: code mocks and service mocks. Code mocks are generally used in unit tests for behavioral verification. According to Microsoft, you can think of them as a replacement object for the dependency that has certain expectations that are placed on it. In contrast, service mocks (as referenced in this tutorial) are used to perform performance testing and advanced troubleshooting.
The challenge with using service mocks is how complex their implementation is (unless you’re using the right tool). In this tutorial, you’ll utilize Speedscale, a tool that uses the most advanced observability technology to help you create mocks in minutes.
Top 8 API Mocking Tools and Methodologies
Setting Up Your Local Environment
Before running API tests with the testing tool Speedscale, you’ll need a Kubernetes cluster or virtual machine (VM) since Speedscale requires that the applications to be observed should run on a Kubernetes cluster or VM, either local or remote. For the purposes of this tutorial, Rancher Desktop will be used to run Kubernetes from a local workstation that uses a macOS.
Once you have your Kubernetes cluster up and running, you can begin setting up your Speedscale account.
Setting Up Speedscale
After you’ve signed up, you’ll be taken to Speedscale’s dashboard:
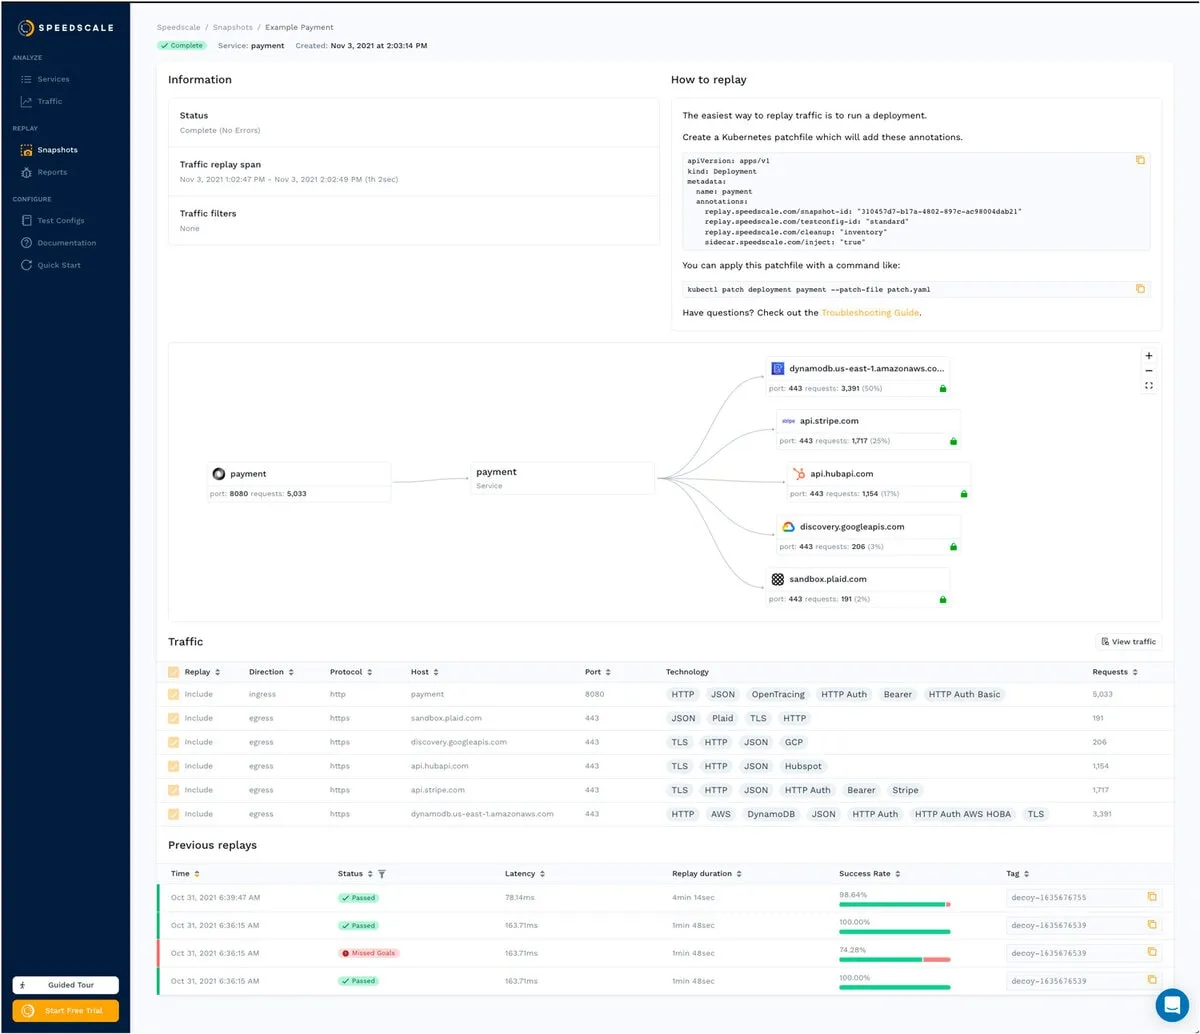
Before you explore the Speedscale UI, you need to deploy a test application. The test application will show you how easy it is to create a mock.
Deploying the Demo App
For this tutorial, you will deploy project podtato-head, a prototypical cloud-native application that is ideal for showing the power of Speedscale, as it consists of several API services that communicate with each other.
You can deploy this application to your cluster via kubectl using the following command:
kubectl apply -f https://raw.githubusercontent.com/speedscale/podtato-head/main/delivery/kubectl/manifest.yamlTo check the status of the deployment, you can list the pods in the default namespace:
kubectl get podsOnce all the pods are running, open your browser and visit http://localhost
. You should see the following: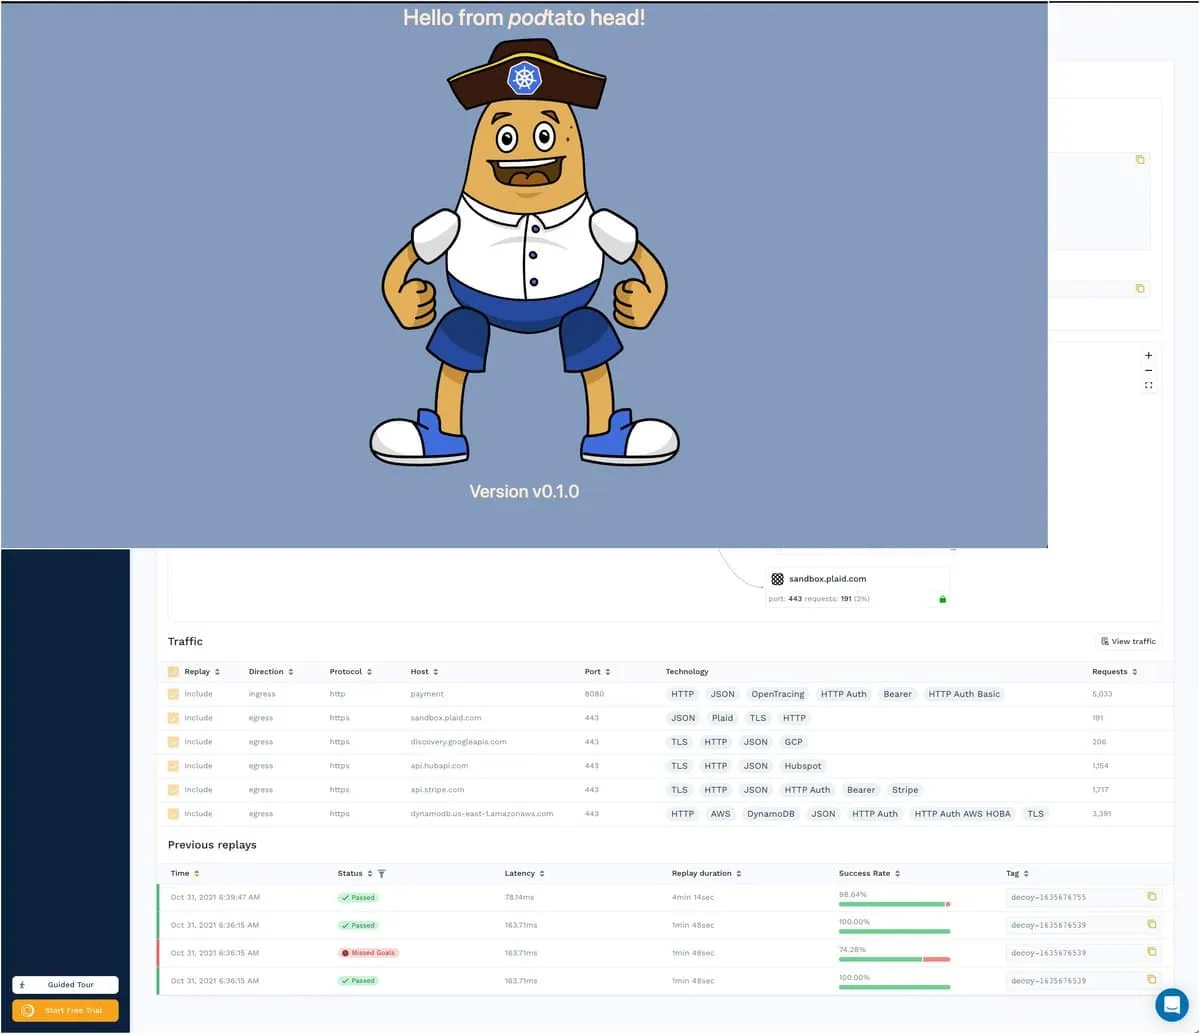
Demo App in Speedscale
The demo app is now running on your Kubernetes cluster, and it’s time to return to the Speedscale UI. From the Speedscale dashboard, select Services on the left-hand side of your screen. You’ll be taken to the Quick Start page, where you can choose how to install the speedctl CLI. In addition, the API key that you need to enter during the installation of the CLI is shown. Make a note of the API key that is shown as you will need it later in the tutorial when you install the CLI:
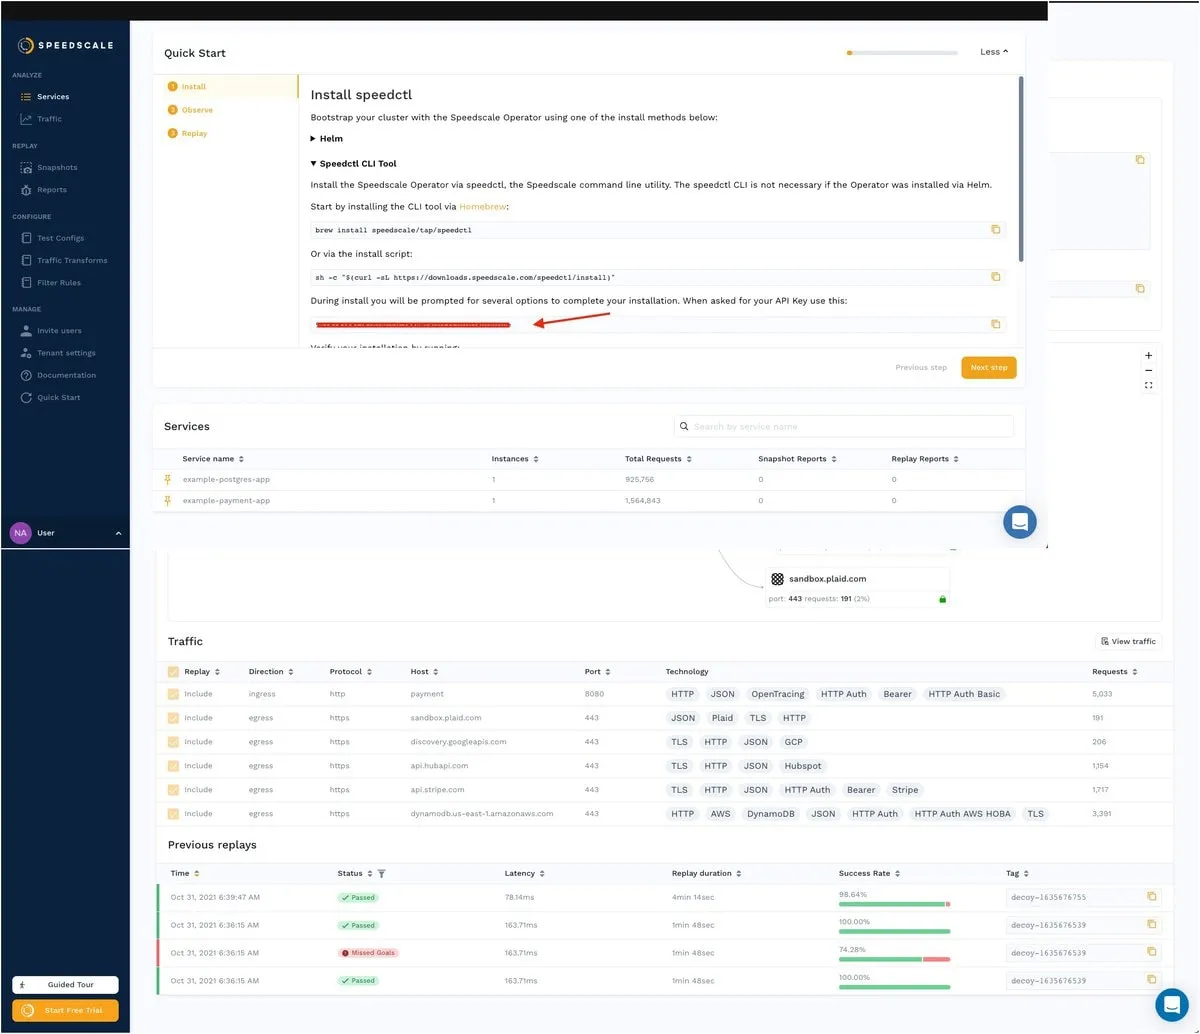 With your application still running and the API key in hand, it’s time to start enjoying the benefits of Speedscale via its speedctl tool.
Setting Up speedctl
Installing speedctl CLI is easy, and you can do it using Homebrew and the following command:
brew install speedscale /tap/speedctl
Or you can use the install script provided by Speedscale:
sh -c "$(curl -Lfs https://downloads.speedscale.com/speedctl/install)"As previously mentioned, you’ll need the API key during this process. Once the tool is installed, you need to initialize it using the following command:
speedctl initYou should see an output that looks like this:
                         _               _
 ___ _ __   ___  ___  __| |___  ___ __ _| | ___
/ __| '_ \ / _ \/ _ \/ _` / __|/ __/ _` | |/ _ \
\__ \ |_) |  __/  __/ (_| \__ \ (_| (_| | |  __/
|___/ .__/ \___|\___|\__,_|___/\___\__,_|_|\___|
    |_|

Welcome to Speedscale! Preparing your installation...
Installing with the following configuration:
Installation location: /Users/damaso/.speedscale
Add environment variables to rcfile: /Users/damaso/.zshrc
✔ Downloading Speedscale config.yaml file
ℹ Performing authentication
ℹ Downloading config.yaml
✔ Updating shell rcfile
Success! Speedscale initialization complete!
For help getting started check out https://github.com/speedscale/speedscale-cli#getting-started
Also, don't forget to join the Speedscale Slack community. We'd love to connect with you!
https://slack.speedscale.com
You can verify the installation with the following command:
speedctl checkYou should see an output on your terminal that looks like this:
speectl config
--------------
✔ context is valid
✔ tenant is valid
Speedcale API
-------------
✔ can query Speedscale API and get tenant info
✔ All checks were successful
Config Filename: /Users/YOUR_USERNAME/.speedscale/config.yaml
Current Context: my-context
Tenant Key: YOUR_NAME_HERE (YOUR_ID_HERE)
Container Image Registry: gcr.io/speedscale
Container Image Tag: :v2.3.747
Log Level: info
Speedscale Server Version: v2.3.747
Tenant Name: YOUR_NAME_HERE
Ingest (Month to Date): 0 B
Replays (Month to Date): 0
Among the many features of speedctl, one, in particular, is handy for the next step: installing the Speedscale Kubernetes Operator on your Kubernetes cluster.
Setting Up the Speedscale Kubernetes Operator
Thanks to the speedctl CLI, you can use an interactive wizard to install the Speedscale Kubernetes Operator using the following command:
speedctl installThe wizard consists of several sections. In the first, you must indicate the type of installation (environment). In this case, select **[1] for Kubernetes:
                         _               _
 ___ _ __   ___  ___  __| |___  ___ __ _| | ___
/ __| '_ \ / _ \/ _ \/ _` / __|/ __/ _` | |/ _ \
\__ \ |_) |  __/  __/ (_| \__ \ (_| (_| | |  __/
|___/ .__/ \___|\___|\__,_|___/\___\__,_|_|\___|
    |_|

This wizard will walk you through adding your service to Speedscale. When we're done, requests going into and out of your service will be sent to Speedscale.
Let's get started!
Choose one:
[1] Kubernetes
[2] Docker
[3] Traditional server / VM
[4] Other / I don't know
[q] Quit
▸ What kind of infrastructure is your service running on? [q]: 1
The output will look like this:
✔ Checking Kubernetes cluster access...OK

✔ Checking for existing installation of Speedscale Operator...OK

Now add the Speedscale sidecar to your services to capture traffic.
https://app.speedscale.com/?popupId=addNewKubernetes

Thank you for using Speedscale!

Looking for additional help? Join the Slack community.
https://slack.speedscale.com/
It’s worth pausing for a moment to comment on the message displayed by the wizard. What is being indicated is that two pods are going to be installed in your cluster. One is the Operator, and the other is the Goproxy (forwarder) that will forward the data to the Speedscale Cloud. To continue, accept the installation of these pods, and the following will be displayed on your terminal:
▸ Install the Speedscale Operator now? [Y/n]: Y
Choose one:
[1] Amazon Elastic Kubernetes Service
[2] Google Kubernetes Engine
[3] DigitalOcean
[4] MicroK8s
[5] Microsoft Azure Kubernetes Service
[6] minikube
[7] Self hosted
[8] Other / I don't know
[q] Quit
▸ Which flavor of Kubernetes are you running? [q]: 8
▸ What should this cluster be called? [rancher-desktop]:
▸ Enable Data Loss Prevention to redact sensitive information before it leaves your network? [y/N]: N
A useful feature of the wizard is the installation of the Kubernetes Speedscale Operator on most popular cloud providers and local development platforms. This is a time-saving feature, as it automates the tedious process of creating the manifest, configuring it according to the platform in use, and deploying it.
Rancher Desktop support
Because Rancher Desktop is used in this tutorial, option **[8] needs to be selected (choose the appropriate option for your case); then press ENTER to continue. Next, select ENTER to accept the default cluster name and N to skip the Data Loss Prevention step. Your output will look like this:
Creating Speedscale namespace...OK
Building Speedscale Operator resources...OK
Installing Speedscale Operator...OK
ℹ CustomResourceDefinition trafficreplays.speedscale.com
ℹ Secret speedscale-gcrcreds
ℹ Secret speedscale-apikey
ℹ Secret speedscale-certs
ℹ ConfigMap speedscale-operator
ℹ Service speedscale-operator
ℹ Secret speedscale-webhook-certs
ℹ ServiceAccount speedscale-operator
ℹ ClusterRole speedscale-operator
ℹ ClusterRoleBinding speedscale-operator
ℹ MutatingWebhookConfiguration speedscale-operator
ℹ ValidatingWebhookConfiguration speedscale-operator-replay
ℹ MutatingWebhookConfiguration speedscale-operator-replay
ℹ Deployment speedscale-operator
✔ Waiting for Operator readiness...OK
Choose one:
[1] kube-system
[2] default
[3] kube-public
[4] kube-node-lease
[5] speedscale
[q] Quit
▸ Which namespace is your service running in?
[q]: 2
Namespace Selection
The next thing you need to do is choose the namespace where the application is running. In this example, the app is running in the default namespace, so the correct option would be 2. Then you must approve the installation of Speedscale for all deployments in that namespace as well as the permissions for unwrapping inbound TLS requests:
Add Speedscale to all deployments in the default namespace? Choose no to select a specific deployment. [Y/n]: Y
ℹ With your permission, Speedscale is able to unwrap inbound TLS requests. To do this we need to know which Kubernetes secret and key holds your TLS certificate. Certificates are not stored in Speedscale Cloud nor are they exported from your cluster at any time.
▸ Would you like to unwrap inbound TLS? [y/N]:
N
The following labels will be added to the podtato-kubectl namespace:
"speedscale": "true"
The following annotations will be added to deployments:
sidecar.speedscale.com/inject: "true"
sidecar.speedscale.com/capture-mode: "proxy"
▸ Continue? [Y/n]: Y
```text
### Kubernetes Sidecars
You should then see sidecars being added to each microservice in the app:
```bash
Patching namespace...OK
✔ Patching deployments...OK
ℹ Patched default/podtato-head-hat
ℹ Patched default/podtato-head-left-arm
ℹ Patched default/podtato-head-left-leg
ℹ Patched default/podtato-head-right-leg
ℹ Patched default/podtato-head-entry
ℹ Patched default/podtato-head-right-arm
▸ Would you like to add Speedscale to another deployment? [y/N]:
Thank you for using Speedscale!
Looking for additional help? Join the Slack community!
https://slack.speedscale.com/
After completing the Speedscale Kubernetes Operator installation, you’re ready to create your first mock with Speedscale. For more information about the install wizard, you can check out the official documentation.Capturing and Analyzing Traffic
Once you install the Speedscale Kubernetes Operator, all traffic from the selected namespace is automatically captured. This could even include your production environment. You can easily check this by running several requests to the demo app using the following command:
Then click on Traffic in the Speedscale UI, and from the drop-down list corresponding to Service name, select podtato-head-entry. Your screen should look like this: 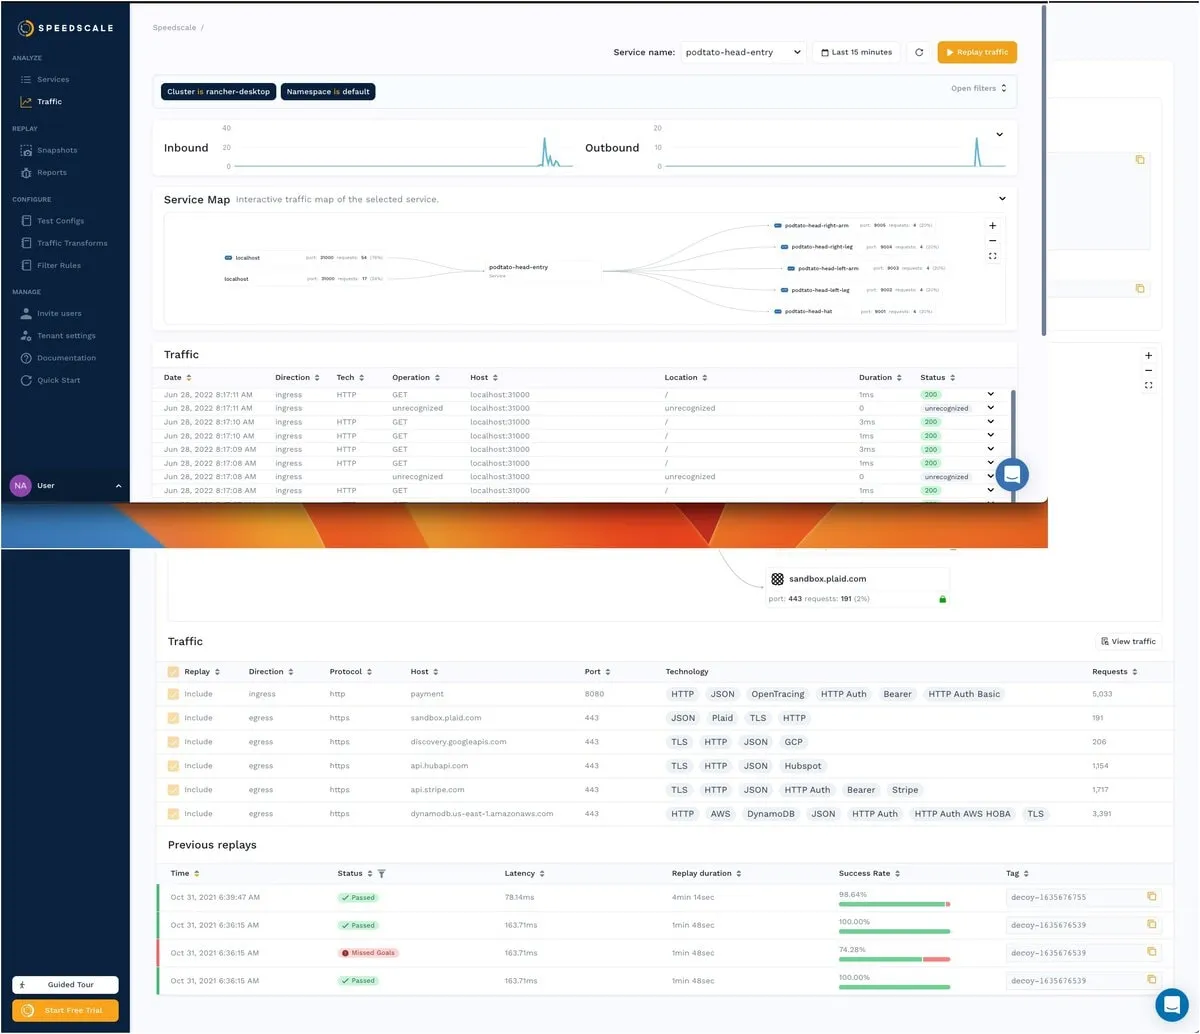
Traffic Selection
From top to bottom, the information provided by this screen is as follows:
- Service name (podtato-head-entry) and time interval
- Incoming and outgoing traffic graphs
- Service map, which is one of Speedscale’s most powerful features, as it allows developers to automatically detect and map external dependencies without entering a single line of code
- Traffic details, where you can review all the requests made to the app in greater detail
Traffic Insights
The last section, Traffic, provides developers with the most information because, from this screen, developers can filter requests, debug issues, and perform analysis to detect the root cause of problems. To that end, the Traffic Viewer is invaluable.
To illustrate this point, sort traffic by Status by clicking on the appropriate column until you get only the 200 responses:

This list displays valuable information such as traffic direction, protocol, operation, host, location, duration, and status. However, you can click on any item to get even more detailed information:

If you are interested in seeing the response, you can do so by pressing the appropriate tab:
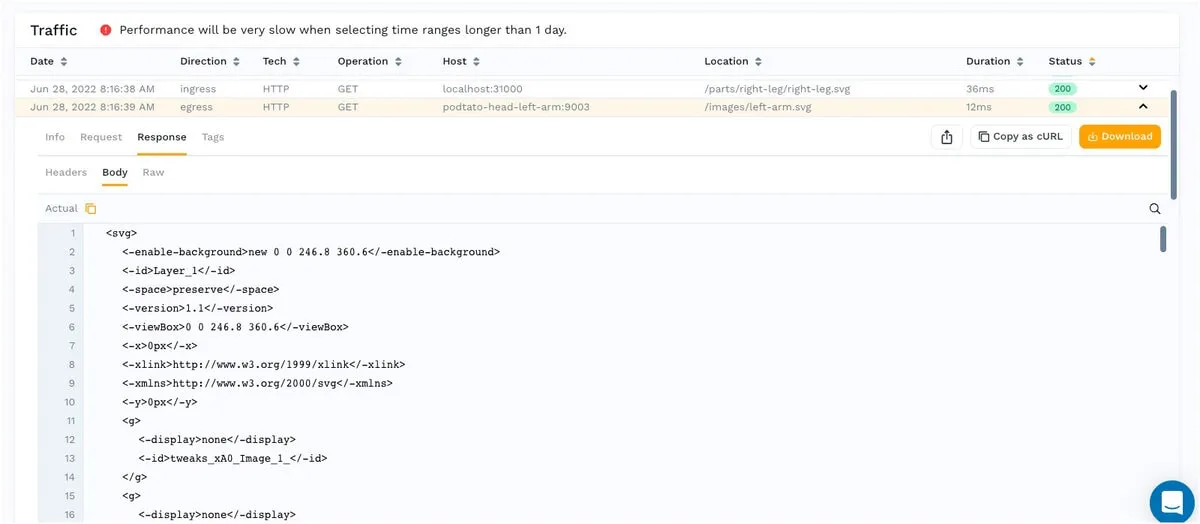
Additional Traffic Features
For added convenience, the UI features buttons to copy code, copy as cURL, or download results. In short, thanks to the Traffic Viewer, developers have a detailed log of every transaction in the namespace selected during the Kubernetes Operator Install Wizard. There is no doubt that the ability to filter and review traffic is useful; however, it’s only a fraction of what can be achieved from the Speedcale UI once the traffic has been captured.
Replaying Traffic and Reviewing Reports
Replaying the captured traffic for test execution is very simple. All you have to do is press the Replay traffic button on the top right and follow the on-screen instructions:
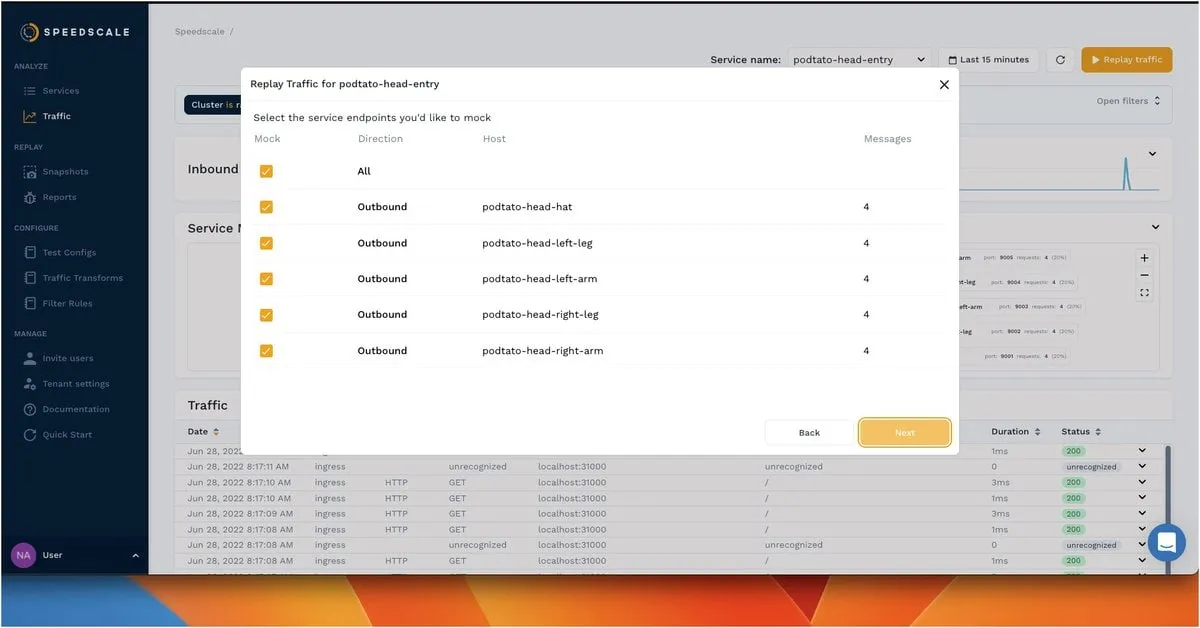
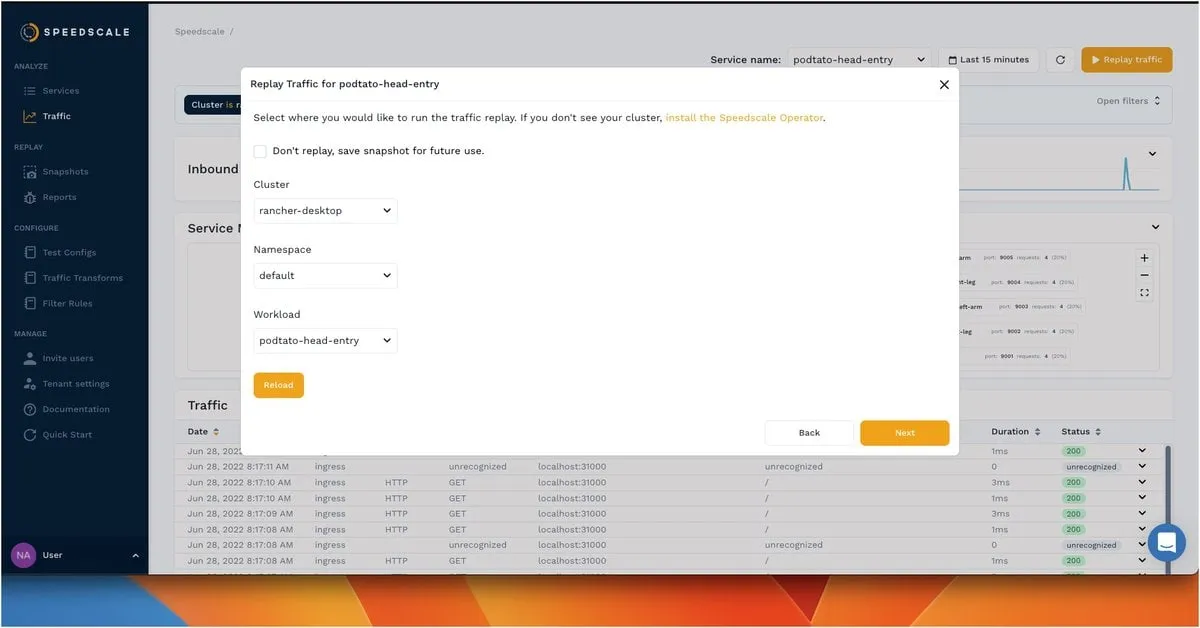
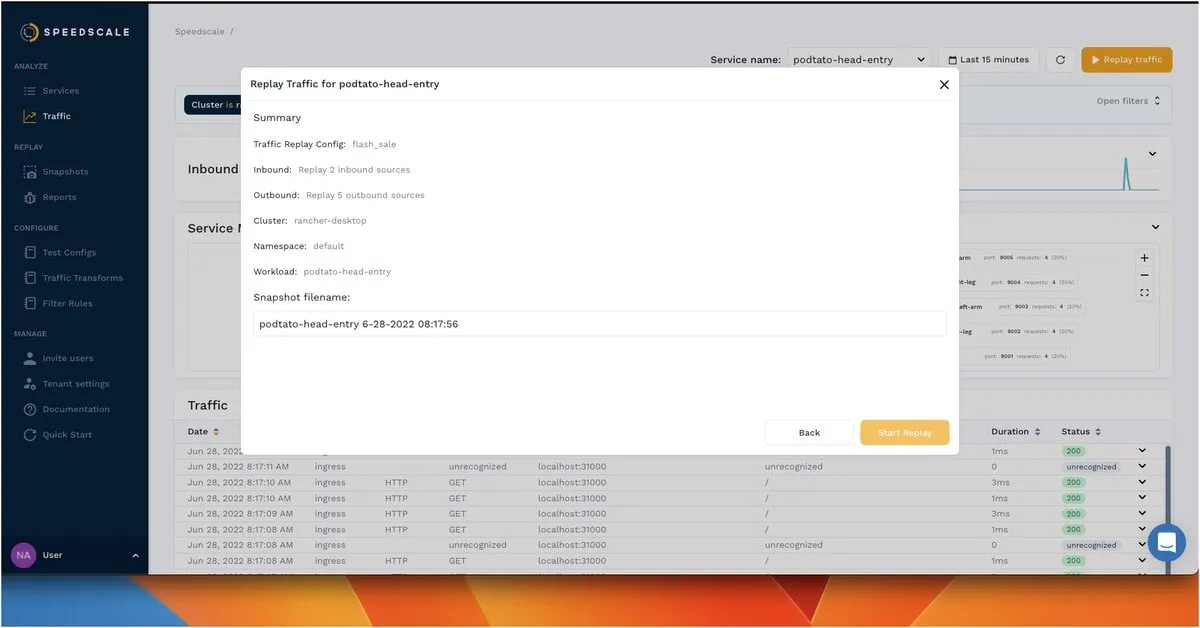
Note that on the last screen, before starting the replay, a filename is shown corresponding to the saved snapshot. You can access this snapshot at any time from the REPLAY > Snapshots menu as shown here:

If you click on the snapshot, you will be taken to a new screen where you will see general information about the captured traffic, the corresponding service map, and traffic details, similar to the Traffic Viewer. For added convenience, in the upper-right section of the page, you can copy the code of a patch file with which you can create a pod to replay the traffic.
More Reports
The example used in the tutorial is quite simple, as it only consists of a few API calls. Fortunately, the Speedscale team includes sample reports for more complex applications like the test execution below:
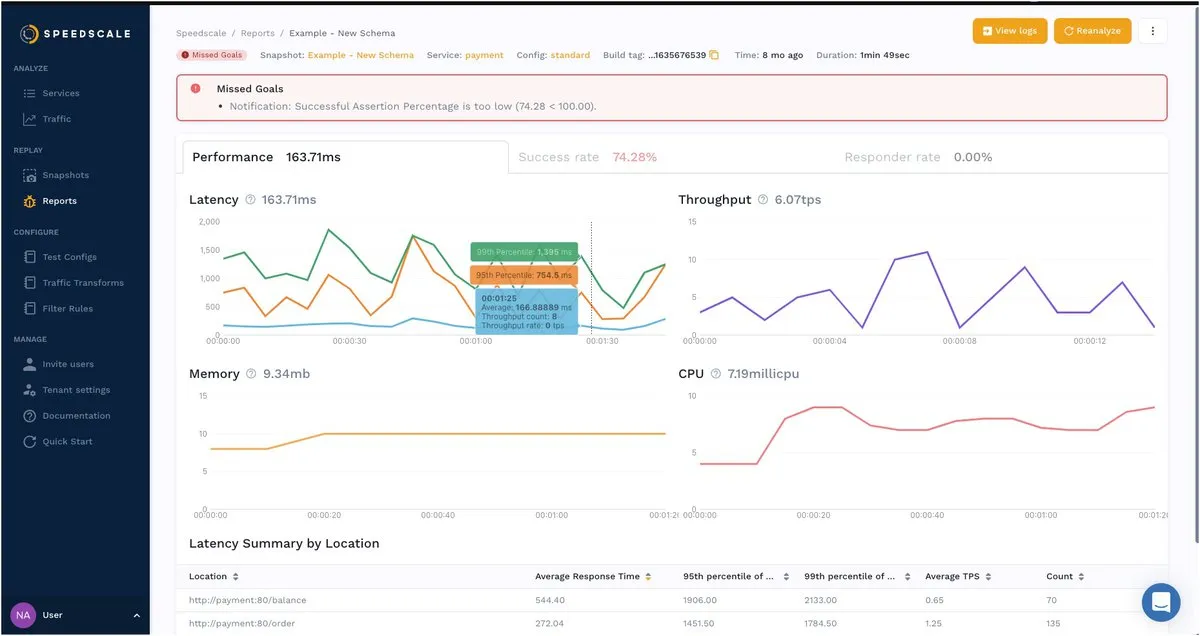
Note that this detailed application performance summary is automatically generated after the traffic replay is complete. In fact, after setting up the Speedscale Operator, you don’t need to use code to analyze the traffic. The entire process was done from the UI in a matter of minutes.
Conclusion
Throughout this tutorial, you’ve seen how using Speedscale can eliminate the complexity associated with creating service mocks in Kubernetes. You only have to set up the Speedscale’s Kubernetes Operator in your cluster or on your local machine and then focus on what matters most: analyzing traffic, troubleshooting issues, making performance adjustments, and so on.
Moreover, you can snapshot and replay the traffic under different conditions. To do this, you can go to the CONFIGURE > Test Configs section and create your own rules.
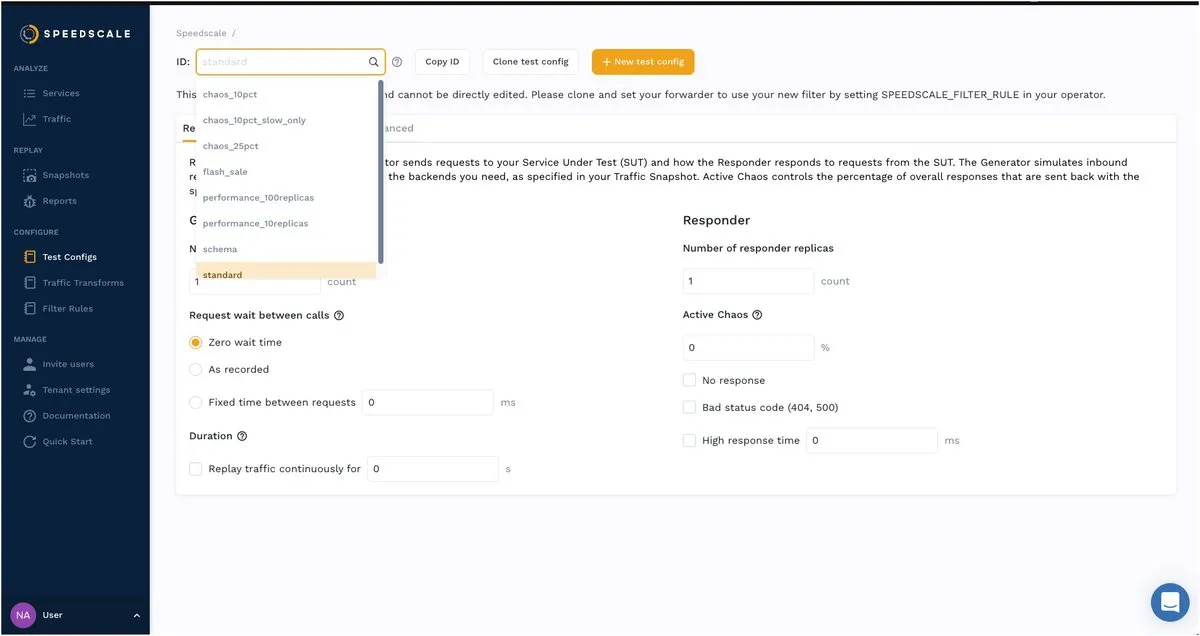
All in all, Speedscale is the API observability tool you’ve been waiting for to reduce the complexity that comes with manually creating mocks in Kubernetes. Get started today by signing up for a fourteen-day free trial.