API traffic replay testing is a method of capturing real application traffic across protocols — HTTP, gRPC, database queries, message queues, and more — from a production environment and replaying it against a staging, QA, or development environment to validate software behavior under realistic conditions. In modern systems, HTTP is critical, but it is only one part of the picture. Instead of manually scripting test cases, teams record actual traffic — including edge cases, authentication flows, payload variations, and dependency interactions that are difficult to simulate — and use that recording as their test suite. The result is higher test fidelity with less manual effort than traditional scripted approaches.
This guide covers everything you need to know about API traffic replay: how it works, when to use it, how to evaluate tools, and how to get started with zero infrastructure using proxymock.
How API traffic replay works
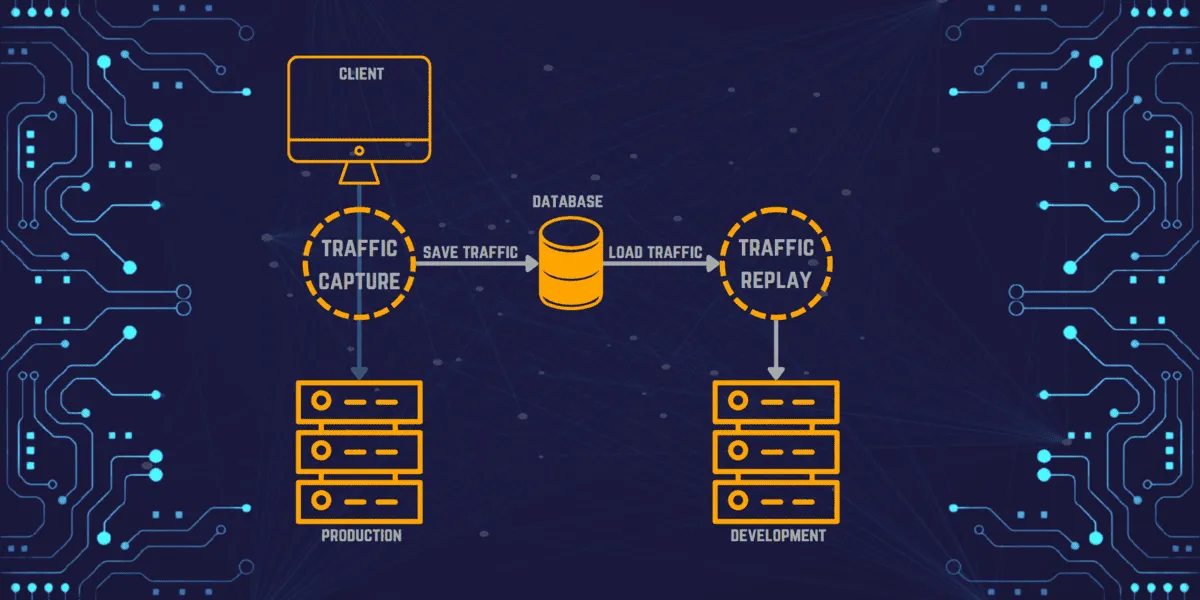
The process has three stages:
-
Capture. An agent, sidecar, or eBPF-based collector intercepts network traffic between your application and its clients or dependencies. The captured data includes HTTP requests, responses, headers, timing, and protocol metadata. Modern collectors like Speedscale’s eBPF-based nettap operate at the kernel level, requiring no code changes or sidecars.
-
Transform and sanitize. Raw production traffic almost always contains sensitive data (PII, auth tokens, session IDs) that must be sanitized before replay. Timestamps, JWTs, and correlation IDs also need to be rewritten so the receiving application accepts them. See the data sanitization section below.
-
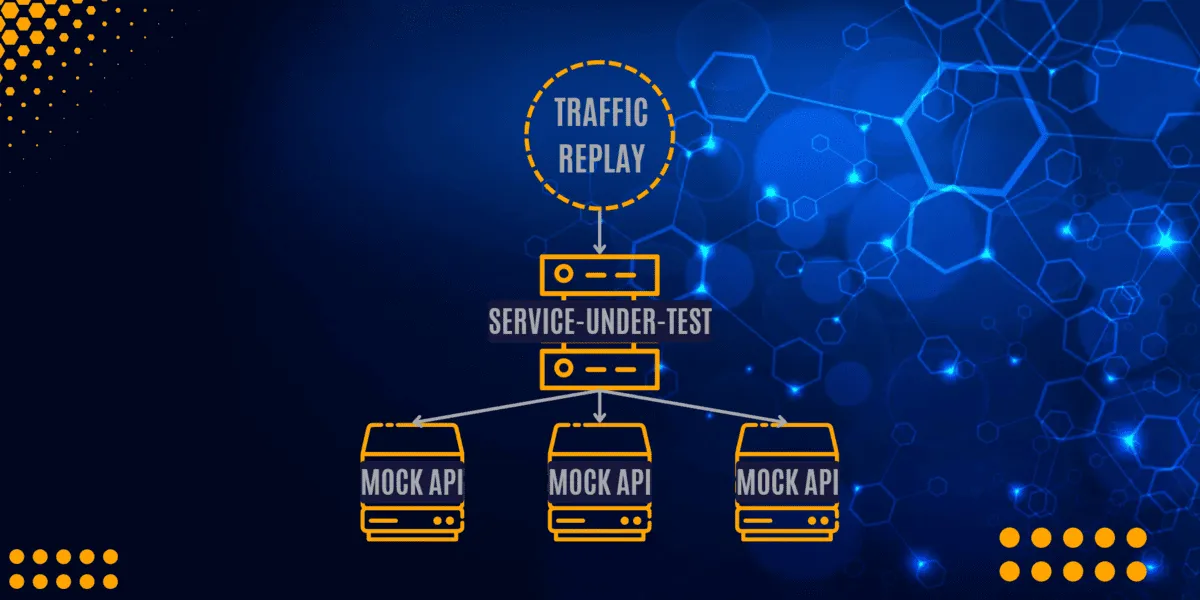
Replay. The sanitized traffic is sent to the target environment. During replay, external dependencies (databases, third-party APIs, payment gateways) are typically mocked using the captured responses, so tests run in isolation without hitting real services.
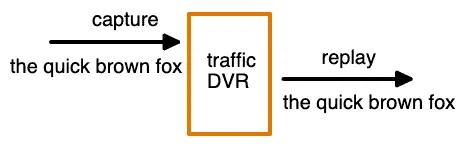
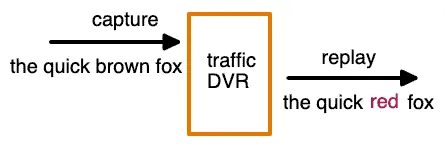
Think of it as a DVR for your API traffic: you record what happened in production, then play it back wherever you need it.
Why use traffic replay instead of scripted tests?
With the number of microservices, containers, and dependencies in modern applications, manually scripting test cases for every scenario is impractical. Traffic replay solves this by turning real production behavior into your test suite:
- Realistic coverage. Tests reflect actual user behavior, not developer assumptions about what users do.
- Less maintenance. No test scripts to write or update when APIs change. Just re-record traffic.
- Edge case discovery. Production traffic naturally includes the weird payloads, malformed headers, and race conditions that scripted tests miss.
- Varied data. Every replay uses real-world data combinations instead of the same hardcoded fixtures.
The tradeoff: you need tooling to handle data sanitization and dependency mocking, since raw production traffic can not be replayed as-is.
Core use cases
Regression testing
Record traffic for one version of a service and replay it against the next version. If the same request produces a different response, you have caught a regression before production. This is the most common use case for traffic replay in CI/CD pipelines.
Load testing
Manually scripted load tests are based on developer assumptions about traffic patterns. Load testing with multiplied real production traffic creates scenarios that match what your system actually experiences — including the request mix, timing distribution, and payload sizes that synthetic generators get wrong.
Service mocking
External dependencies (payment APIs, partner APIs, databases) are expensive to run in test environments and dangerous to hit with test traffic. Traffic replay captures both sides of the conversation: the outbound requests your app makes and the responses it receives. Those responses become automatic mocks that simulate the dependency without running it.
Contract testing
Traffic replay is a practical way to validate API contracts against real behavior instead of idealized examples. Replaying captured requests against a new version of a service helps verify that status codes, response shapes, headers, and protocol semantics still match what upstream callers expect.
Chaos testing
Chaos experiments are more useful when the traffic driving them is realistic. Replay a known-good production workload while injecting latency, dropped connections, dependency failures, or malformed responses to see how the system behaves under stress.
Migration validation
Migrating from Java 8 to Java 21, monolith to microservices, or one cloud provider to another? Replay production traffic against both the old and new systems and diff the responses. This catches behavioral differences that unit tests do not cover.
Levels of sophistication
Implementations of traffic replay vary based on how deeply they understand and manipulate the captured data.
Level 1: Exact byte-for-byte reproduction
Operates at network layer 4. Bytes are captured and the same bytes are replayed. No protocol awareness, no modification. Tools like Tcpreplay work at this level. Useful for network-level testing but limited for application-level validation.
This is the simplest form of traffic replay: useful when exact packet reproduction matters, but not enough for most higher-level testing workflows.
Level 2: Protocol-aware capture
Operates at layer 7. The tool understands HTTP, gRPC, SQL, and other protocols. It can parse URLs, headers, bodies, and query parameters. This enables inspection and filtering but does not yet modify traffic.
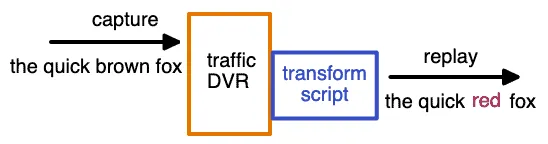
Level 3: Manual rewriting
The tool supports manual transforms: rewrite URLs, swap headers, modify payloads via scripts or configuration. This gets close to production-realistic replay but requires ongoing manual effort to keep transforms current.
Level 4: Automatic rewriting
An intelligence layer detects relationships between tokens, IDs, and timestamps automatically. A JWT and its corresponding query parameter are updated together. Timestamps that were 5 minutes old during capture are rewritten to be 5 minutes old during replay. Speedscale and proxymock operate at this level.
Level 4 is the hardest to build but delivers the most value. Production traffic breaks down quickly when session-specific details are stale, and manual rewriting does not scale across hundreds of API endpoints.
Sanitizing production data for safe replay
Before replaying production traffic in any non-production environment, you must address:
PII and sensitive data. Production traffic contains customer names, emails, payment details, and other personally identifiable information. Replaying this data in a test environment risks violating GDPR, PCI-DSS, HIPAA, and other regulations. Your replay tool should support automatic PII detection and masking that replaces sensitive values with synthetic equivalents while preserving data format and relationships.
Authentication tokens. JWTs, OAuth tokens, and API keys expire. Replaying expired tokens results in 401 errors across every request. Level 4 tools detect auth tokens automatically and rewrite them with valid credentials during replay.
Correlation IDs and timestamps. Distributed systems use correlation IDs to trace requests across services. Replaying stale IDs creates orphaned traces. Similarly, timestamps in request bodies and headers must be updated to the current time window.
Database state. Some requests depend on database state (e.g., “update order #12345”). If that order does not exist in the test database, the request fails. Solutions include mocking the database layer or seeding test data before replay.
Integrating traffic replay into CI/CD
Traffic replay delivers the most value when it runs automatically on every pull request or deployment, not as a manual exercise. The integration pattern looks like this:
- Capture once. Record a baseline traffic snapshot from production or staging. Store it as a versioned artifact alongside your code.
- Replay on every PR. Your CI pipeline deploys the branch to an ephemeral environment, starts mocks from the captured data, and replays the traffic. Assertions compare response codes, payloads, and latency against the baseline.
- Fail fast. If responses diverge beyond a threshold, the pipeline fails before merge. No manual QA gate required.
- Re-capture periodically. As your API evolves, re-record traffic to keep the baseline current. Some teams automate this on a weekly cadence.
Speedscale integrates with CI/CD pipelines natively in Kubernetes. For local development and non-K8s environments, proxymock provides the same capture-mock-replay workflow in a single binary — no cluster required.
Comparing traffic replay tools
Here is a practical comparison of five common traffic replay tools:
| Tool | Type | Capture Method | Auto-Rewrite | Mocking | CI/CD | Best For |
|---|---|---|---|---|---|---|
| GoReplay | Open source | Network listener (libpcap) | No | No | Manual | Simple HTTP replay, load testing |
| AREX | Open source | Java agent | Limited | Yes (DB, Redis) | Partial | Java apps, automated regression |
| WireMock | Open source / Cloud | Recording proxy | No | Yes (core feature) | Yes | API mocking, stub-first testing |
| Speedscale | Commercial | eBPF collector (no sidecar) | Yes (Level 4) | Yes (auto-generated) | Yes (K8s native) | Enterprise K8s, full replay + mock |
proxymock | Free | Local proxy | Yes (Level 4) | Yes (auto-generated) | Yes (any CI) | Local dev, non-K8s CI, getting started |
When to use which:
- GoReplay if you need simple HTTP replay with minimal setup and don’t need mocking or transforms.
- AREX if you’re a Java shop and want open-source regression testing with database mocking.
- WireMock if your primary need is API mocking and you want to record stubs from live traffic. See our WireMock vs MockServer vs
proxymockcomparison. - Speedscale if you run Kubernetes and need the full pipeline: eBPF capture, auto-transforms, auto-mocks, and CI/CD integration. See our GoReplay vs Speedscale comparison.
proxymockif you want to start in under 5 minutes with zero infrastructure. Record real API traffic locally, mock dependencies, and replay in CI. It uses the same Level 4 transform engine as Speedscale.
5 “must have” features in a traffic replay tool
When evaluating tools, prioritize:
- Reliability: Replay traffic consistently across runs with deterministic results.
- Security: Keep captured traffic inside your own infrastructure. No data leaves your network.
- Scalability: Multiply traffic for load testing (10x, 100x production volume).
- CI/CD integration: Run replay from pipelines without manual intervention. Tools that require a local GUI are a non-starter for automation.
- Infrastructure fit: If you run Kubernetes, choose a tool that captures and replays natively in-cluster. If you don’t, choose one that works locally.
Beyond these basics, evaluate:
Data transforms
A traffic replay tool must transform data for two reasons: testing different input combinations, and ensuring the application accepts the traffic. Even when replaying “real” traffic, session-specific data like timestamps, auth headers, and correlation IDs must be rewritten. The metadata surrounding a request (user-agent, content-type, referrer) is often more valuable than the specific payload values.
Traffic filtering
You will not always want every captured request replayed. Filter out monitoring heartbeats, health checks, and irrelevant endpoints. When debugging a specific feature, replay only the subset of traffic that exercises that code path. Filtering keeps test runs fast and focused.
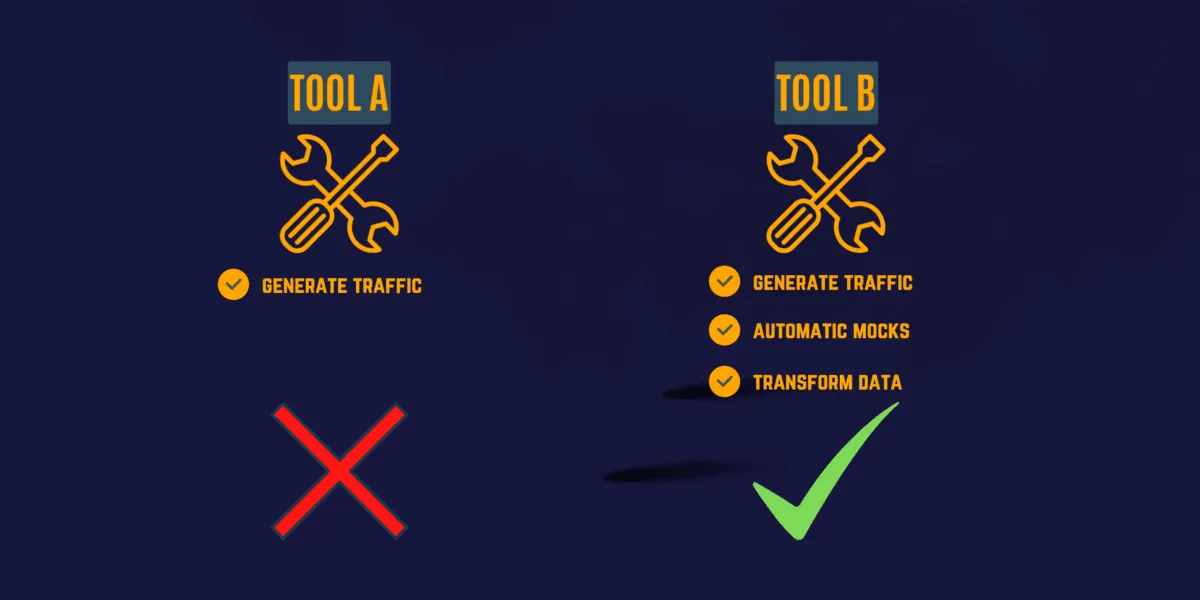
Automatic mocks
Creating mocks for every external dependency by hand is tedious and error-prone. A good replay tool uses the captured traffic to automatically generate mocks from the responses it recorded. This means your mocks are always realistic because they return exactly what the real service returned during capture.
Manageable test configurations
How a tool manages test configurations matters almost as much as how it replays traffic. Look for exportable/importable configs, shareable templates, and easy modification of existing setups.
Get started in 5 minutes with proxymock
You don’t need a Kubernetes cluster to start with traffic replay. proxymock captures and replays traffic locally:
brew install speedscale/tap/proxymock

# Record traffic while your app runs
proxymock record -- your-app-command

# Replay the captured traffic as mocks
proxymock mock -- your-app-command
This gives you realistic replay and auto-generated mocks with zero infrastructure. When you are ready to scale to Kubernetes and CI/CD, the same captured traffic works with Speedscale.
Get started with proxymock or try Speedscale for the full enterprise platform.
Frequently asked questions
What is API replay?
API replay is the process of recording real API requests and responses from a live environment and playing them back against a different environment (staging, QA, or development) to validate that the application behaves correctly. It replaces manually scripted API tests with realistic production traffic.
What is replay traffic?
Replay traffic refers to the recorded HTTP requests, responses, headers, and metadata captured from a production or staging environment that are stored and subsequently sent to a target system for testing. The traffic is typically sanitized (PII removed, tokens refreshed) before replay.
What is replay testing?
Replay testing is a software testing approach where previously captured production interactions are replayed against a system under test to verify behavior, performance, and correctness. It is used for regression testing, load testing, contract validation, chaos testing, migration validation, and service mock generation. The key advantage over scripted testing is that replay tests reflect real user behavior rather than developer assumptions.
What are the different types of API testing that use traffic replay?
Traffic replay supports multiple API testing types: regression testing (replay old traffic against new code to catch behavioral changes), load testing (multiply captured traffic to simulate peak load), contract testing (verify API responses match expected schemas), migration testing (compare responses between old and new systems), and chaos testing (replay traffic while injecting failures to validate resilience).
How does API traffic replay differ from API mocking?
API mocking simulates external service responses using hand-crafted or recorded stubs. Traffic replay is broader: it captures and replays the full request/response cycle, including inbound client traffic and outbound dependency calls. In practice, the two are complementary — replay tools like Speedscale and proxymock automatically generate mocks from captured traffic, so you get both replay and mocking from a single recording. See our guide on API simulation vs mocking vs service virtualization for a deeper comparison.