Load tests ensure applications perform well under heavy loads and traffic spikes. That’s why it’s paramount for developers and QA engineers to choose the right load testing tool. Apache JMeter – otherwise known as JMeter – is a commonly used java application because it can simulate various load testing scenarios.
However, as applications evolve, so do the tools designed to test them. This roundup compares the following five JMeter alternatives based on their modern approach, popularity, support, and compatibility with advanced orchestration tools like Kubernetes: k6, Tricentis NeoLoad, Speedscale, Gatling, and Locust. Each tool offers standout features regarding ease of use, scalability, reporting, analysis, and integration, thus making them strong contenders for performance and load testing.
k6
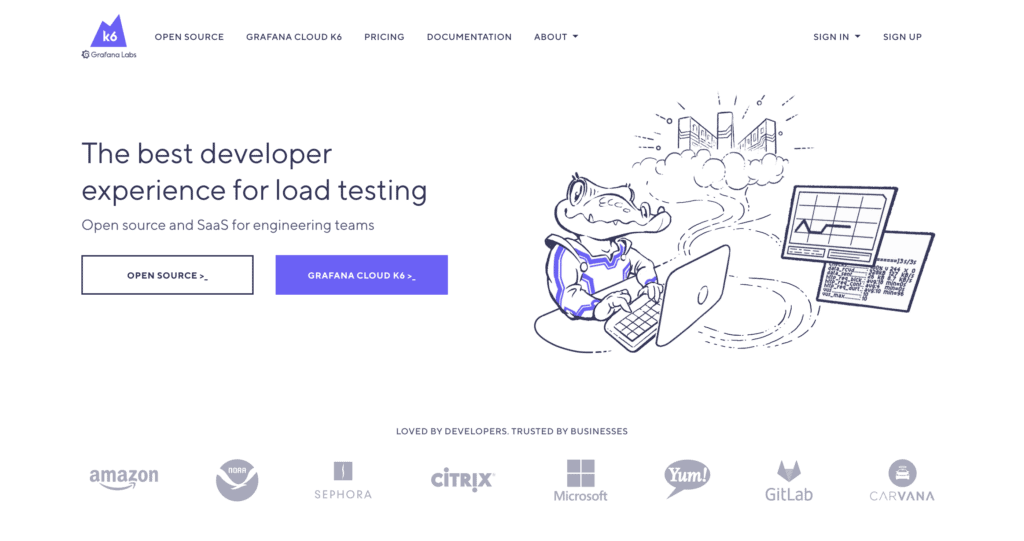
Developed by Load Impact in 2017 and acquired by Grafana Labs in 2021, k6 is an open source performance testing tool designed with developers, SREs, and QA engineers in mind. It offers a modern, scriptable approach to load testing that emphasizes ease of use and integration with CI/CD pipelines.
Ease of Use
k6 has a developer-friendly design, offering a command line interface (CLI) and JavaScript APIs that streamline the load testing process. Its test scripting in JavaScript caters to developers familiar with the language, which makes creating and managing tests more intuitive. This approach also facilitates easy integration into CI/CD pipelines, thus enhancing automation and efficiency. Moreover, besides the open source version, which can be installed locally, k6 offers a fully managed SaaS solution called Grafana Cloud k6 that’s ideal for those who prefer a graphical interface.
Scalability
Both open source and SaaS versions support various performance tests, including load, spike, stress, soak, chaos, and resilience testing. Both versions also enable browser-based functional testing and continuous validation through synthetic monitoring. However, the differences between the open source and SaaS versions are notable when it comes to how far you can scale such tests.
The open source variant’s scalability hinges on the underlying hardware, which constrains its capacity for large-scale testing. Conversely, Grafana Cloud k6 transcends these limitations, facilitating software testing from twenty-one global locations and scaling up to 1 million concurrent virtual users or 5 million requests per second. There are however, differences with how K6 scripts spins up connections compared to other load testing solutions.
Reporting and Analysis
k6 provides robust reporting and analysis capabilities, although there are notable differences between its versions. The open source version requires manual interpretation of data from the CLI, so if you require graphs for easier visualization or analytics engines for rich insights, you’ll have to implement this functionality yourself.
In contrast, Grafana Cloud k6 provides seamless visualization and analysis of k6 test results directly on Grafana dashboards because it’s fully integrated into the Grafana Cloud suite. This integration lets you correlate k6 test outcomes with server-side metrics, traces, and logs to facilitate rapid root cause analysis without the need to switch between platforms. Furthermore, Grafana Cloud k6 offers real-time visualization of test performance through its advanced Performance Insights algorithms, which automatically highlight potential performance issues in tests and applications as they occur.
Third-Party Integration and Kubernetes Support
Both open source k6 and Grafana Cloud k6 offer extensive integrations, enhancing k6’s utility within the rich Grafana ecosystem and beyond. For instance, you can seamlessly integrate k6 with popular CI/CD tools like CircleCI, GitHub Actions, and Jenkins to automate tests and use service-level objectives (SLOs) as pass/fail criteria. You can also use codeless test authoring tools (such as the k6 Test Builder) and IDE extensions for Visual Studio Code and IntelliJ IDEA to simplify the creation of test scripts.
Regarding Kubernetes, you can use xk6-disruptor for basic software testing, such as injecting errors and delays into HTTP and gRPC requests served by selected Kubernetes pods or services.
Key Takeaways
k6, particularly its Grafana Cloud variant, stands out as an easy-to-use load testing tool that offers broad integration options and remarkable scalability when compared to JMeter. However, it’s important to keep two key factors in mind. First, creating scripts in k6 demands a good grasp of JavaScript, which may pose challenges for those coming from a background in JMeter and Java. On the other hand, k6 is not specifically designed for Kubernetes load testing, which is a key consideration if you are developing cloud-native web applications.
Blog: Kubernetes Load Testing Comparison: Speedscale vs K6
Tricentis NeoLoad
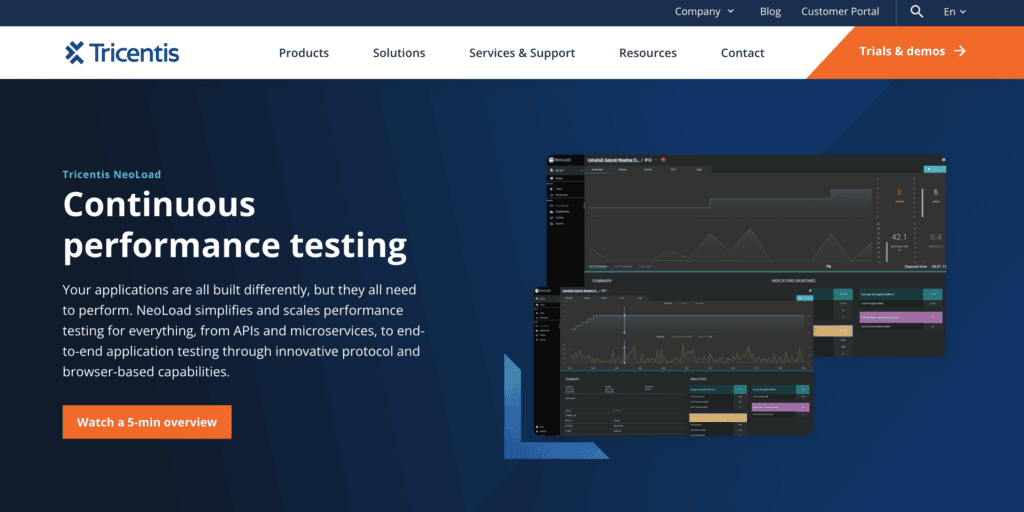
NeoLoad, developed by Neotys in 2005 and acquired by Tricentis in 2021, is a performance and load testing tool designed for enterprise environments. Aimed at DevOps teams, it offers great features for API testing, microservices, and end-to-end applications.
Ease of Use
NeoLoad offers a Python client CLI, a REST API, and a web interface, allowing you to create and manage tests either from the terminal or its graphical interface. Its codeless test scripting (on both the protocol and the browser side) simplifies test creation. Additionally, NeoLoad enables browser-based performance testing for complex custom web and cloud-native apps through RealBrowser. It’s versatile, easy to integrate into diverse testing environments, and caters to users of all skill levels.
Scalability
Thanks to its architecture – that natively interacts with container orchestrators like Kubernetes, OpenShift, Microsoft AKS, Amazon EKS, and Google GKE – NeoLoad benefits from automatic, on-demand provisioning of cloud infrastructure. Moreover, NeoLoad can also be deployed on-premise, enabling a hybrid cloud approach. Additionally, NeoLoad’s fully managed SaaS solution further enhances efficiency by allowing you to reserve load testing infrastructure, including licenses, load generators, and virtual users, by date and duration within its web interface. This guarantees dedicated resources and automatically frees them up as tests complete, thus optimizing resource utilization and reducing costs.
Reporting and Analysis
With NeoLoad, you can generate reports for test results with a single click. This creates a new dashboard that is preconfigured with several panels and widgets of your choice. Additionally, NeoLoad’s Search view enables users to apply advanced search criteria to specific tests. However, while NeoLoad offers a range of features for filtering, comparing, and measuring test results, it lacks a built-in analytics engine, requiring manual analysis or integration with a separate tool for automated insights.
Third-Party Integration and Kubernetes Support
NeoLoad integrates seamlessly with popular APM solutions like New Relic, Datadog, Dynatrace, AppDynamics, and Prometheus; NeoLoad can be integrated with a version control system using SVN and GIT. NeoLoad can also ingest test results from open source performance testing tools like JMeter and Gatling. Additionally, it integrates with both on-premise and cloud CI pipelines, ensuring smooth and efficient performance testing workflows across diverse development environments.
Concerning Kubernetes support, NeoLoad’s Dynamic Infrastructure architecture makes it fully compatible with private cloud, public cloud, and on-premise deployments.
Key Takeaways
Summing up, NeoLoad offers advantages over JMeter, including ease of use, great scalability, and broad infrastructure integrations. Yet it disappoints in analytics, requiring external third-party tools for in-depth load test evaluation. Furthermore, even with its codeless scripting interface and RealBrowser technology, the tests must be created one by one and edited in Python if any adjustments specific to your use case are necessary.
Speedscale
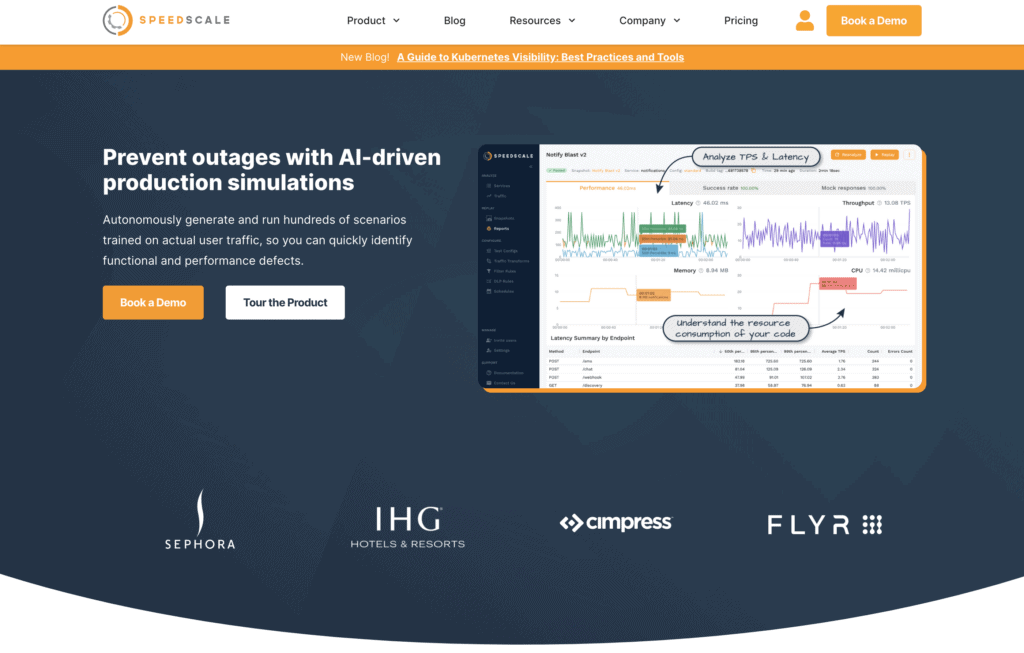
Speedscale, founded in 2020 by Ken Ahrens, Matt LeRay, and Nate Lee, is a performance and load testing platform designed from the ground up to realistically replicate the traffic of applications running on Kubernetes. It targets software engineers and enterprises alike, helping them efficiently test distributed applications by creating virtual environments that mimic real browsers and real-world conditions to validate performance and prevent issues before deployment.
Ease of Use
Speedscale streamlines load testing with its unique workflow. To begin with, its CLI enables programmatic interaction with the Speedscale API, allowing you to quickly start using Speedscale locally – with Docker, a virtual machine, or Speedscale Cloud – or in a Kubernetes cluster using the Speedscale Operator. Regardless of which deployment path you take, Speedscale’s intuitive web GUI allows you to perform operations like capturing traffic, redacting sensitive data, and replaying it alongside new builds. This is a differentiating feature of Speedscale since capturing real, sanitized traffic from your Kubernetes cluster allows you to run realistic production simulations against specific applications to ensure accurate and effective testing. Overall, by reducing manual effort and automating traffic capture and replay, Speedscale speeds up the entire testing process.
Scalability
Speedscale offers significant scalability advantages, particularly in Kubernetes environments. Broadly speaking, when you install the Speedscale Operator, it deploys the necessary components for recording both inbound and outbound traffic and replaying it within the same or a different Kubernetes cluster. Captured traffic is sent to Speedscale Cloud, where you can analyze the outcomes and tailor tests to your specific needs. This method provides unparalleled flexibility and scalability. For example, you can capture real user traffic from a production environment and replay it in a test cluster or even locally, depending on your specific requirements. In short, Speedscale’s capacity to scale is on par with your needs.
Blog: Speedscale vs. JMeter: Kubernetes Load Testing Comparison
Reporting and Analysis
Observability is a core feature of Speedscale, beginning with the creation of a traffic snapshot. This snapshot can be closely examined, analyzed, and manually filtered through the Speedscale GUI. Furthermore, after performing a traffic replay, a report is automatically generated that provides a summary of the replay outcomes. Additionally, you can dive into performance metrics, including latency, throughput, and error details. Other valuable reports include success rates and logs, which enable you to compare actual results with expected outcomes for a comprehensive analysis, thus allowing for improved quality assurance.
Third-Party Integration and Kubernetes Support
Speedscale seamlessly integrates with popular tools and platforms, including CI/CD tools, AWS, Datadog, GCP, GoReplay, k6, New Relic, Postman, Argo Rollouts, WireMock, and more. These integrations enable you to effortlessly incorporate Speedscale into your existing workflows. Furthermore, since Speedscale is purpose-built for Kubernetes environments, you can integrate it with the broader ecosystem of Kubernetes tools and technologies.
Key Takeaways
Speedscale excels in Kubernetes load testing with key features like automatic traffic capture and replay, seamless integrations, and comprehensive performance analysis via its intuitive user interface, all while scaling to fit your needs.
Gatling

Gatling, developed by Stéphane Landelle in 2012, is a script-based load testing tool aimed at developers and QA engineers. It helps simulate high-traffic loads to optimize application performance and identify bottlenecks for quality assurance purposes.
Ease of Use
Gatling offers two versions with varying degrees of user-friendliness. The standalone open source version runs from the terminal and generates static reports, making it better suited for local testing, though it can be limited by local operating systems. Gatling Enterprise, on the other hand, comes with a web graphical user interface (GUI) that serves as a centralized reporting and configuration interface, supporting both cloud and on-premise deployments on virtual machines or Kubernetes.
Scalability
Gatling is capable of running on virtually any infrastructure, be it a dedicated machine, a public/private cloud, or Kubernetes, making it highly scalable and adaptable to diverse testing environments.
That said, setting up Gatling’s runtime on Kubernetes requires more involvement compared to other tools in this roundup, as roles, services, and other Kubernetes components must be manually created.
Reporting and Analysis
Gatling automatically generates detailed statistical analyses of your load tests, answering critical questions such as user access times, sequence action durations, and performance changes under increasing traffic. Key metrics included in Gatling reports include distributions of response times, error rates, TCP connections, DNS resolutions, and active (virtual) users. This data helps you identify and investigate bottlenecks by providing actionable insights to optimize your application’s performance.
Third-Party Integration and Kubernetes Support
Gatling’s script-based nature makes it an ideal candidate if you are looking to implement a test-as-code approach. So, it’s not surprising that Gatling includes native integrations for major CI/CD tools as well as plugins for build tools such as Maven, Gradle, and sbt. Additionally, the Grafana Datasource integration lets you display Gatling Enterprise reports within Grafana. While not supported by Gatling, it’s worth mentioning that you can also find a few third-party plugins, including JDBC, Kafka, and SFTP.
Key Takeaways
All in all, Gatling excels in deployment flexibility as well as reporting and analysis capabilities. Yet, manual configuration is required to implement it in Kubernetes. Furthermore, even though both Gatling versions can capture browser-based actions and save them as scripts for load testing, editing these tests for creating custom-tailored simulations requires knowledge of Java, Kotlin, Scala, or JavaScript, depending on the language you use for scripting.
Locust
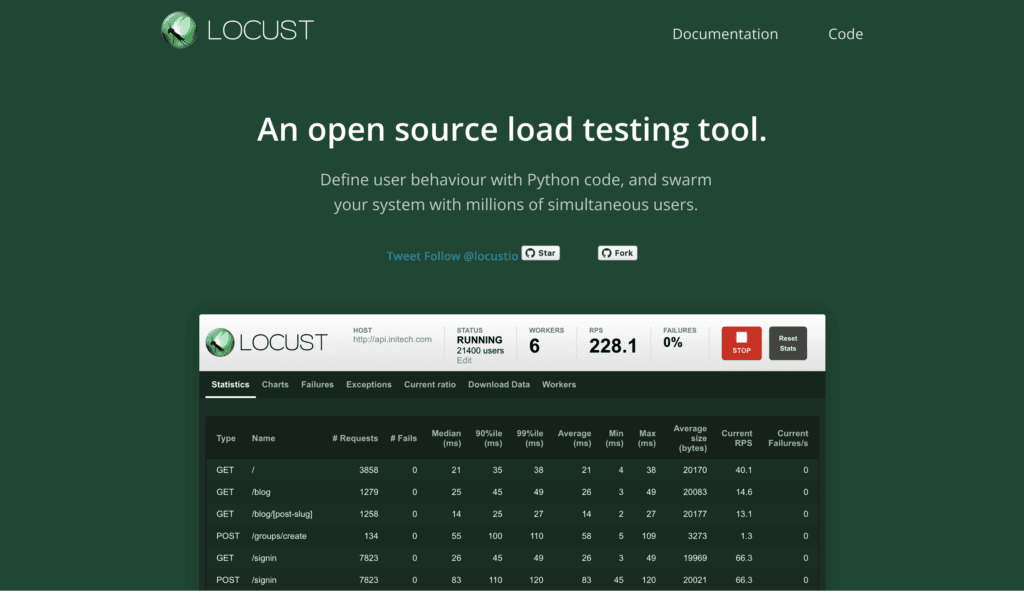
Locust is an open source load testing tool with a particular approach: you can describe tests using plain Python code. It was initially created by Jonatan Heyman, Carl Byström, Joakim Hamrén, and Hugo Heyman, and has been continuously maintained by a team of over 100 contributors since its inception in 2011. For its simplicity, Locust targets developers and testers seeking a Python-based, easy-to-use load testing tool that is able to simulate millions of concurrent users.
Ease of Use
Locust offers a developer-centric load testing solution that emphasizes simplicity and a programmable workflow directly from IDEs. Installation is straightforward, with a simple `pip3 install locust` command. Developers can easily create and manage tests, configure settings, or scale load generation—all from the command line.
Moreover, Locust also comes with a minimalist GUI that allows for essential operations, graphs, and progress viewing; however, using it is optional since it supports a headless mode for those who prefer terminal-based progress monitoring. Overall, Locust is designed for simplicity and appeals to developers who favor a coding-first approach.
Scalability
A single Locust process can handle over a thousand requests per second for simple test plans and small payloads. For complex plans or higher loads, you may need to scale out to multiple processes or machines. However, while Locust supports distributed runs out of the box, Python’s single-core limitation means you must run one Locust process per processor core/thread, which limits scalability, not to mention the manual setup involved in such a process. All of the above makes Locust a more appropriate tool for local testing than for large-scale load testing scenarios.
Reporting and Analysis
While Locust lacks a dedicated reporting and analysis engine, you can save test statistics in CSV format, which is compatible with tools like Grafana for visualization and analysis. That said, test progress and results can be viewed from both the GUI and the terminal. Metrics include total requests per second, failures, median, average, min/max response times, concurrent users, and more.
Third-Party Integration and Kubernetes Support
Locust’s programmatic approach favors a do-it-yourself (DIY) route rather than providing an extensive ecosystem of ready-to-use integrations. This is why Locust only has built-in support for HTTP/HTTPS protocols. To test other protocols like XML-RPC, gRPC, and REST APIs, you must manually wrap protocol libraries. Fortunately, Locust’s official GitHub lists community-made third-party extensions, which offer functions such as JMeter-like outputs, logging test data to Azure Application Insights, and communicating with Kafka or WebSockets/SocketIO. While less convenient than tools with broader built-in integrations, these plugins extend Locust’s capabilities significantly.
Speaking of extending Locust capabilities, Kubernetes support is one of those features that fall into the DIY category. You can deploy multiple nodes for load testing using Locust’s distributed mode, but just keep in mind that it is an entirely manual process that involves deep Kubernetes knowledge.
Key Takeaways
Locust prioritizes a code-centric and DIY approach to load testing, making it ideal for Python-savvy developers who prefer a minimalist tool that does not rely on Java like JMeter. That said, although it supports distributed runs, its scalability is somewhat limited, making it more appropriate for local testing.
Sticking with JMeter? Exploring Your Options
This roundup introduced five load testing tools that provide you with notable improvements in terms of ease of use, scalability, integrations, reporting, and analysis when compared to JMeter. However, if you’re uncertain and want to stick with JMeter, what are your options? Here’s where BlazeMeter can help.
BlazeMeter defines itself as “a continuous testing platform.” The relevant point is that BlazeMeter’s engine (Taurus) supports different load testing tools, so you can use it as an augmentation layer for JMeter, Gatling, or k6, for example. What this means is that you can continue working on JMeter and use BlazeMeter to get benefits like:
- Cloud-based load testing to enable scalability and the ability to simulate thousands or millions of concurrent users across 50+ global locations.
- Parallel test runs to expedite test cycles.
- Synthetic data generation for realistic test scenarios.
- Real-time, visualized reports on throughput, error rates, latency, and other key performance indicators.
- Facilitation of immediate analysis and trend tracking to allow easy sharing of reports with team members, leadership, and stakeholders.
Of course, nothing stops you from creating performance tests directly in BlazeMeter or using BlazeMeter’s Auto Correlation Recorder plugin to suggest fixes for errors detected during tests. Simply put, it’s your decision to use plugins to extend JMeter’s functionality, work directly from the BlazeMeter GUI, or a combination of both.
Final Thoughts
Ultimately, the decision to continue using JMeter with an augmentation layer or switch to a completely different tool will depend on key factors such as the complexity of your project, the ability to scale your load testing infrastructure, and the ease of creating reliable tests.
As organizations implement Kubernetes-based solutions, they may find Speedscale to be an interesting alternative, given its ease of setup, cloud-native approach, scalability, and ability to streamline load testing by collecting real traffic from your applications and services.