K6 is an open source performance testing tool that lets developers and QA engineers simulate load on a system to identify performance bottlenecks before they reach production. On the one hand, k6 is known for its developer-friendly setup and scripting in JavaScript. It can simplify load testing scenarios and be integrated with CI/CD pipelines. These features make this tool a popular choice among QA engineers and developers.
On the other hand, despite its strengths, there are several reasons why professionals might seek a k6 alternative. Some teams might need a software testing tool that has a more intuitive user interface, better support for different programming languages, or more comprehensive analysis features. Other teams might focus on more cost-effective solutions or need a tool that offers better support or documentation.
Check out our K6 Tutorial
If you’re looking for a K6 alternative, this roundup examines the following five load testing tools, chosen for their unique features, intuitive UI/UX, compatibility across different platforms and operating systems, pricing options, documentation, and communities:
- Gatling
- wrk
- Apache JMeter
- Locust
- Speedscale
Gatling

As an open source load testing tool, Gatling is an alternative to k6 that offers many useful features tailored to different functional testing needs. For example, its asynchronous architecture allows for non-blocking operations and the running of thousands of concurrent virtual users. This is particularly useful for simulating high-traffic environments and understanding how systems behave under stress. Gatling’s domain-specific language (DSL) is built to improve user experience by being readable and easy to write, and it enables testers to define complex scenarios that mimic real user interaction. Gatling also offers helpful reporting and analytics features. For example, it can generate detailed reports that provide insights into performance metrics such as response times, request rates, and error percentages.
UX/UI
Gatling’s UI is primarily command-line-based, which may seem unintuitive for some users at first. However, it’s complemented by a graphical user interface in [Gatling Enterprise](https://gatling.io/products#:~:text=Web%20interface%20and%20Orchestrator), which makes it more accessible for both developers and testers.
Platforms
In terms of availability, Gatling is compatible across different platforms and operating systems. It supports 64-bit versions of OpenJDK 11, 17, and 21, and can be run on major operating systems like Windows, macOS, and Linux.
Price
When it comes to pricing, Gatling offers different models that cater to small startups as well as large enterprises. Smaller teams with a limited budget can fall back on the Basic and Team versions. On the other hand, the more expensive Gatling Enterprise plan can be tailored to specific needs. For example, the user limit can be scaled to accommodate larger teams, and the number of minutes available for load generators can be adjusted flexibly based on current needs.
Documentation
Gatling offers comprehensive and well-structured documentation that provides its users with all the necessary resources they need to get started. The official documentation covers everything from installation to advanced scripting. Additionally, users can learn more about the tool, like how to create effective load tests, at the Gatling Academy.
Community
Lastly, Gatling has a global, active community of users and contributors, with community forums full of users and developers ready to assist with technical challenges and share their expertise.
wrk
wrk is an HTTP benchmarking tool that can be used to measure the performance of web services. Its set of key features includes the ability to handle thousands of concurrent connections with a single thread, which is great for simulating high-traffic environments and assessing how web applications behave under stress. Additionally, wrk offers a scripting interface that allows users to write custom test scripts in Lua. Furthermore, wrk’s efficiency in terms of resource usage makes it easy for testers to integrate the tool into CI/CD systems, allowing them to perform automated testing during the development cycle. In terms of reporting, wrk provides detailed performance metrics such as data throughput, request latency, and statistics on response time distribution.
UX/UX
As for the UI/UX, wrk operates through a CLI. This means it does not have a graphical user interface like another load testing platform; users interact with wrk by typing commands into a terminal. However, its straightforward syntax makes it very easy to use.
Platforms
wrk is available across different platforms and operating systems. The tool is built to be platform-independent, which should ensure operations across major operating systems such as Windows, macOS, and Linux.
Price
When it comes to pricing, wrk can be used for free without any licensing costs, which makes it an attractive option for organizations that might not have a big testing budget.
Documentation
Unfortunately, wrk’s documentation and support are not well developed. There is no central online documentation on how to use the tool. The only documentation for the tool consists of the official GitHub repository and blog articles spread across several websites. Even when it comes to support, GitHub is the only way to get help if you have any problems.
Community
Finally, compared to some other options, wrk has a smaller community on GitHub that contributes to the continuous improvement of the tool. Users can also make contributions to the project and suggest new functions on GitHub.
Apache JMeter

Apache JMeter is a piece of open source software for performance testing and measuring applications’ functional behavior. The tool is particularly well suited for testing web applications, as it supports many different protocols such as HTTP, HTTPS, SOAP, and FTP, among others. It can also simulate multiple users with concurrent threads, which can generate significant stress on a web application that you’re testing. JMeter also provides different listeners that allow users to visualize test results in different formats, such as tables, graphs, trees, or logs.
UX/UI
JMeter’s user interface is primarily graphical. Through the GUI, a user can create, execute, and analyze load tests. However, for those who prefer or require a command line interface, JMeter also offers a CLI mode, which might be handy for integrating into continuous integration pipelines.
Platforms
JMeter is written in Java. This ensures that the tool is compatible with many different operating systems, including Linux, macOS, and Windows.
Price
In terms of costs, JMeter is free to use without any licensing costs. Hence, this load testing solution might be a good option for individuals and companies that are looking to perform load testing without incurring additional costs.
Documentation
JMeter provides a detailed user manual that covers all the important components and features of the tool. The online documentation includes guides on getting started, component references, best practices, and much more. Additionally, JMeter provides comprehensive tutorials on various topics, such as distributed testing or recording tests.
Community
JMeter’s community is accessible through a dedicated user mailing list, which allows users to ask questions, report bugs, or share knowledge. Moreover, the JMeter community is also present on GitHub, where users can report bugs, request enhancements, and contribute to the codebase.
Locust

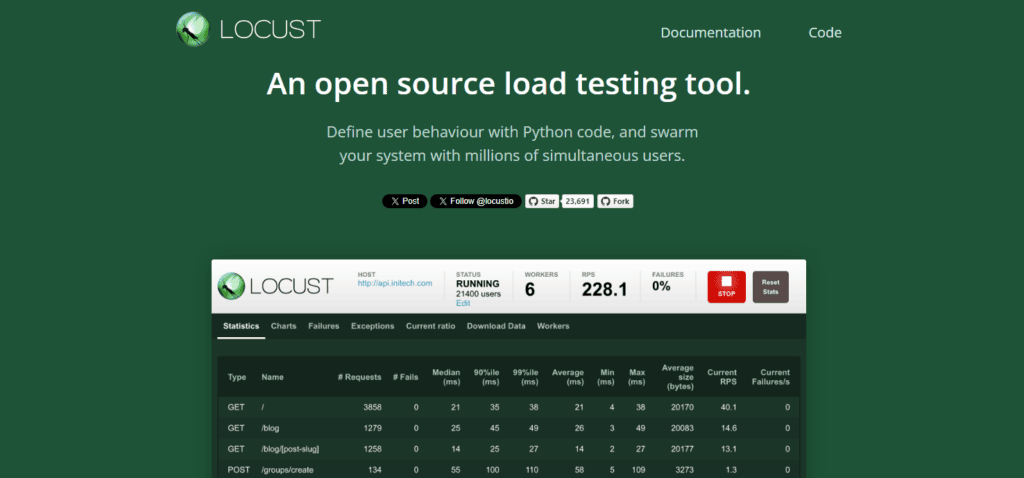
Locust is another open source alternative to k6. This load testing tool allows testers to define user behavior in Python code. This eliminates the need for complicated interfaces or extensive XML configurations and provides a straightforward way to define user behavior. You can also use Locust to run performance tests distributed across multiple machines. Due to this scalability function, it’s possible to simulate real-world test cases with many concurrent users. Locust achieves this through an event-based system that can handle thousands of simultaneous users with minimal overhead. This makes it ideal for software testing highly concurrent workloads.
UX/UI
The user interface is mainly command-line-based. However, it also offers a web-based UI that is modern and user-friendly. It provides insights into the progress of the running test and also allows you to adjust the test settings during the test run. The CLI, on the other hand, offers users a set of options for configuring and running performance tests. These options include setting the number of users, test duration, and target host, among others. This level of customization, as well as the ability to write tests in Python, makes Locust very adjustable to different automated testing requirements.
Platform
As Locust is written in Python, it is compatible with a number of different platforms. It can run on any system that supports Python, including Windows, macOS, and Linux.
Price
As an open source tool, Locust is entirely free to use, which makes it an attractive option for teams and organizations looking to implement load testing without incurring any additional costs.
Documentation
Locust has detailed and well-maintained online documentation. It provides user guides on getting started, writing tests, and configuring the tool. It also includes advanced topics such as distributed testing and integrating with other systems.
Community
Locust has an active community that is primarily centered around the GitHub platform, where developers and users contribute to the codebase, report issues, and suggest improvements. Locust’s GitHub is also a place for discussion and collaboration, where users can engage through issues and pull requests.
Speedscale

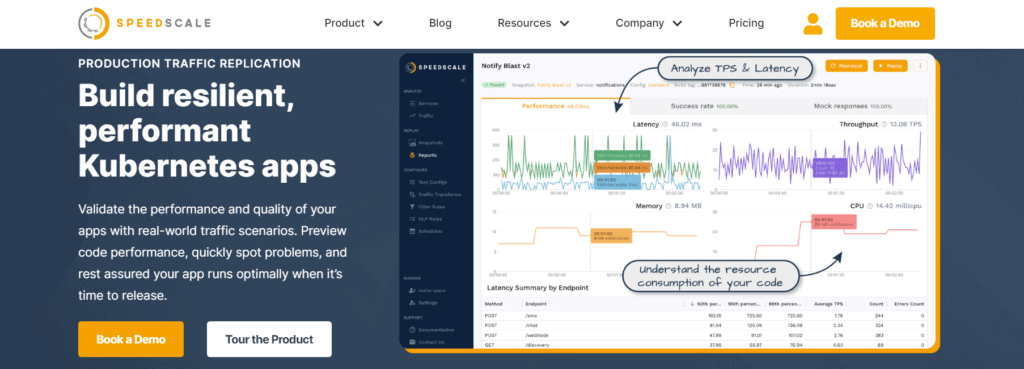
Last but not least, Speedscale is an alternative to k6 that allows Kubernetes development teams to validate the end performance of their applications under production-like conditions. Speedscale offers a suite of features to test Kubernetes applications by simulating real-world traffic patterns and conditions. Its traffic replay feature simulates real-world traffic patterns and conditions. Traffic snapshots can capture live traffic data for more detailed root cause analysis and replay to perform troubleshooting and performance tuning. Speedscale is also well suited for API testing and benchmarking and can help teams measure the performance of their APIs in response to different conditions and loads. This benchmarking provides insights into APIs’ responsiveness and throughput.
UX/UI
The tool’s UI is accessible through a web-based dashboard that provides a visual representation of traffic, tests, and analytics. In this dashboard, users can navigate through different sections such as traffic analysis, test results, and configuration. For command line users, Speedscale provides a CLI called speedctl.
Platforms
Speedscale is primarily built for Kubernetes environments. This ensures that the tool can be integrated with modern container orchestration platforms. It supports applications hosted on local desktops as well as high-scale enterprise Kubernetes clusters.
Price
When it comes to pricing, Speedscale offers flexible plans that adjust to the needs and size of the organization, including options like a startup plan for smaller organizations and budgets and enterprise plans with additional features like PII data redaction and single tenant data isolation.
Documentation
Speedscale’s documentation offers comprehensive guides for initial setup, usage, and advanced features. For additional support, users can reach out via email or join the Slack community to get the Speedscale team to answer their questions directly.
Community
The community around Speedscale is primarily hosted on Slack. This community space provides real time product updates, facilitates discussions among DevOps practitioners and engineering team leads, and offers direct support for any Speedscale-related queries from the team. In addition to Slack, Speedscale also maintains a presence on GitHub, where users can access demos and other resources that can help them better understand and utilize the tool.
Read more about API testing and Kubernetes
Conclusion
This article explored five alternative load testing tools to k6. These alternatives include Gatling, wrk, Apache JMeter, Locust, and Speedscale. Each tool has unique features that cater to different testing needs. From Gatling’s asynchronous architecture and DSL to wrk’s lightweight nature and Lua scripting, to JMeter’s multiprotocol support, Locust’s Python-based user behavior simulation, and Speedscale’s Kubernetes-centric design, these tools offer a variety of options for load testing and performance assessment.
Speedscale, in particular stands out for its specialization in Kubernetes development and API benchmarking. Speedscale can capture and replay real-world traffic patterns that can help organizations simulate workloads to identify bottlenecks and performance issues. Through its observability metrics, including response times, error rates, and throughput, Speedscale can enable better benchmarking and monitoring. These features help organizations ensure that their APIs and services remain performant, scalable, and reliable.