
Nate Lee here, and I’m one of the founders of Speedscale. The founding team’s worked at several observability and testing companies like New Relic, Observe Inc, and iTKO over the last decade. Speedscale traffic replay was borne out of a frustration from reacting to problems (even if they were minor) that could have been prevented with better testing.
The problem with tests
We analyzed how most conventional engineering teams build quality into their apps, and identified the 3 most common delays:
- Building test automation (like integration tests, UI tests, or load tests) is slow. It usually involves scripting or manual one-by-one test generation – even if it’s with a tool.
- Stable and predictable environments to run tests are hard to come by (eg. why is staging is always broken?)
- Getting good data is hard. The data you test with is important, as it can determine which code paths get exercised, as well as can uncover errors in parsing or API contracts.
We’ve heard from a number of engineers we’ve interviewed that the real wish is to simulate production conditions early and easily, in any lower environment from staging to your laptop. That way you can quickly check if realistic transactions work against the changes you just made, and you’re good to move on.
Why Traffic Replay
Analyzing past traffic and processing it into replayable traffic allows us to address a number of these problems.
- Traffic contains the API schema and url of the call, which is what we normally try to script in a test case. In other words, tests can be built from examining inbound traffic into our service that we’re trying to test.
- Traffic can tell us the flow of transactions into our service, and also what calls are subsequently made after (what backends the service relies on). Based on this information, we know what backends your service needs in order to be exercised. Those backends can be modeled and mocked by analyzing the traffic.
- Traffic contains real world usage and data values of how our services are used. These data values contain PII however, which need to be safely redacted before it can be used in replayable traffic.
Kubernetes was a logical place to start, given its increasing adoption and it’s where the industry seems to be going. Kubernetes also handles a lot of the necessary network routing and ability to ephemerally provision pods. This makes it easier to dynamically increase the number of test runners to generate load . Also, by adopting the sidecar pattern from service mesh technology, we were able to create an easy way to capture traffic.
Traffic Replay considerations
When capturing traffic, data security is a big concern. Therefore we built-in a way to prevent any sensitive data from being captured. Transactions are observed and can be redacted by data field, endpoint or url for any sensitive information, before being stored and made available for browsing. By browsing and filtering down to the desired traffic, a developer can generate desired tests and associated mocks in a few seconds to minutes depending on the number of messages. Filtering can be done by time frame, endpoints, cluster/namespace, HTTP method, or whether you want to generate just tests or just mocks.
The Kubernetes Operator uses “snapshots” to patch a workload with the full dataset needed to run a test. By patching your deployments, a fully contained “snapshot” will first stand up the necessary backends as a mock pod, wait for your latest deployment to become ready, and then start running realistic traffic as a generator pod that exercises your latest build. This cuts down on the typical delays building test scripts, preparing giant test environments, and finding the right test data to run. There are also several configurable flags that allow for options such as environment cleanup behavior, increasing the number of traffic copies, or inducing backend mock errors such as 404’s, latency or non-responsiveness. All of this can be automated via CICD or Gitops.
The most common question we get is around statefulness of the data and how we persist it across transactions. This is mostly a concern for users who wonder how much data setup is required for the backends. The short answer is we designed Speedscale to automatically parameterize what we think are going to be key fields in the messages within a snapshot. Easy ones are things like timestamps, auth tokens and unique ID’s. More difficult ones (like unique IDs we wouldn’t think to parameterize) can be specified manually, which we will then automatically propagate throughout the snapshot. By replacing fields within the inbound requests or backend responses on the fly, we can simulate realistic behavior with appropriate values and make the snapshots a lot less brittle, like conventional hand-scripted mocks tend to be. For example the traffic will look like it’s current time, instead of Cyber Monday holiday traffic from November. Also if you were querying for a user “John” with token “abc” from your service under test, and in turn that service would query a backend API or database, our mocked backend response would intelligently return the proper value inline with where we were in the sequence of replies as well as based on the fields in the request message.
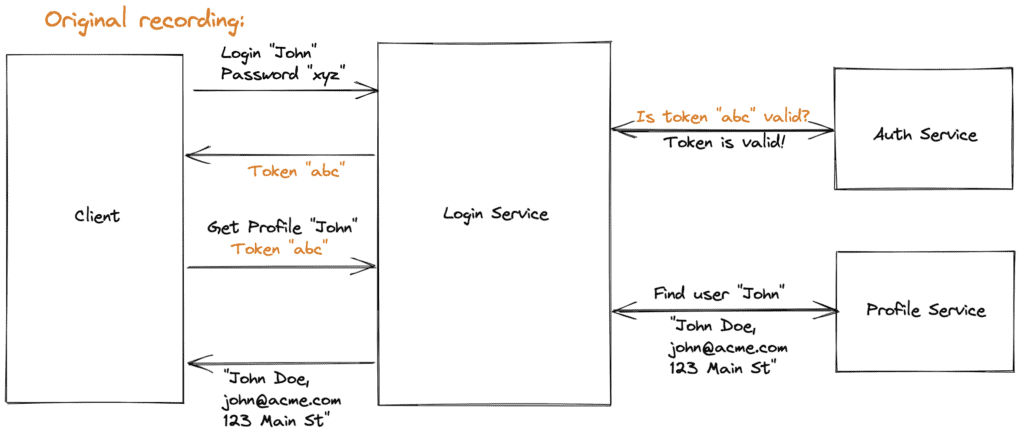
Fig 1
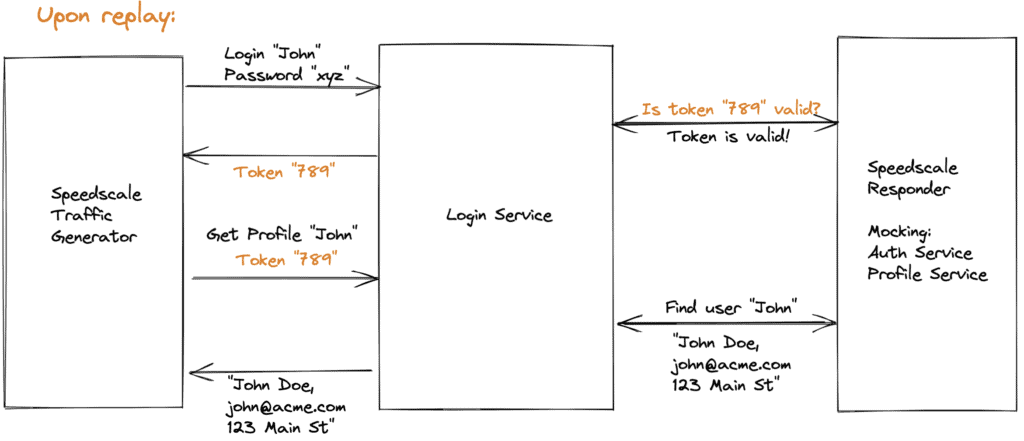
Fig 2
When to use Traffic Replay
While Speedscale is most commonly leveraged for load, functional, and chaos testing, we’ve had a variety of use cases arise beyond normal testing that we didn’t expect:
- Parity testing to ensure migrations to different platforms (eg. off EC2 onto Kubernetes) function the same way they used to (baseline your performance before, during and after).
- Benchmarking for rapid experimentation of new cloud processors or architectures, since the traffic replay snapshots can behave effectively as repeatable blackbox test harnesses.
- API observability – by providing visibility into how calls transpire among microservices, users are able to follow the flow of messages (only -1 hop and +1 hop of the service being monitored) and debug problems quickly. Speedscale can map dependencies and provide insight into how certain APIs work. This displays PII-redacted message headers and payloads. This is useful when joining a new team or working on very old projects where no one knows how it works anymore.
- Testing Ingress or Gateway routing rules to ensure traffic isn’t blocked or sent to unexpected routes
Traffic Replay v1.0
Speedscale reaches v1.0 with the launch of the Replay Wizard. The process of finding realistic, PII-redacted traffic with good data, writing tests to exercise the endpoint, with all the necessary backends – can now be a 2 minute process. Ordinarily this would take a couple days at the end of a sprint. Traffic Replay can also serve as Continuous Performance testing or sanity testing as part of your pipeline – running every pull request or before deployment.
The Replay Wizard allows a user to:
- View a specific timespan of traffic
- Select whether to build tests, mocks or both
- Configure the replay duration, number of copies of traffic, latency and amount of chaos
- Choose the cluster, namespace and workload to run the replay against
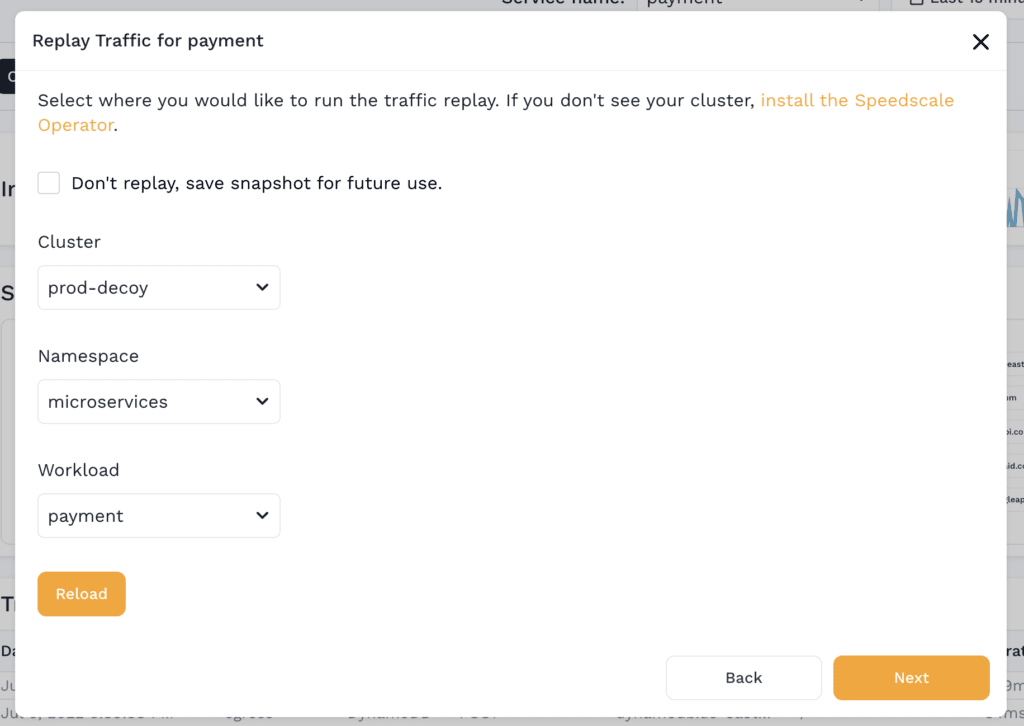
Fig 3
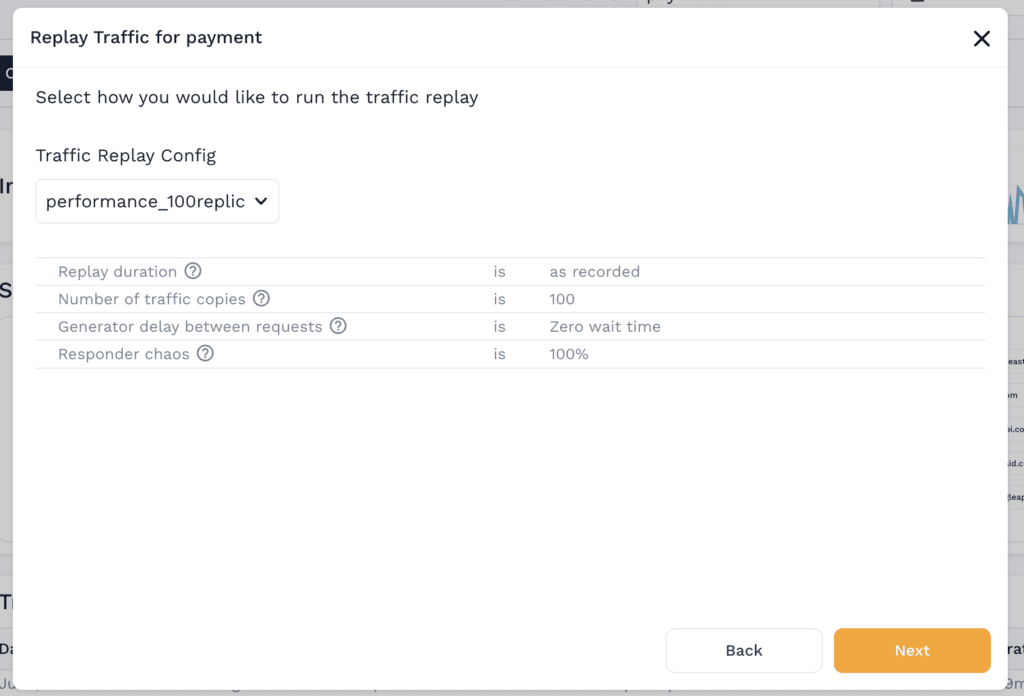
Fig 4
Testing is by no means one-size-fits-all, and for teams that do a lot with Postman or K6, we’ve built scripts to convert our traffic snapshots into Collections or K6 scripts. We’re on a mission to help devs autogenerate tests quickly, even if it doesn’t involve using our traffic generator pods. We’re interested to hear your thoughts, wish-for features, and happy to answer any questions. Join our Slack community and let us know!