Debugging Encrypted Microservice Traffic with Speedscale's eBPF Collector
Production bugs that only reproduce in actual traffic can be some of the most frustrating bugs in software development. You can stare at your logs, add traces to your code, add instrumentation – and still not be able to see the actual requests that went over the wire. And that gets even harder when the requests are encrypted and the system is a black box. You can use tools like Wireshark or Kubeshark to capture the requests. But they require storage for the dump of the packets or may not be enabled in the first place. You need to be able to see the actual requests and responses without modifying code, without dealing with certificates, without slowing down production systems. In this post, I will show you how to set up Speedscale’s eBPF collector and use it to capture actual requests and responses from a running Java application in a few minutes with a fresh install of Helm.
What the eBPF Collector Does Differently
Observability solutions tend to follow a progression. You start with telemetry agents that can provide you with metrics, logs, and traces. That lets you know when something goes wrong and where you’re spending your time. But once you start to actually debug your system, rather than simply alerting people to the problem, you need full fidelity. You need to see the actual requests and responses that went over the wire. Full fidelity used to require a sidecar in the path of every request. Sidecars add latency to your system. They add complexity to your system. And they add another point of failure to your system. eBPF bypasses that problem.
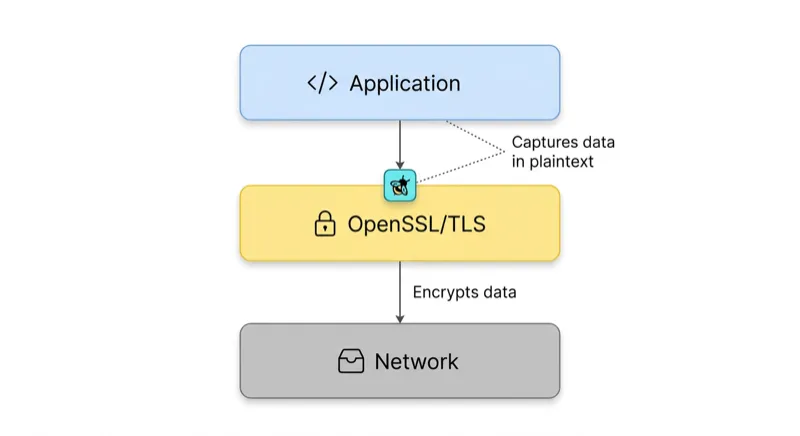
eBPF programs are executed directly in Linux kernel space, where they attach themselves at points in the Linux network stack where data flows before encryption and after decryption. With respect to TLS traffic, the collector attaches itself to the OpenSSL library’s SSL_write() and SSL_read() functions through the use of uprobes, which means it can capture plaintext payloads at exactly the point where the application is passing them off to, or receiving them from, the library. To learn more about eBPF and how we built the collector, check out our blog post on building the eBPF agent.
Benefits
- No Cert Management. You don’t have to worry about installing a CA or rotating certs.
- No Application Code Changes. The application is oblivious to the monitoring.
- No Sidecar Per Pod. It’s a DaemonSet, which means there’s only one container per node.
- Low Overhead. Application latency is very low at production traffic rates, with minimal cluster resource consumption.
Prerequisites
You need to have access to a Kubernetes cluster. You can install minikube if you don’t have one. You don’t have to install an application, as we include one as part of the operator install.

Step 1: Install the Speedscale Operator with the Demo App
First, get your API key from your Speedscale profile page. Haven’t signed up? Start a free trial. Want to try it out on your local machine without signing up? You can use proxymock to capture and replay traffic on your local machine.
Add the Helm repo and install the operator. The deployDemo: "java" flag, which is enabled by default, means the operator will automatically install a Java Spring Boot demo application alongside itself. This means you can immediately observe the demo application after installation.
helm repo add speedscale https://speedscale.github.io/operator-helm/
helm repo update

helm install speedscale-operator speedscale/speedscale-operator \
  -n speedscale \
  --create-namespace \
  --set ebpf.enabled=true \
  --set apiKey=<YOUR-SPEEDSCALE-API-KEY> \
  --set clusterName=<YOUR-CLUSTER-NAME>
deployDemo is enabled by default, so the demo application is automatically deployed. You can override this with --set deployDemo="java" or --set deployDemo="" if you want. ebpf.enabled must be enabled to record eBPF data. It is required unless you want to disable eBPF and use sidecars instead.
Check the operator and forwarder pods are running:
kubectl -n speedscale get podsExpected output:
NAME                                    READY   STATUS    RESTARTS   AGE
speedscale-forwarder-xxxxxxxxxx-xxxxx   1/1     Running   0          5s
speedscale-operator-xxxxxxxxxx-xxxxx    1/1     Running   0          15s
The java-server demo pod should appear in the same namespace. It’s a simple Spring Boot web server with authenticated endpoints, making HTTP requests.
Step 2: Enable eBPF Monitoring via the Infrastructure UI
With the operator running, go to the Infrastructure section of the Speedscale web UI at app.speedscale.com/infrastructure.
You should see your cluster listed under the name you chose during installation. Clicking on it opens the Cluster Inspector, a tabbed view of all Speedscale monitored workloads for this cluster.
Activate eBPF on the java-server
- Go to the Workloads tab. You should see all deployments in the namespace, including
java-server. - For eBPF, you need to flip the Injected switch. This is where you register workloads with the eBPF collector. No sidecar is injected into the pod itself.
- Toggle Injected to
trueforjava-server.
You’re done! eBPF collector on each node starts monitoring traffic to and from java-server pods right away, without any need for pod restart.
The Workloads tab offers additional information and actions for each workload:
- TLS Out: Whether unwrapping of outgoing TLS is enabled (useful for services calling other APIs over HTTPS)
- Container Logs and Sidecar Logs: Clicking these buttons allows you to view logs directly in the UI without needing
kubectlaccess - Sidecar Health: An alert icon is displayed for any issues related to capture health and configuration
- Request CPU/Memory: Current resource utilization for the workload
Step 3: Inspect Traffic in the Traffic Viewer
When you’ve done this, you should see live traffic from java-server appear in the Traffic Viewer.
What you can see
The Traffic Viewer offers a detailed log of all captured transactions. Each request/response pair offers:
- Info: Response codes, duration, URL, timestamp
- Request: Headers and body sent
- Response: Headers and body received
This includes outgoing calls from java-server to other services, even if they are encrypted with TLS. This is because the eBPF Collector works with OpenSSL at a library level, so it will capture the plaintext payload before it is encrypted. This means you will be able to see the JSON (or whatever format) your service is actually sending and receiving.
Filtering down to what matters
The filter features allow you to filter your view of the traffic:
- Time Range: Zoom in on a specific time window, which is useful if you are correlating a bug report with a specific timestamp.
- Inbound/Outbound: Switch between incoming traffic to
java-serverand outgoing traffic from it to other services. - Status Codes, URLs, and Headers: Filter on error responses, specific URLs, and specific header values.
- Full Text: This is probably one of the most important features and is a filter on text anywhere in the traffic set. This will even find text in the payload of binary protocols such as gRPC, databases, and other sources.
Click on a row to expand it into the Request/Response Pair view. This is where you will find the complete picture of what is going on. The exact bytes sent and received will be shown in a human-readable form. For JSON payloads, you will even be able to toggle between raw and pretty views. Schema mismatches, missing fields, and unexpected values will all be available without having to instrument anything on your end.
The Traffic Viewer will also show a Service Map, which will display the dependency graph constructed from the actual traffic. The inbound callers to java-server and its outbound dependencies will be represented as nodes in the graph, with request volumes and error rates on the edges.
Step 4: Archive Traffic as a Snapshot
After you have identified a time window or requests that you want to save as a snapshot, you can do so. A snapshot will save the selected traffic as a self-contained artifact that includes:
- Raw Traffic - the actual requests and responses
- Transform Rules - the rules that define how to transform the requests during the replay process
- Discovered Tokens - the dynamic values in the requests that will be automatically handled during the replay process. For more on how to keep your sensitive data safe, please see DLP, Traffic Replay, and the Missing Link to Software Quality.
How to create a snapshot
- In the Traffic Viewer, select the traffic that you want to save as a snapshot using the time picker and filters.
- Click Save to Tests/Mocks.
Snapshots are reusable between replay runs. Each run generates its own report with its own latency graphs, assertion results, and captured traffic, but all runs share the same source snapshot. This means that the snapshot is a stable test fixture, with the traffic you saw in production today becoming the load you can run against the code deployed tomorrow.
Resource Considerations
The default values.yaml file sets the CPU limit to 500m and memory limit to 1G per container. For nodes that need to handle high volumes of traffic, you can adjust these values in your values file:
ebpf:
  enabled: true
  resources:
    requests:
      cpu: "200m"
      memory: "512M"
    limits:
      cpu: "1000m"
      memory: "2G"
We strongly advise against running the collector with the debug log level under production load, however, as this will greatly increase CPU utilization in the ingest container and may lead to dropped traffic under moderate request rates.
What’s Next
The workflow above, install, activate, inspect, archive, will take around ten minutes with an existing Kubernetes cluster. The demo app provides you with some real traffic to play with right away, but the same workflow applies to your own applications.
Now that you have your archive, the obvious next steps are:
- Replay it with your new version of the service to catch regressions before they reach production
- Add assertions to verify response codes, response payloads, or latency budgets
- Use it to mock your downstream services that depend on
java-serverto isolate their tests from your running backends
This is the full-fidelity production context that closes the Observability Gap. Sampled traces tell you something went wrong. Full traffic archives let you test code changes against exactly what production experienced — including the encrypted payloads that traditional monitoring never captures.
For more information on any of the above, see the Speedscale documentation or drop us a line at support@speedscale.com.