The Kubeshark Workflow That Doesn't Stop at the Dashboard
The Observability Gap shows up the moment you try to reproduce a production bug locally. Your traces tell you a request was slow. Your logs tell you which line printed. Neither tells you what was actually on the wire: the headers, the JSON body, the surprise field your client started sending last Tuesday. Until now, closing that gap meant SSHing to a node, attaching a debugger, or shipping a sidecar through change review.
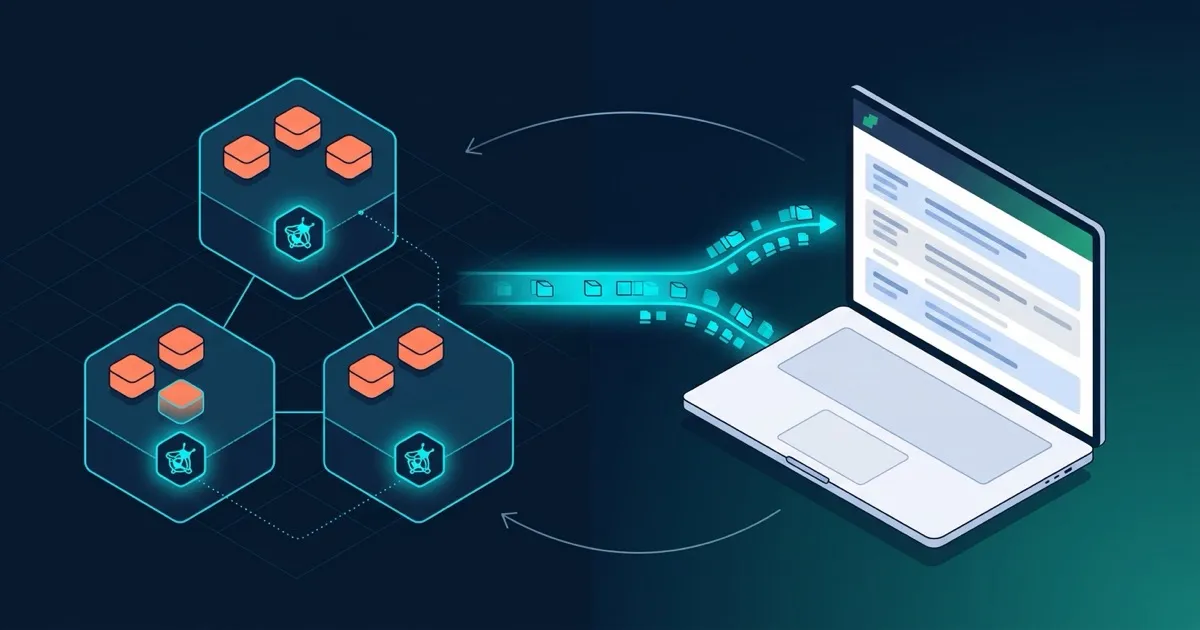
The new Observability surface in proxymock web collapses that workflow into a single command on your laptop. The Speedscale operator deploys nettap, a kernel-level eBPF capture DaemonSet. nettap streams decoded request/response pairs to the in-cluster speedscale-forwarder. proxymock web auto-port-forwards to that forwarder using your existing kubeconfig and renders the live stream in a local browser. No sidecar injection, no certificate exchange, no application restarts.
This post walks through the entire setup against a fresh cluster: install the operator, mark a workload for capture, install proxymock, point your kube context at the cluster, and watch real traffic land in a tab on localhost:7788. From there you can save a snapshot, replay it locally against your branch, or run it as a mock for the next debugging loop.
Architecture in one diagram
┌────────────────────┐     ┌──────────────────────────────┐
│   Your workload    │────▶│ nettap DaemonSet (eBPF)      │
│   (annotated for   │     │   - capture container        │
│    capture)        │     │   - goproxy ingest container │
└────────────────────┘     └──────────────┬───────────────┘
                                          │ decoded RR pairs
                                          ▼
                              ┌───────────────────────┐
                              │ speedscale-forwarder  │
                              │   (in-cluster pod)    │
                              └──────────┬────────────┘
                                         │  kubectl port-forward
                                         │  (auto, via your kubeconfig)
                                         ▼
                              ┌───────────────────────┐
                              │  proxymock web on     │
                              │  http://localhost:7788│
                              │  Observability tab    │
                              └───────────────────────┘
Two pieces are doing the heavy lifting. nettap loads eBPF programs into the node kernel, attaches to TCP send/recv syscalls (and to SSL_read/SSL_write for TLS-wrapping libraries), and ships the decoded payloads via a Unix socket to a sibling goproxy container that handles protocol dissection: HTTP, gRPC, Postgres, MySQL, Redis, Kafka, Mongo. The Speedscale operator manages a ConfigMap of capture targets (speedscale-nettap-targets) and reconciles it whenever you annotate a workload. proxymock web is the local browser UI; when it starts it port-forwards to speedscale-forwarder in the speedscale namespace and subscribes to the live observability stream.
Prerequisites
- A Kubernetes cluster you can reach with
kubectl. Local clusters work fine: minikube, kind, k3d, Docker Desktop, or Orbstack are all sufficient. Nodes need Linux kernel 4.18+, BTF enabled, and cgroup v2. Modern distros and the cloud providers’ managed offerings tick those boxes by default. - A Speedscale API key. Sign up for a free trial if you don’t have one.
- Helm 3 and a shell.
Step 1 — Install the operator with eBPF capture enabled
The operator is what gets nettap onto your nodes, manages the capture configuration, and runs the in-cluster forwarder that proxymock web will talk to. It installs via a Helm chart published at speedscale.github.io/operator-helm.
First, grab two pieces of input:
- API key: from your Speedscale profile page. The operator uses it to authenticate the forwarder to the Speedscale control plane.
- Cluster name: any string you want. It’s how this cluster shows up in the UI and across CLI commands; pick something memorable (e.g.
dev-laptop,staging-east).
Then add the Helm repo and install:
helm repo add speedscale https://speedscale.github.io/operator-helm/
helm repo update

helm install speedscale-operator speedscale/speedscale-operator \
  -n speedscale \
  --create-namespace \
  --set ebpf.enabled=true \
  --set apiKey=<YOUR-SPEEDSCALE-API-KEY> \
  --set clusterName=<YOUR-CLUSTER-NAME>
What the flags do:
-n speedscale --create-namespace: installs into a dedicatedspeedscalenamespace, creating it if needed.proxymock weblooks for the forwarder there.--set ebpf.enabled=true: the important one. This is what brings up the nettap DaemonSet (capture agent + protocol dissection). Without it you get the operator and forwarder but no in-kernel capture.--set apiKey=...and--set clusterName=...: required so the forwarder can register the cluster with the Speedscale control plane.
Verify the three core pods are up:
kubectl -n speedscale get podsExpected output (names will vary):
NAME                                       READY   STATUS    RESTARTS   AGE
speedscale-forwarder-xxxxxxxxxx-xxxxx      1/1     Running   0          25s
speedscale-operator-xxxxxxxxxx-xxxxx       1/1     Running   0          35s
speedscale-nettap-xxxxx                    2/2     Running   0          25s
The speedscale-nettap-* pod is the DaemonSet, one per node, two containers each (speedscale-nettap-capture for the eBPF agent, speedscale-nettap-ingest for protocol dissection). If you only see one container ready, give it another twenty seconds; the capture container needs to load eBPF programs and create the Unix socket before ingest will pass its readiness probe.
If deployDemo is enabled (the default for fresh installs), the operator also ships a small Java demo so you have traffic to look at on a brand new cluster. Skip that with --set deployDemo="" if you don’t want it.
That’s the minimum-viable install. For everything else (pinning image versions, configuring resource limits, wiring in Data Loss Prevention rules, restricting RBAC, running on EKS/GKE/AKS, or using a custom values.yaml instead of --set flags), see the full reference at docs.speedscale.com/setup/install/kubernetes-operator/.
Step 2 — Mark a workload for capture
nettap captures nothing by default. You opt in per-workload with an annotation. Find a workload in your cluster, or use the demo:
kubectl -n java annotate deployment java-server \
  capture.speedscale.com/enabled=true
The operator watches for that annotation, extracts the pod selector, and upserts an entry into the speedscale-nettap-targets ConfigMap. nettap reloads on its own. No pod restart, no rollout. Within a second or two the capture container starts decoding traffic for any pod matching the selector.
Optional knobs:
# Capture everything except the metrics and probe ports
kubectl -n java annotate deployment java-server \
  capture.speedscale.com/ignore-ports=9090,8081
Step 3 — Install proxymock locally
proxymock is a single binary. The install script puts it on your PATH:
sh -c "$(curl -Lfs https://downloads.speedscale.com/proxymock/install-proxymock)"Or on macOS:
brew install speedscale/tap/proxymockConfirm the version:
proxymock --versionIf this is your first time on this machine, run proxymock init once. It writes a config file under ~/.speedscale and pairs the CLI with your Speedscale account.
Step 4 — Configure your local Kubernetes context
proxymock web uses your current kubeconfig to find the forwarder. That means you need a context pointing at the cluster you installed the operator into. Most people already have this set up; the commands below are the standard moves if you don’t.
List your available contexts:
kubectl config get-contextsSwitch to the one running the operator:
kubectl config use-context <your-cluster-context>Verify connectivity and that the forwarder is reachable:
kubectl -n speedscale get svc speedscale-forwarder
kubectl -n speedscale get pod -l app=speedscale-forwarder
If you keep multiple clusters live at once and don’t want to rebind your shell context, you can pin proxymock to a specific context with the --kube-context flag in the next step. Otherwise, the current context wins.
Step 5 — Launch the Observability surface
proxymock webWhat happens, in order:
- Binds
http://127.0.0.1:7788. - Reads your kubeconfig, picks the current context (or
--kube-contextif you set it), and port-forwards to thespeedscale-forwarderpod in thespeedscalenamespace. You’ll see something like:Port-forwarded speedscale-forwarder (current kube context) -> 127.0.0.1:54213 Starting proxymock web at http://127.0.0.1:7788 - Opens your browser. The Observability tab subscribes to the live capture stream from the forwarder.
That’s it. Traffic from any workload annotated in step 2 starts streaming into the UI. There is nothing else to wire up: no --forwarder-addr, no manual port-forward, no kubectl proxy command running in another tab.
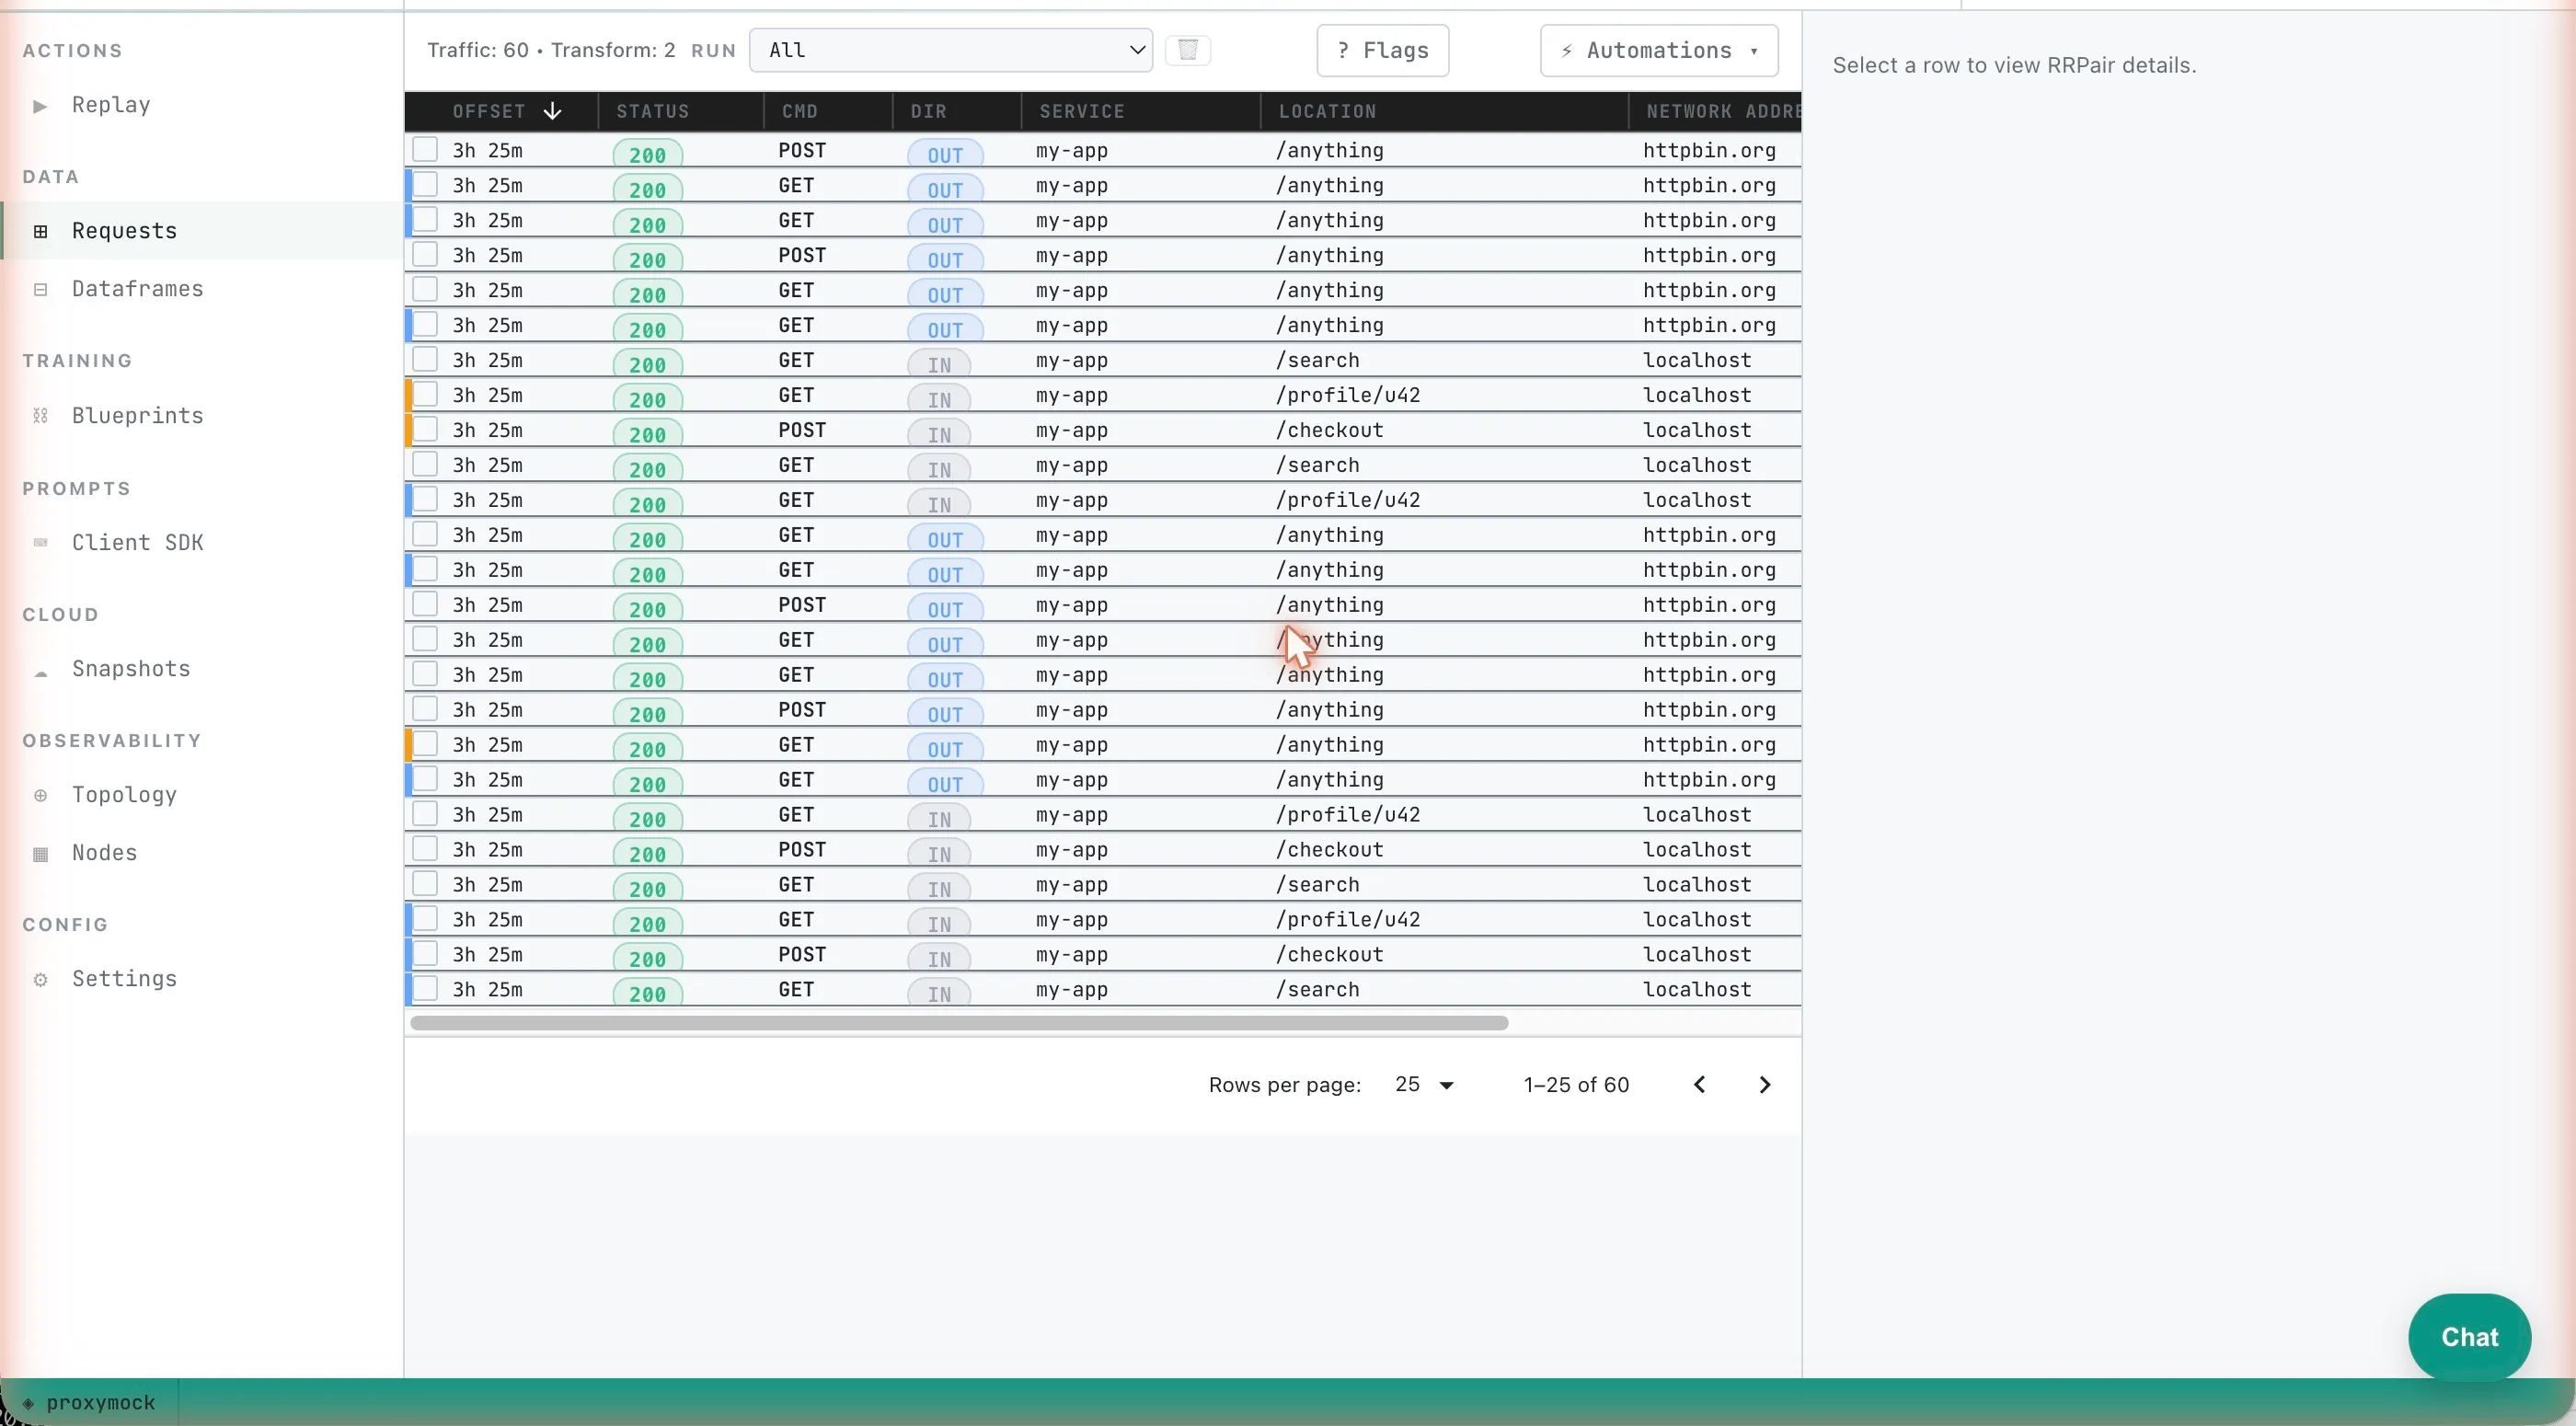
If your cluster isn’t reachable (no kubeconfig, wrong context, VPN down, forwarder pod missing), proxymock web still comes up; it just disables the Observability surface and tells you why. Click the Retry button in the topology chooser once you’ve fixed the connectivity, and the auto-port-forward attempts again without restarting the process. This matters because the local workflows (replaying recorded traffic, running mock servers, comparing RR pairs) don’t depend on the cluster at all.
What you can do from the Observability surface
The point of streaming traffic into a local browser isn’t to admire it. It’s to use it.
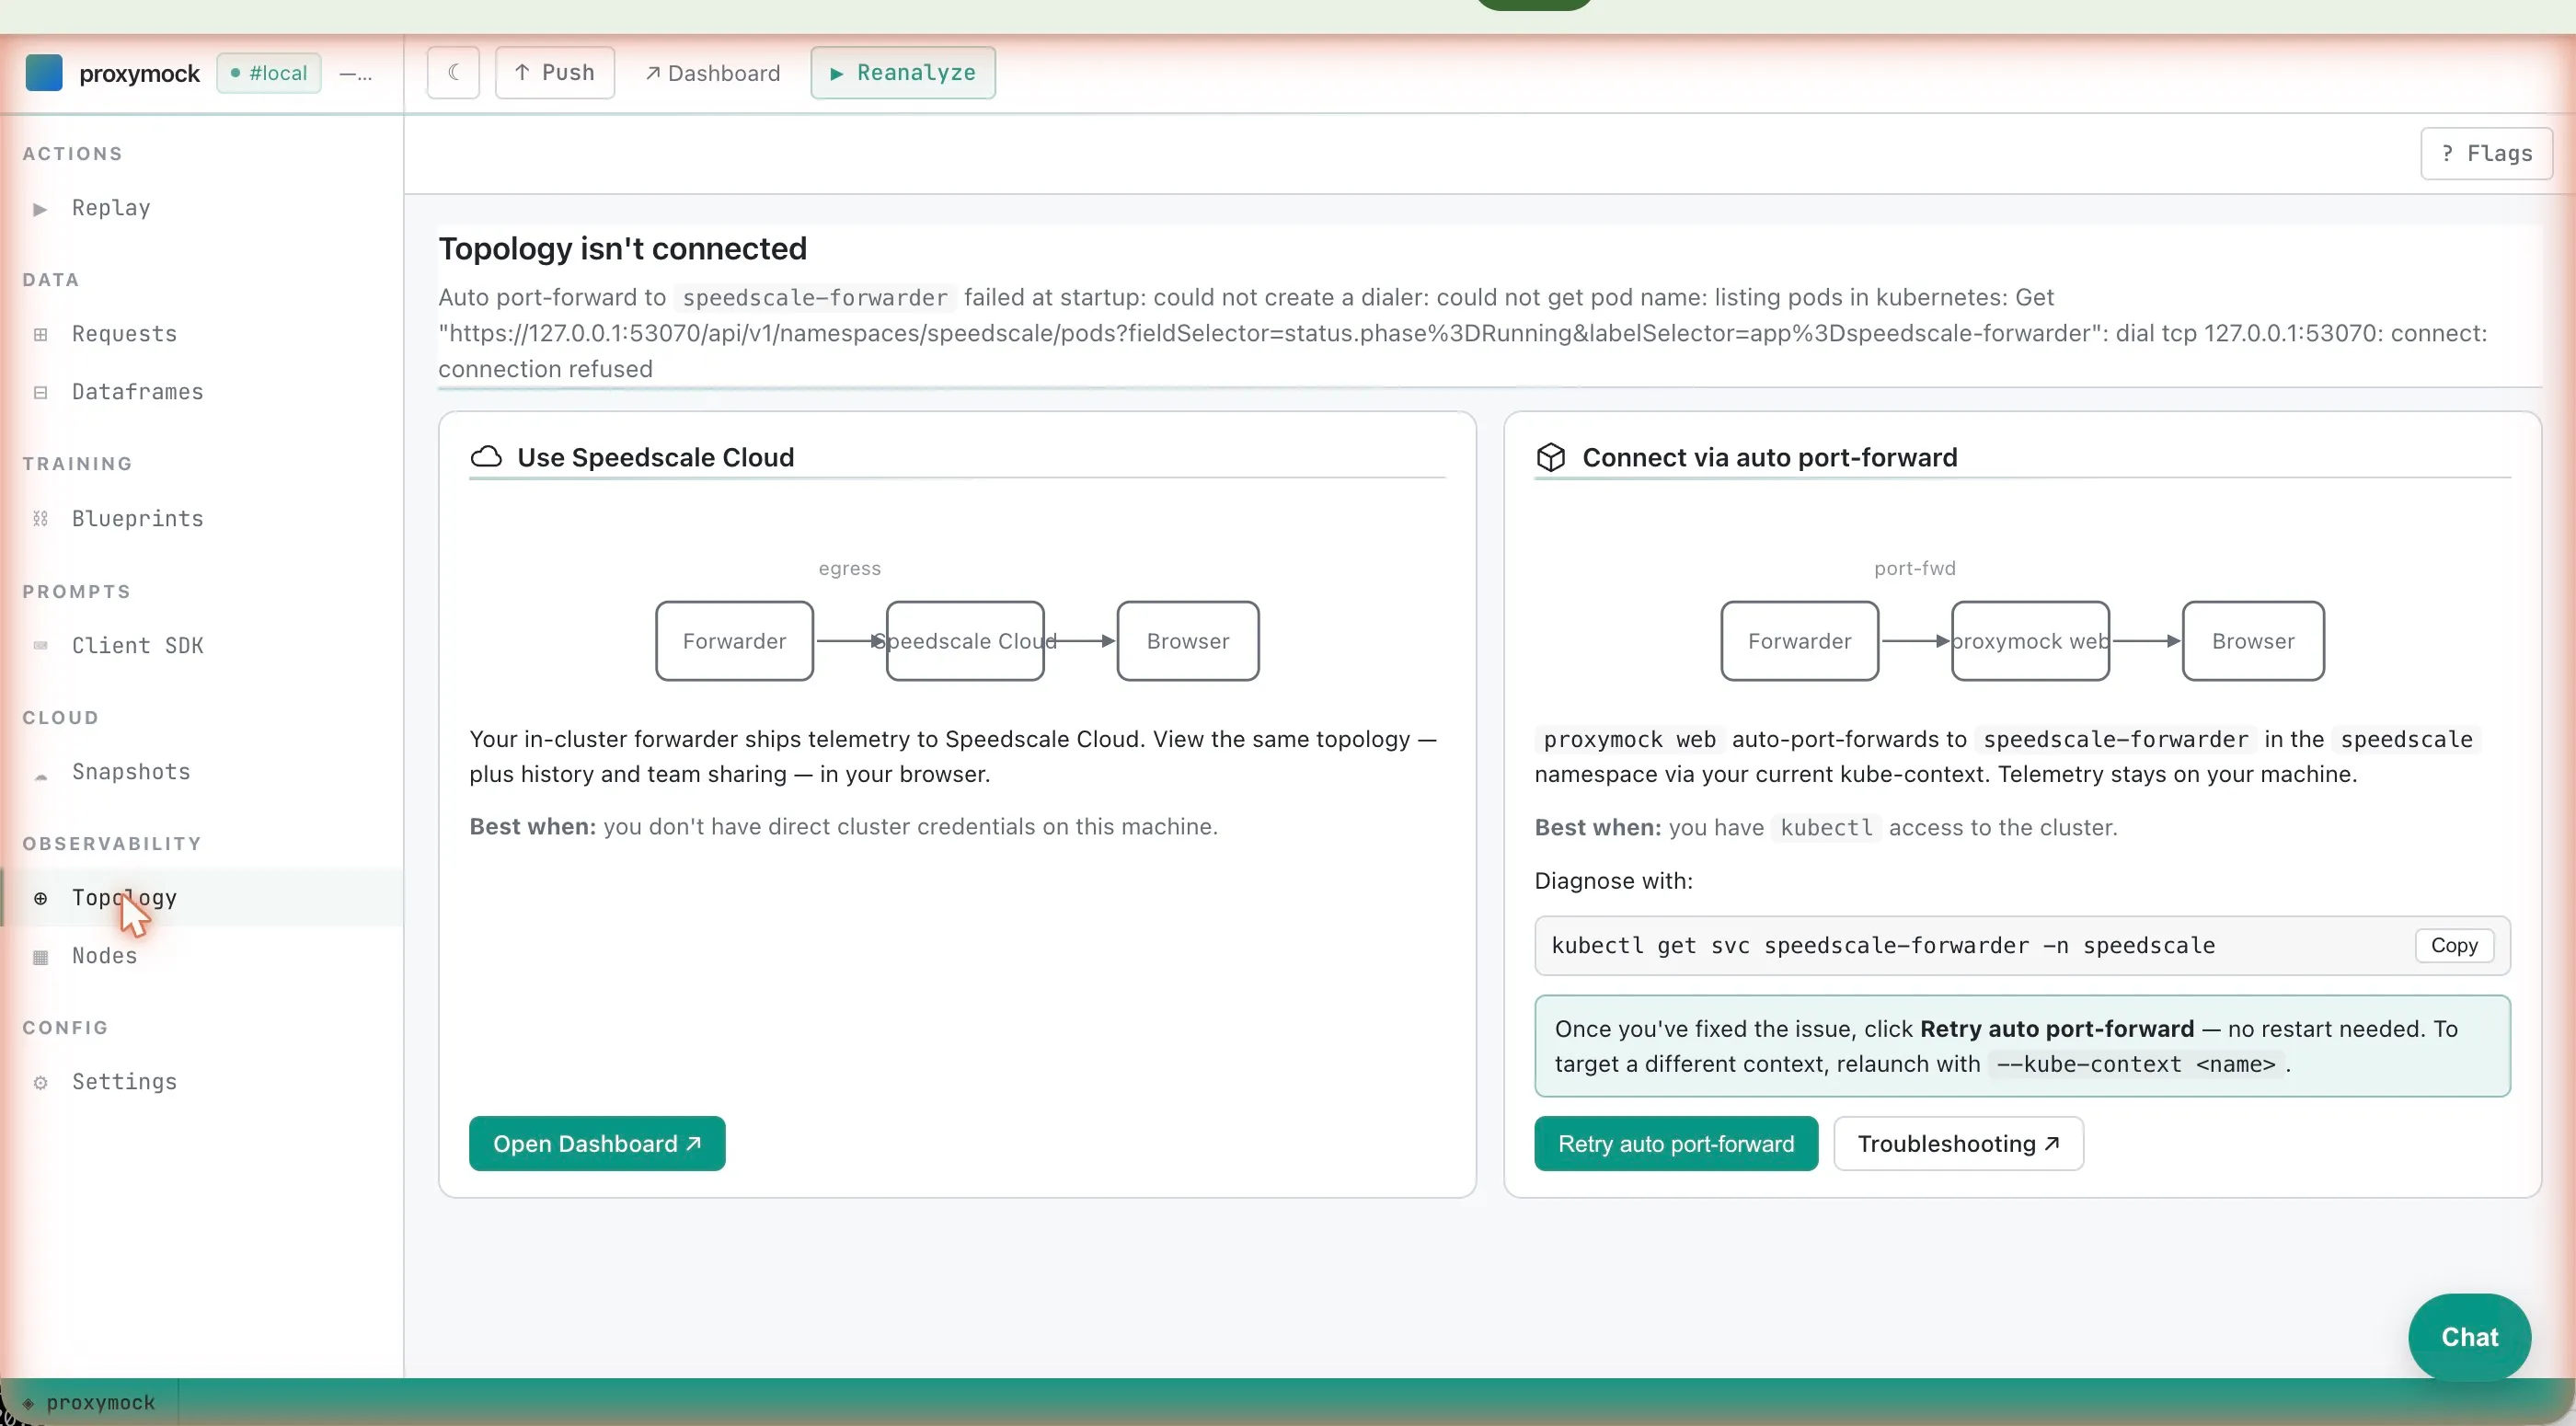
Watch the wire. The live view shows every captured request/response pair as it lands. Click a row and you get headers, body, status, latency, and the protocol dissection (JSON pretty-printed, gRPC fields decoded, SQL parsed, etc.). For TLS traffic captured via OpenSSL/LibreSSL/BoringSSL uprobes, you see the plaintext payload, with no certificate juggling required.
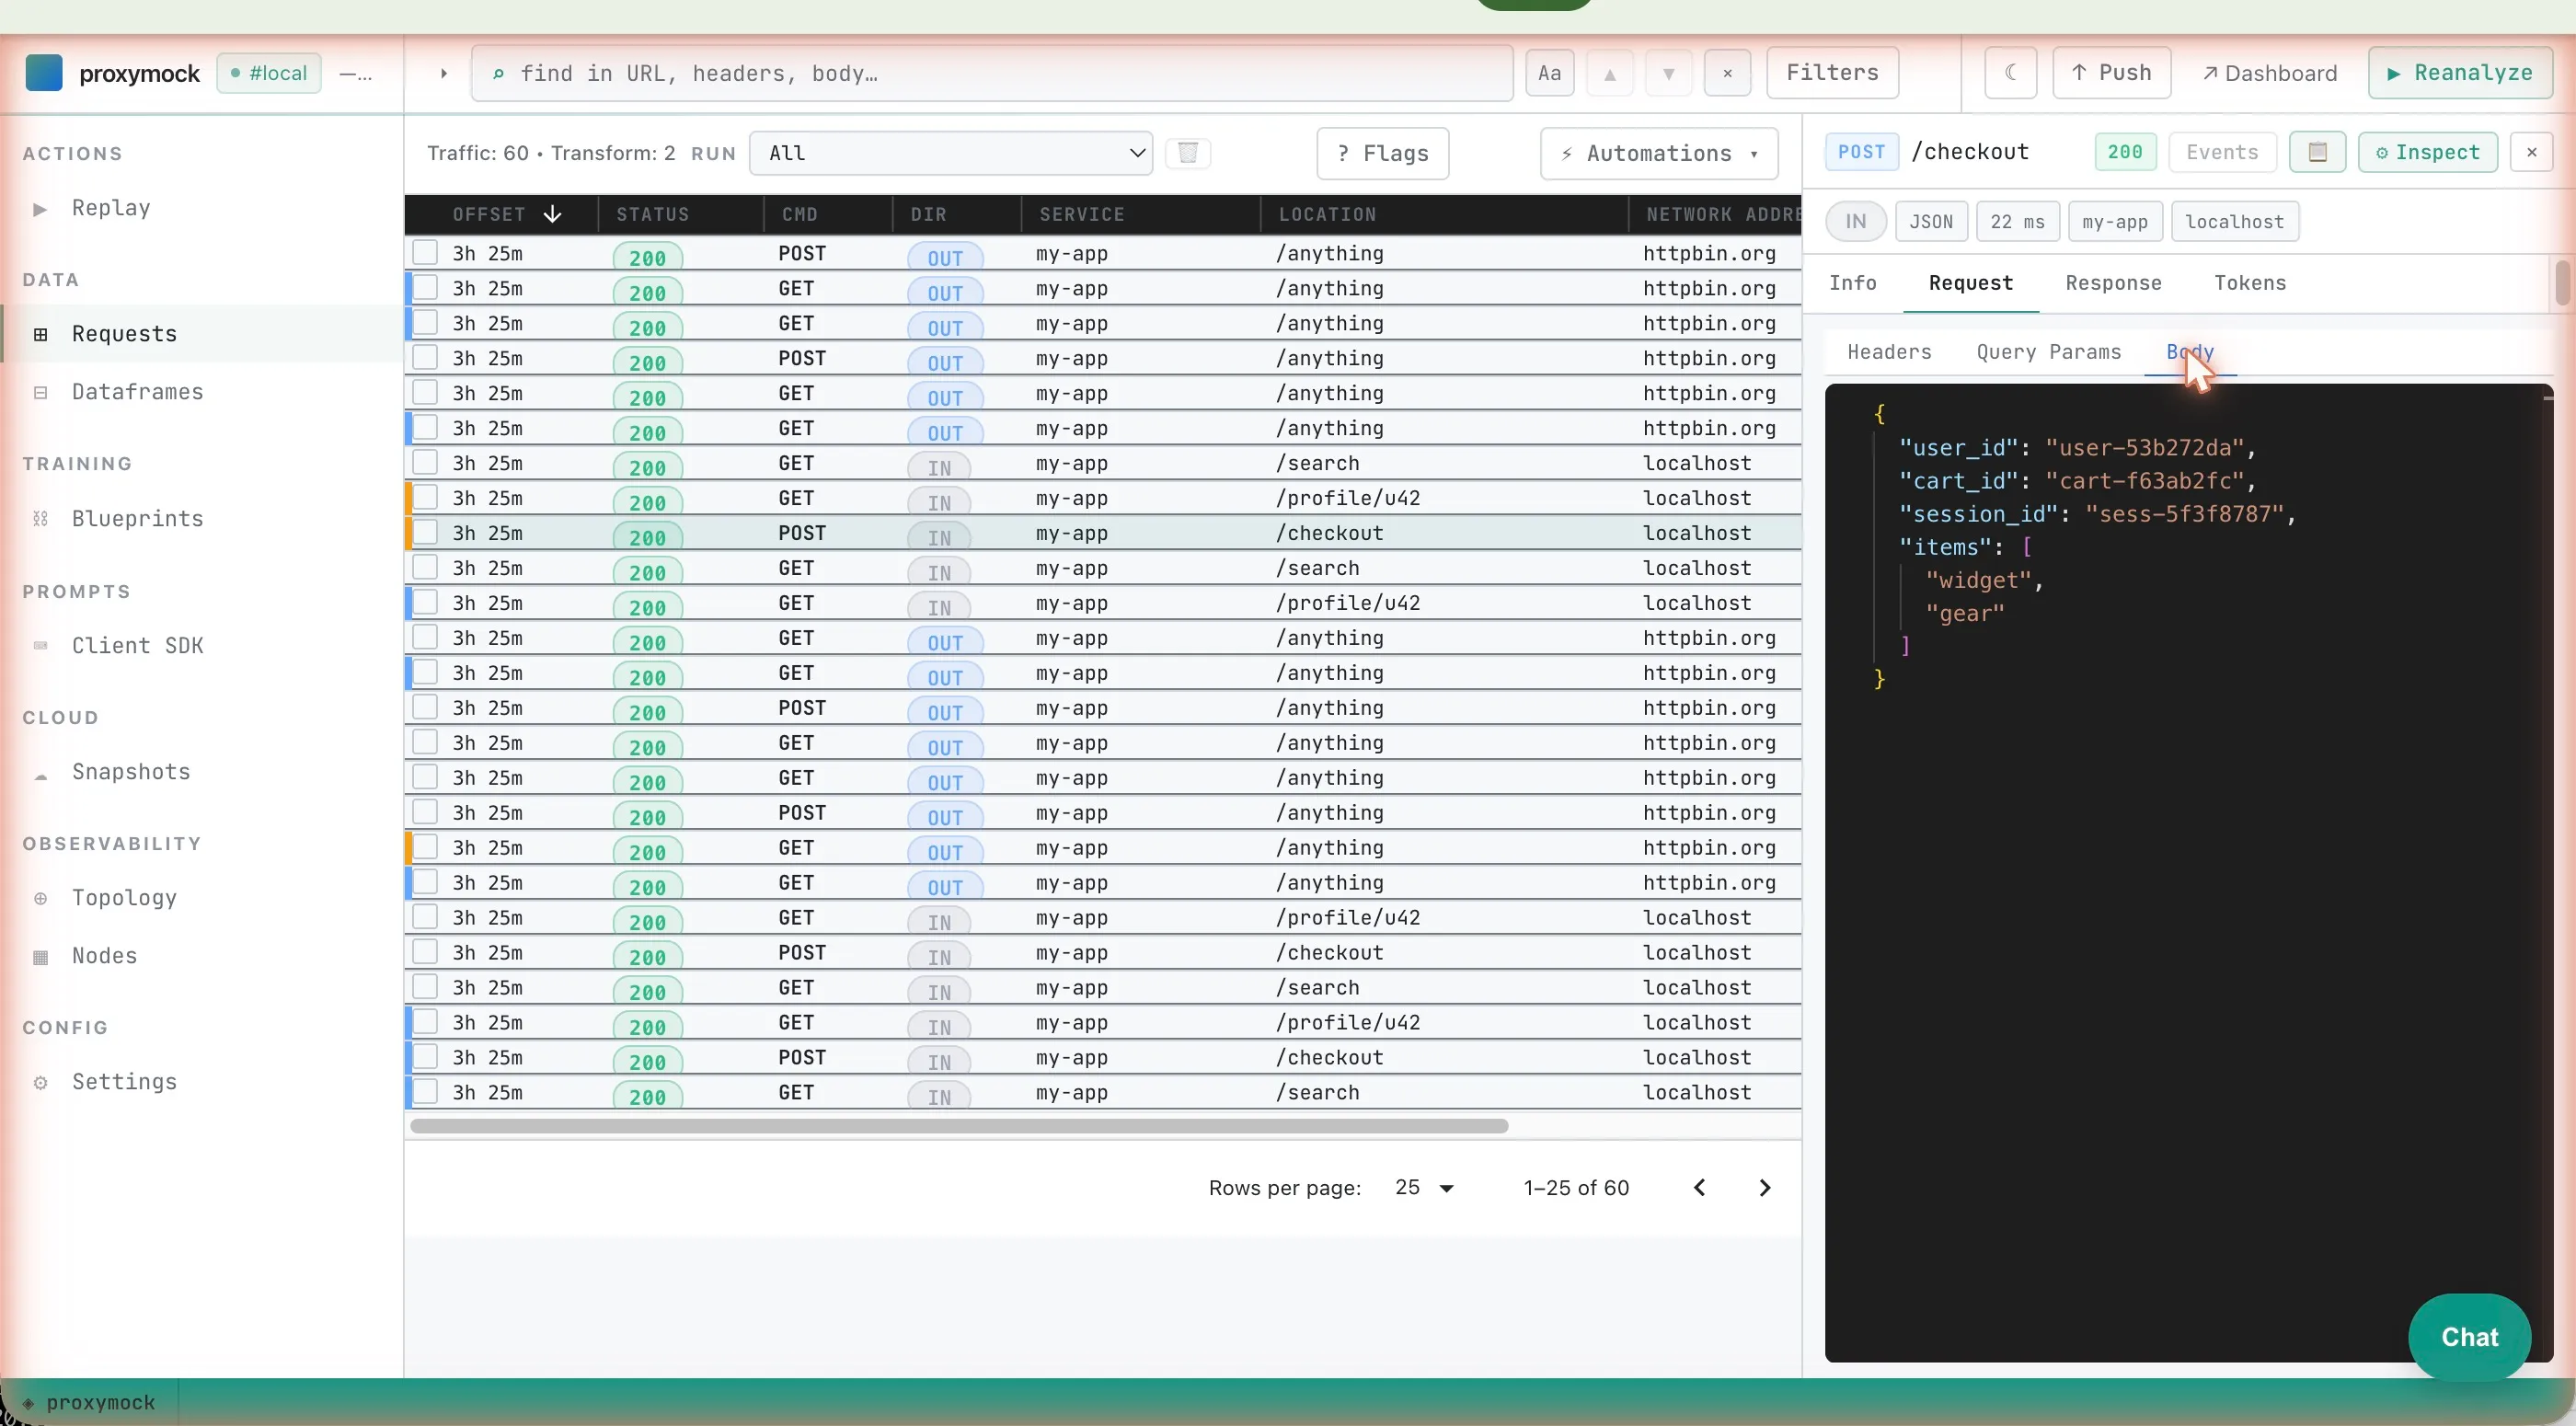
Filter. Inbound vs outbound, status codes, URL substrings, full-text across the entire payload (including binary protocols). The full-text filter is the one to remember; it’ll find a UUID inside a gRPC field or a SQL query body without you having to know which protocol the request was riding on.
Save to your workspace. When you’ve isolated the time window or set of requests that reproduce the issue, save them. The Observability surface writes the selected RR pairs straight into your local proxymock workspace, the same directory the rest of proxymock web already reads from. No cloud round-trip, no separate pull step. The files are on your laptop the moment you click save.
Replay against your branch. Start your service on localhost:8080, then point a replay at the workspace directory you just saved into:
proxymock replay --in ./proxymock --test-against http://localhost:8080Every captured request is replayed; differences in response codes, payloads, and latency are reported. This is how you catch regressions before they merge, using real production-shaped traffic instead of a synthetic Postman collection.
Or mock dependencies. If your service makes outbound calls you don’t want to make in dev, start a mock server from the same files:
proxymock mock --in ./proxymockPoint your service’s outbound configuration at the mock and run your test suite. Any request the mock has seen returns the recorded response; anything it hasn’t is logged and (optionally) forwarded.
Why this is different from “yet another tracing tool”
Traces tell you something happened. They sample. They drop body content. They lose binary payloads. They require code instrumentation. None of that is a good fit for the bug you actually got paged about.
Capturing the bytes that crossed the wire used to mean a sidecar proxy in front of every workload, with all the latency, certificate, and rollout friction that entails. nettap does the capture in the kernel, once per node, with ~1-3% CPU overhead and no application changes. The operator manages the lifecycle. proxymock web is the local lens. It brings the cluster’s live traffic to your laptop without you having to log into the cloud UI, without you having to remember which pod a forwarder is in, and without you having to keep a kubectl port-forward running in another shell.
A note for Kubeshark users. If you’ve reached for Kubeshark when you needed a Wireshark-style view of a Kubernetes cluster, the capture story here will feel familiar: eBPF on the node, L4/L7 dissection, TLS unwrapped without certificate juggling. The difference is what happens once you’ve found the interesting bytes. Kubeshark stops at observability: you see traffic, query it, export PCAPs, end. proxymock treats that same capture as the input to the rest of the development loop. The RR pairs land in your local workspace, where
proxymock replayruns them back against your branch to catch regressions, andproxymock mockboots a mock server so your service can run offline against real production-shaped traffic. Same eBPF-powered visibility, plus replay, plus mocking, plus assertion-based regression tests, without leaving the proxymock UI.
The full loop (see real traffic, save it, replay it, mock it) collapses from a multi-tool dance into a single browser tab plus a CLI you already have installed.
What’s next
- Annotate the rest of your services. One annotation per workload. Capture targets reload without restarts, so you can iterate.
- Wire saved traffic into CI. The workspace directory is just RR pair files. Commit a subset to your repo (or generate them on the fly) and run
proxymock replayas a GitHub Actions step that gates merges on real traffic instead of hand-written cases. - Try the chat panel.
proxymock webships with a chat side panel that has direct access to the captured RR pairs, replay reports, and mock server controls. Ask it “what changed between this capture and the last replay” and watch it dig.
For the full feature reference, see the Speedscale docs. Hit us up at support@speedscale.com. We want to hear what you capture first.