Logs told me something broke. Traffic showed me what.
Here’s a problem I run into constantly: something breaks in production, I can see the 500 errors in my logs, but I can’t reproduce it locally. The trace shows me the dependency graph but not the actual request that failed.
This is especially painful in microservices. I was looking at a CNCF example the other day (a simple demo app, like 4 pods) and it already had so many cross-service dependencies that understanding what broke required looking at the whole system at once. Real production apps are worse.
What I actually need isn’t more observability. I need the traffic. The raw requests and responses, captured from production, so I can replay them against my local build and see exactly what happened.
But here’s the thing a lot of our customers tell me: they can’t send that data to a third party. Payloads contain sensitive stuff. They’ve got compliance requirements. The data has to stay in their cloud.
So we built BYOC (bring your own cloud). Here’s how it works with Elasticsearch.
Walkthrough: capturing production traffic into your own Elasticsearch, pulling it down locally with es-gather.py, and reproducing the bug with proxymock.
How the data flows
Speedscale’s eBPF agent captures traffic at the node level without touching your app. It sends that to the Speedscale forwarder, where you apply your DLP rules and filter out what you don’t want. Then it exports to any OTel-compatible collector, in this case your own Elasticsearch cluster inside your VPC.
The data lands in ES in OTel logging format. One document per request/response pair. Headers, payloads, latency, the whole thing.
We’ve got a Helm chart that stands up Elasticsearch + Kibana + the OTel collector with a pre-built “Speedscale Traffic” dashboard. One helm install and you’re looking at live traffic from your cluster.
What it looks like
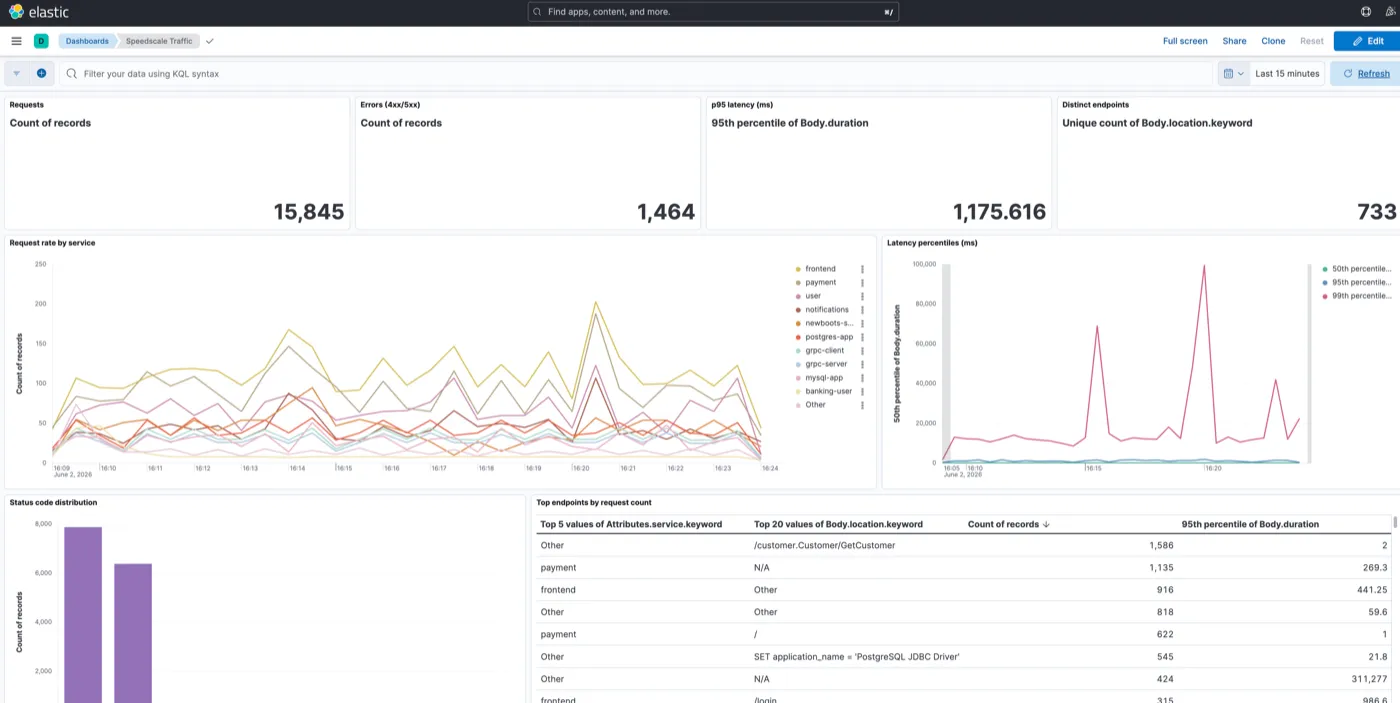
The dashboard out of the box shows request rate by service, latency percentiles, status code distribution, and top endpoints by volume. It’s not fancy, just enough to tell you traffic is flowing and spot anomalies.
In my demo I had a service called outerspace-server showing periodic HTTP 500 errors. You can see them show up in the status distribution panel. That’s the signal I wanted to chase down.
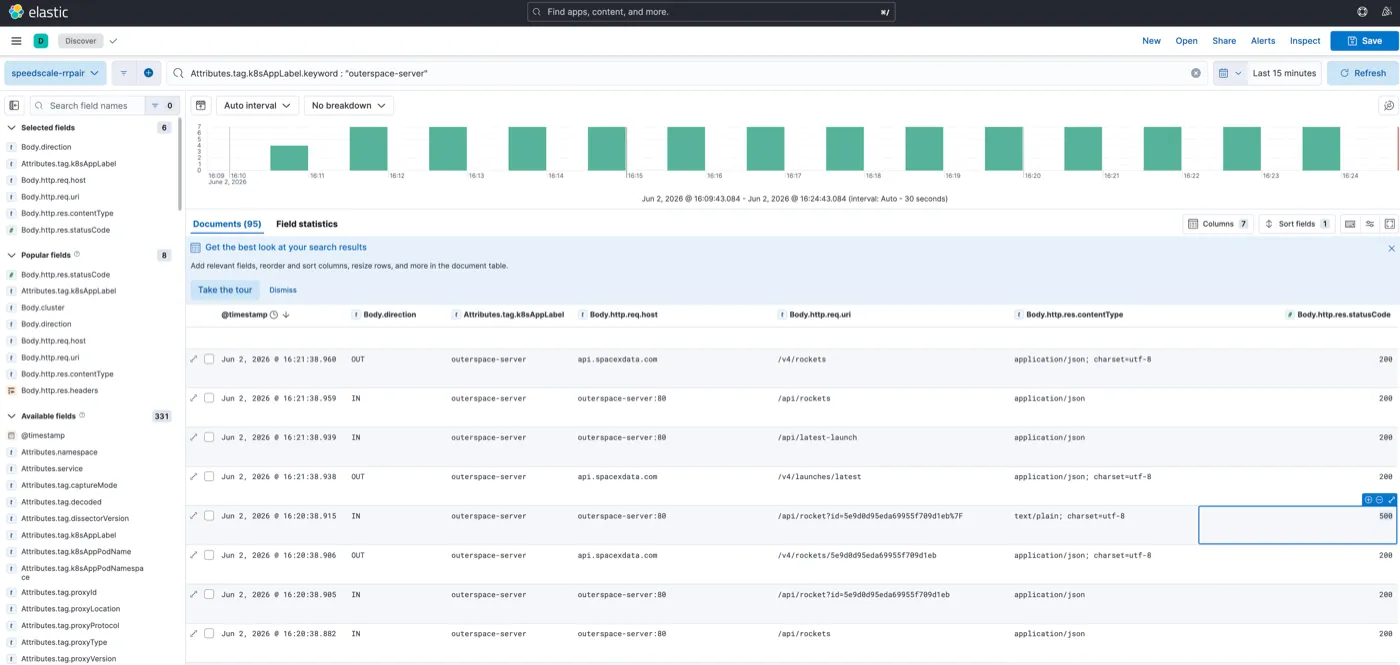
From the dashboard you can drill into Kibana Discover to see every individual request: host, status code, response content type, the raw body. You can see the 500s right in the table, timestamped, alongside all the healthy traffic.
Pulling it down locally
This is the part that makes it useful. There’s a script in the repo called es-gather.py that hits the ES API and writes a directory proxymock can read directly. You tell it which service, how far back to look, and where to write the output:
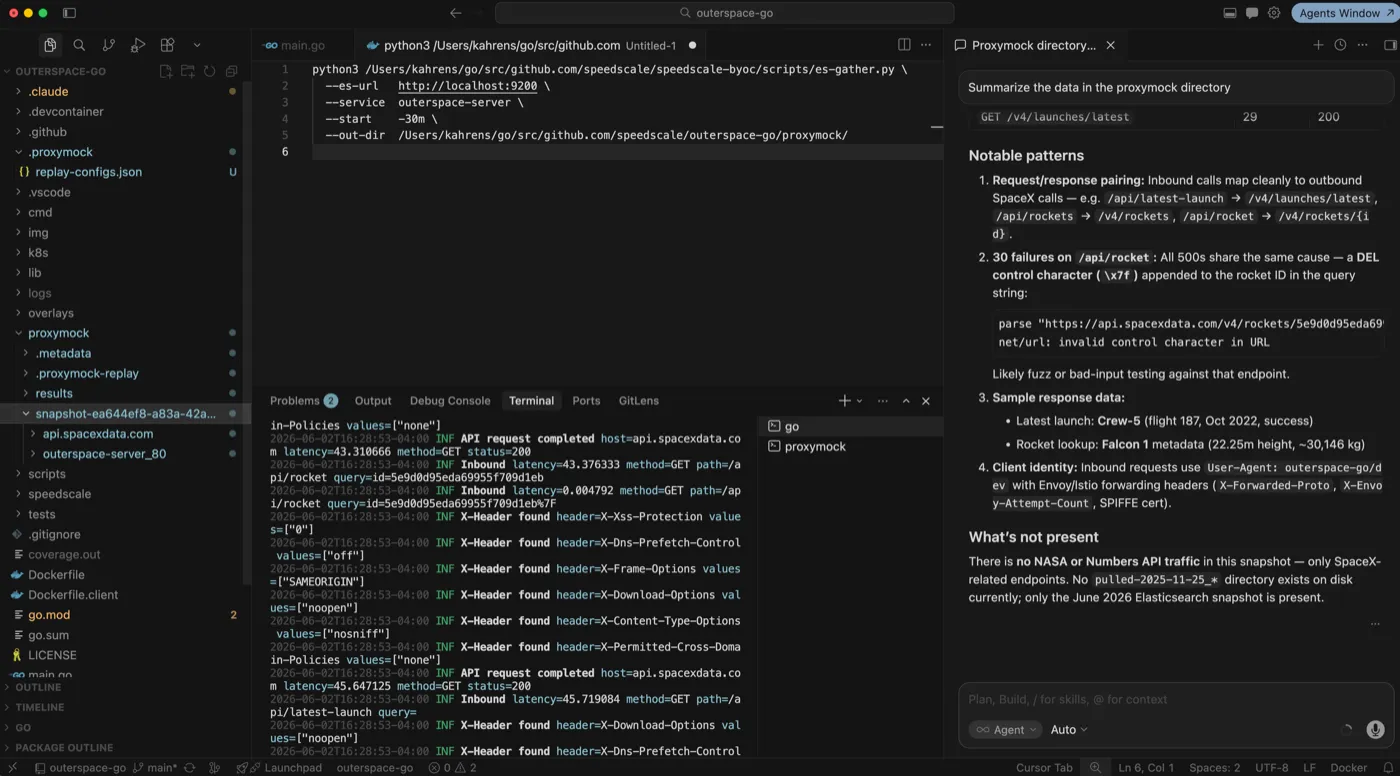
python3 scripts/es-gather.py \
  --es-url http://localhost:9200 \
  --service outerspace-server \
  --start -15m \
  --out-dir ./my-snapshot
207 requests, written locally in about a second. The data never left my VPC to get there.
At this point you can drop the snapshot directory into your IDE and ask your AI coding agent to summarize it. It can read the structured JSON, spot patterns, and flag anomalies. In my case it immediately found the problem: a DEL control character appended to the rocket ID in the query string on /api/rocket: 30 failures, same root cause.
What proxymock shows you
You can also run proxymock web --in ./my-snapshot for a visual timeline of every request. Click into any call to see the full request and response bodies, headers, latency. The control character shows up right in the payload. That’s the kind of thing that never makes it into a span or a log line.
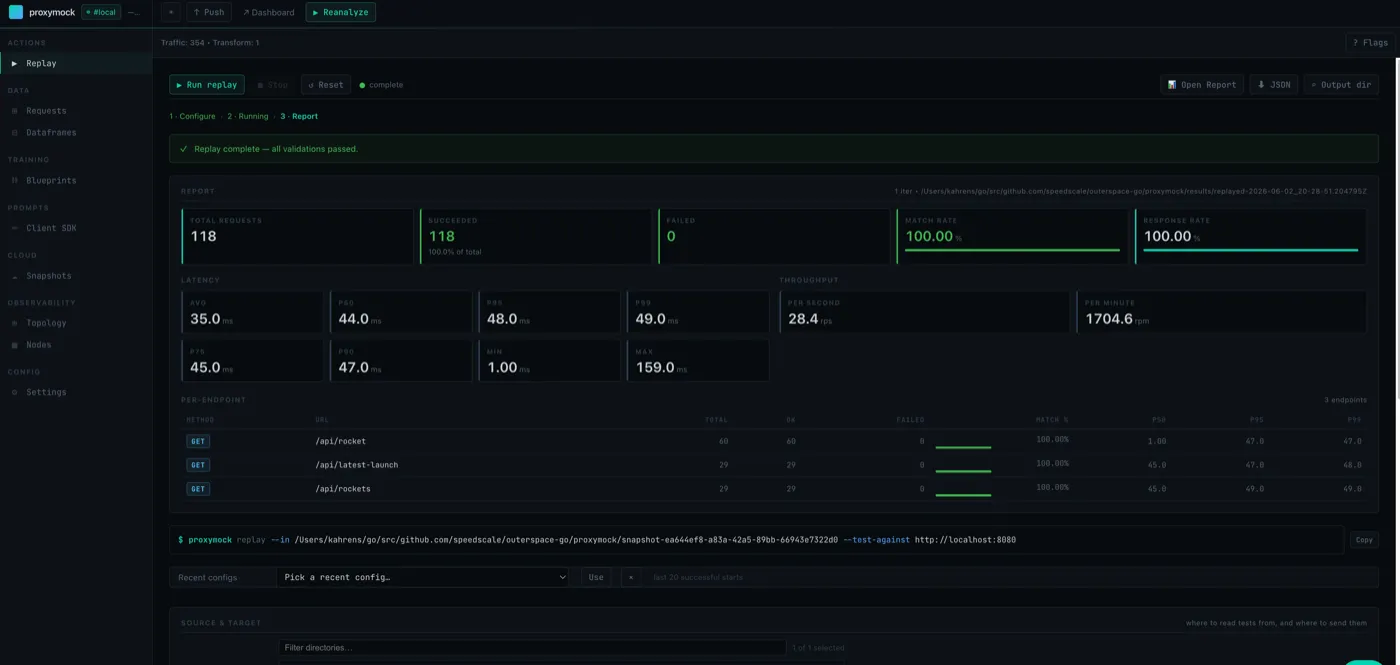
I then replayed the traffic against localhost:8080 with proxymock replay. The replay matched all 118 requests at 100%, including the ones that were erroring. Bug reproduced with the exact same production inputs.
Now I’ve got something concrete to hand to a coding agent: here’s the traffic, here’s how to reproduce it, go fix it and show me it’s fixed.
Why this matters
Logs and traces tell you something broke. Traffic tells you exactly what happened. The difference matters when you’re trying to fix something versus just knowing it’s broken.
If you’re running in an environment where data can’t leave your VPC, BYOC gives you the same debugging capability without the data moving anywhere you didn’t authorize. You can use local LLMs, your company’s approved agents. The sensitive data stays inside your four walls.
If you want to go further with this, we’ve also been building autonomous agents that run entirely on sovereign BYOC data — same principle, applied to the full AI coding loop.
Repo is at github.com/speedscale/speedscale-byoc; the Elasticsearch chart is under charts/elasticsearch/. Full docs at speedscale.com/byoc.
Questions? Jump into the Speedscale Slack and ask.