Kubernetes Load Testing Made Easy with Speedscale
Introduction
Everybody knows working with Kubernetes is really hard. It’s highly complicated. You have to know how to work with YAMLs, there’s lots of stuff to deal with.

The classic developer experience with YAML.
But what if you could get complete visibility into your Kubernetes workloads and run realistic load tests without touching a single YAML file or running kubectl commands? In this walkthrough, I’ll show you how Speedscale makes Kubernetes observability and performance testing as simple as point-and-click.
Getting Started: The Speedscale Operator
First, we have an operator. It’s a Helm chart that installs in three minutes. Once it’s installed, you get immediate visibility into your cluster. From basic operator configuration, data loss prevention rules, and most importantly, your workloads.
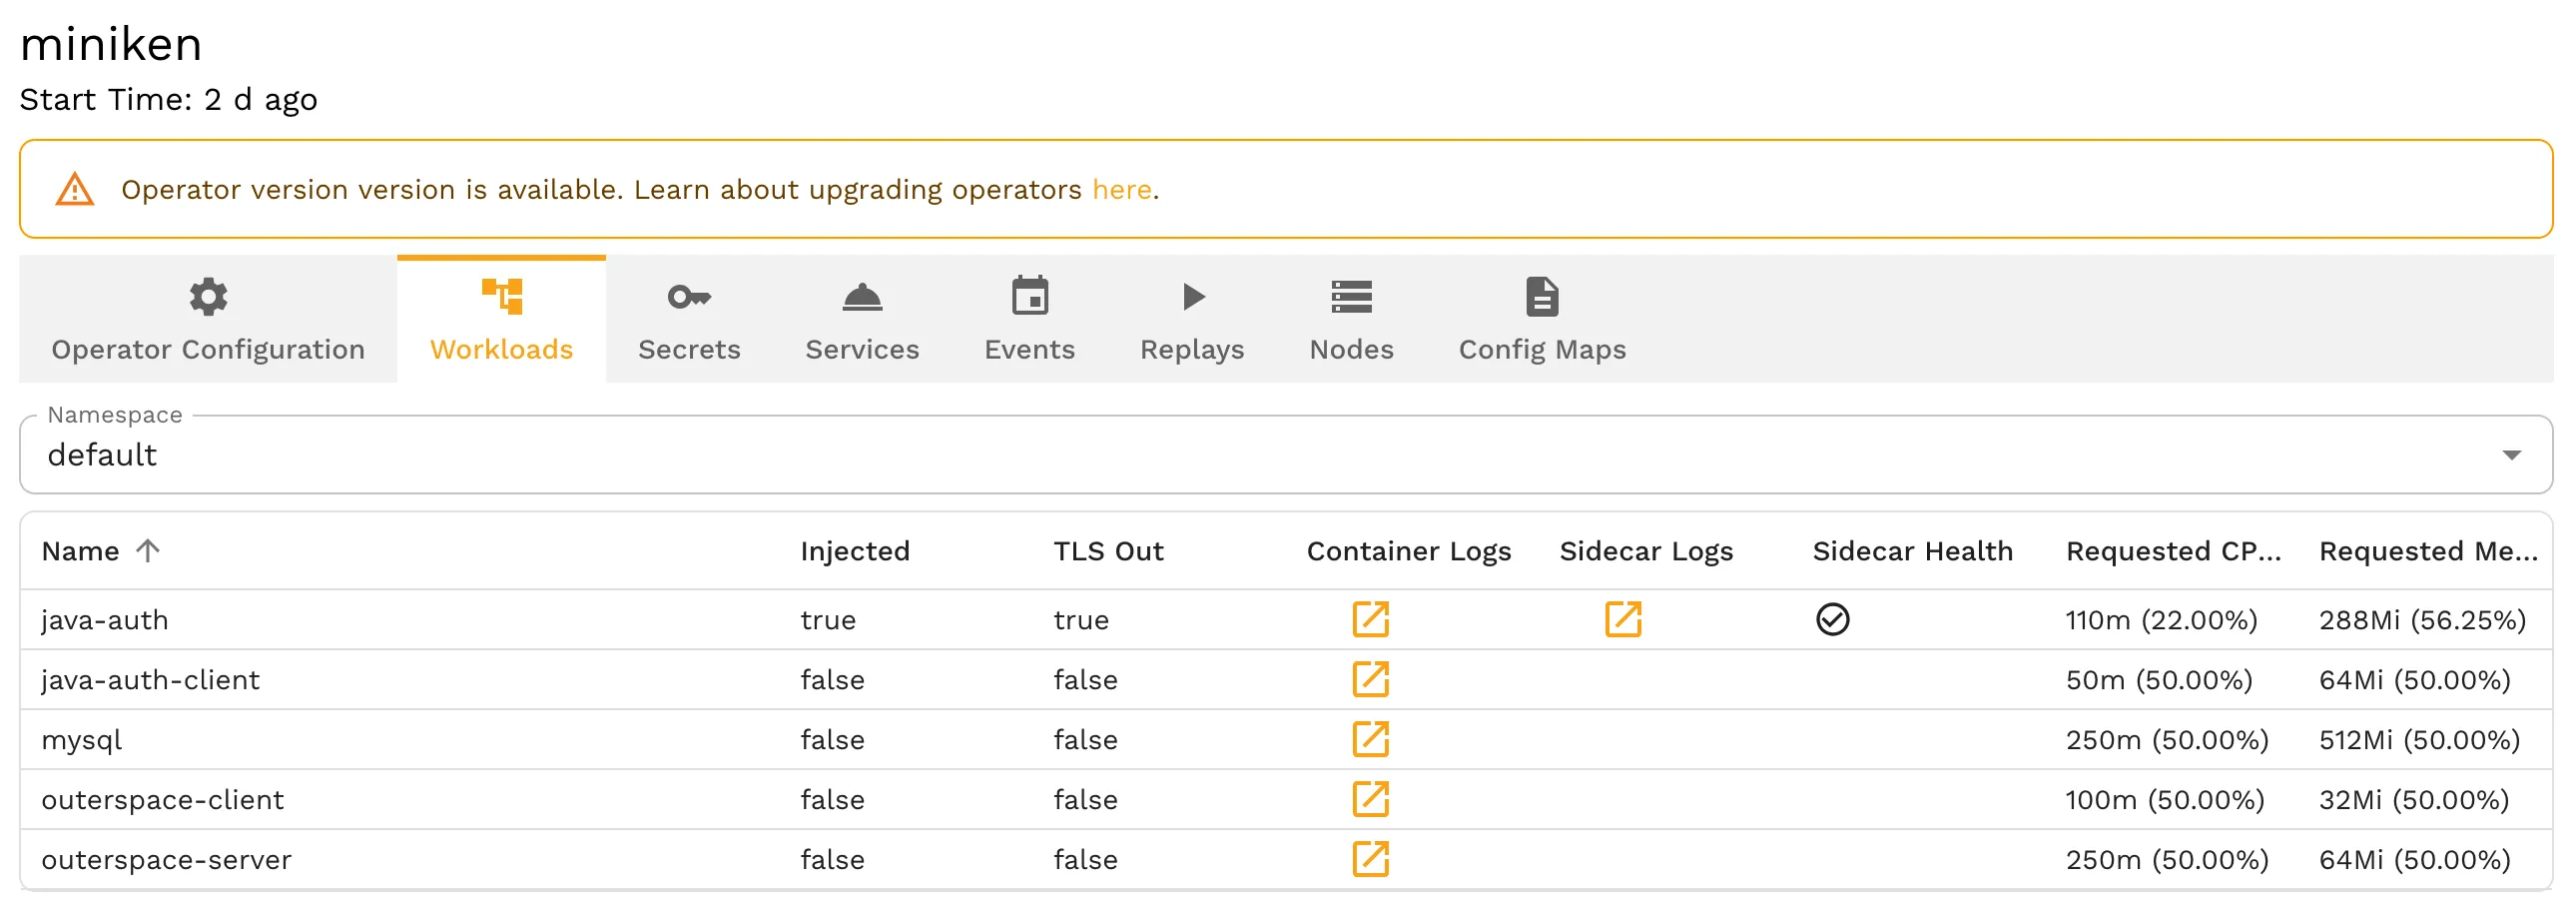
The workloads view showing your services, sidecar status, and resource usage.
For this demo, I’m using the Java Auth service. One of the demo apps we have in Speedscale’s demo repo. From here you can quickly access logs, check resource usage, and see which services have sidecars injected.
Adding the Speedscale Sidecar
You can add the Speedscale sidecar directly from the UI. No editing YAML files or pulling down manifests or logging into your cloud console.
Simply click on your workload, then select the “Enable Sidecar Injection” toggle. You can also configure your resource requests and limits, enable decrypted outbound TLS traffic, and set any language-specific options (like Java tool options). When you hit update, it automatically redeploys your application with all the appropriate settings.
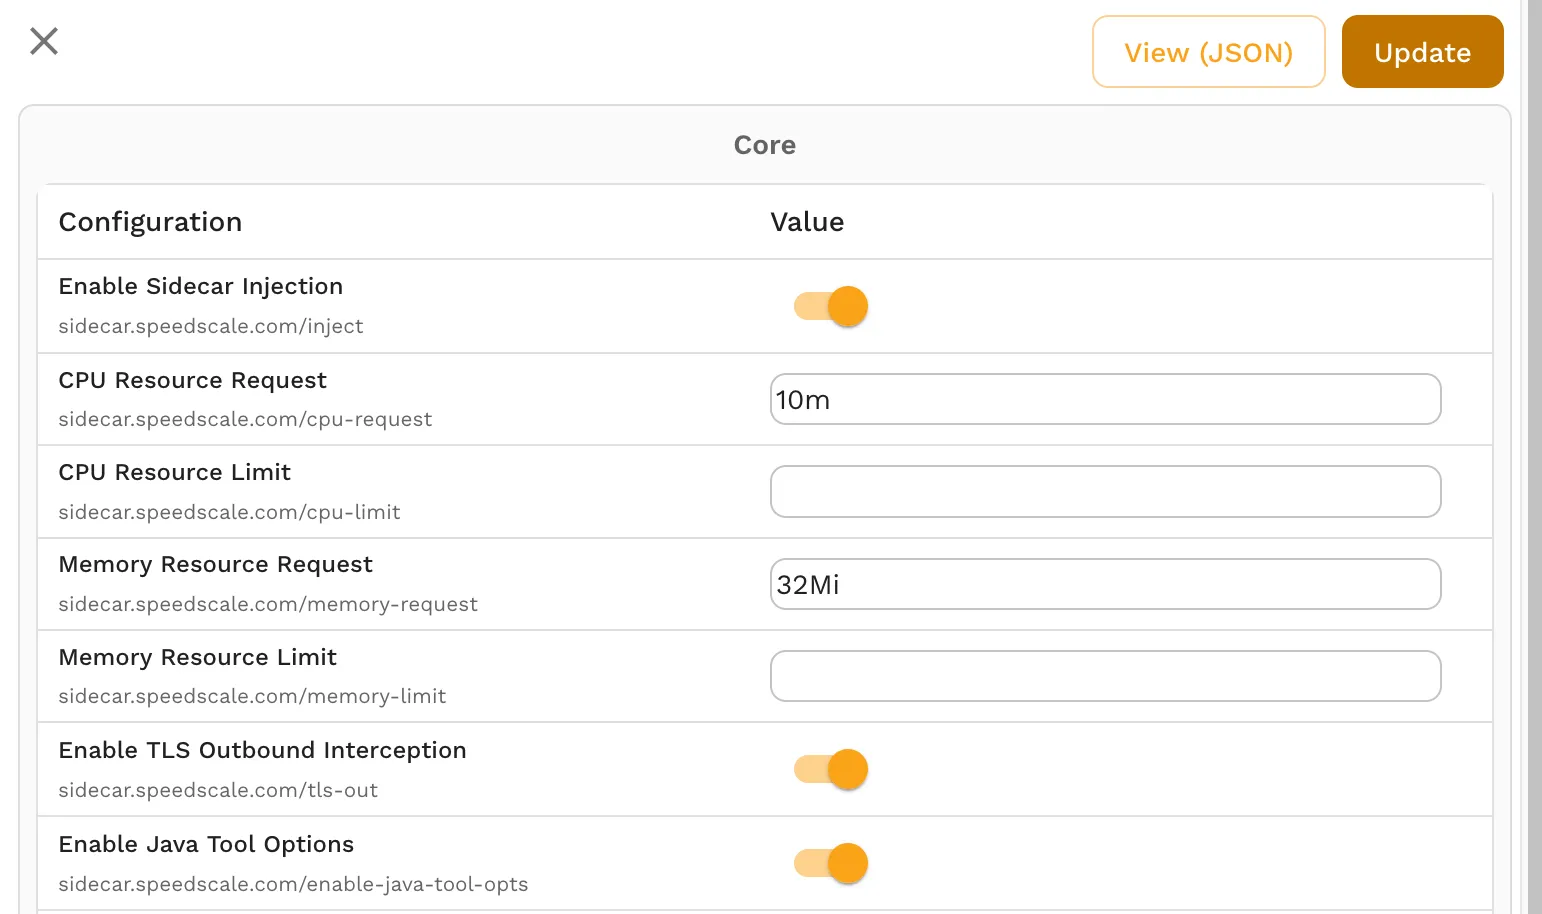
The sidecar configuration screen is point and click, no YAML required.
Inspecting Traffic
Once the sidecar is running, you can see all the traffic flowing through your application in real time. You’ll see both outbound calls (like MySQL connections during startup) and inbound API requests.
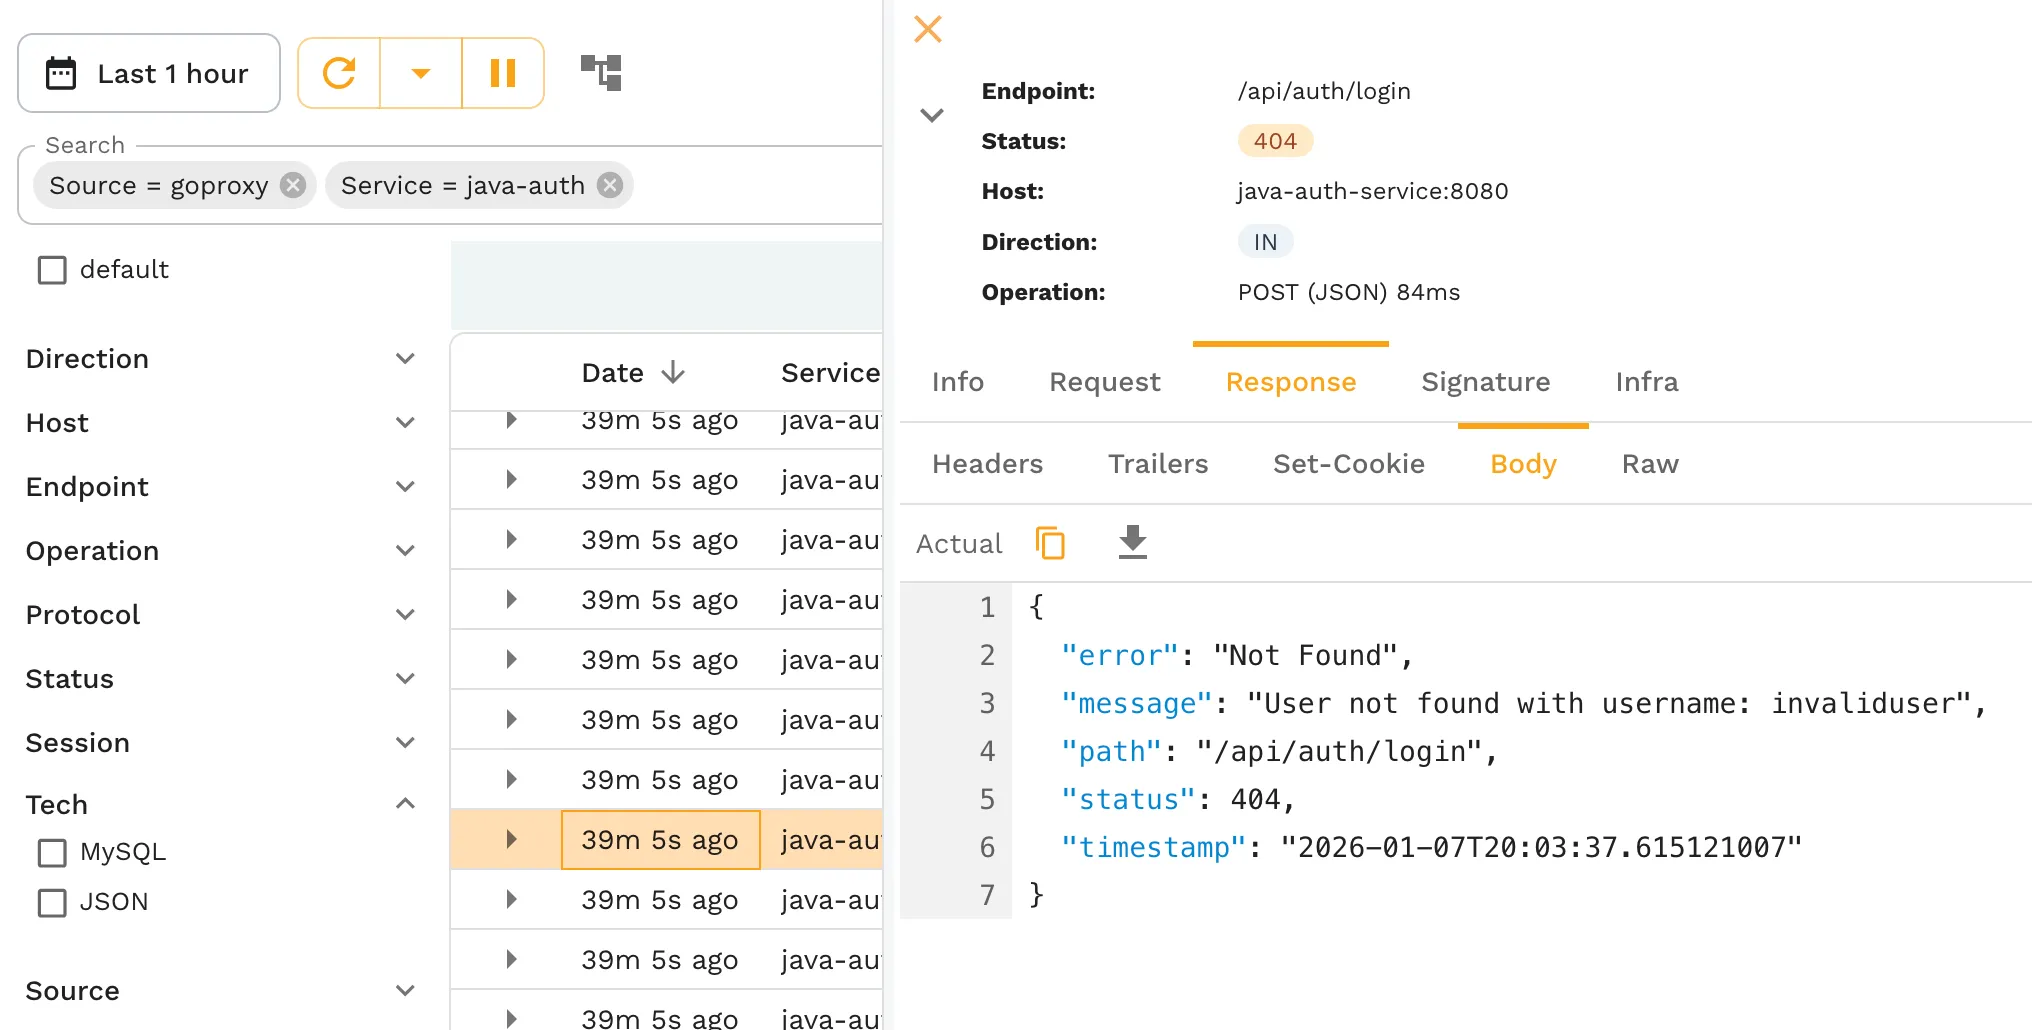
Viewing captured traffic with full request and response details.
The traffic viewer shows you everything: SQL statements and responses from databases, API endpoints with their payloads, JWT tokens decoded with algorithm details and expiration times. You can filter by direction, protocol, endpoint, status codes, and more.
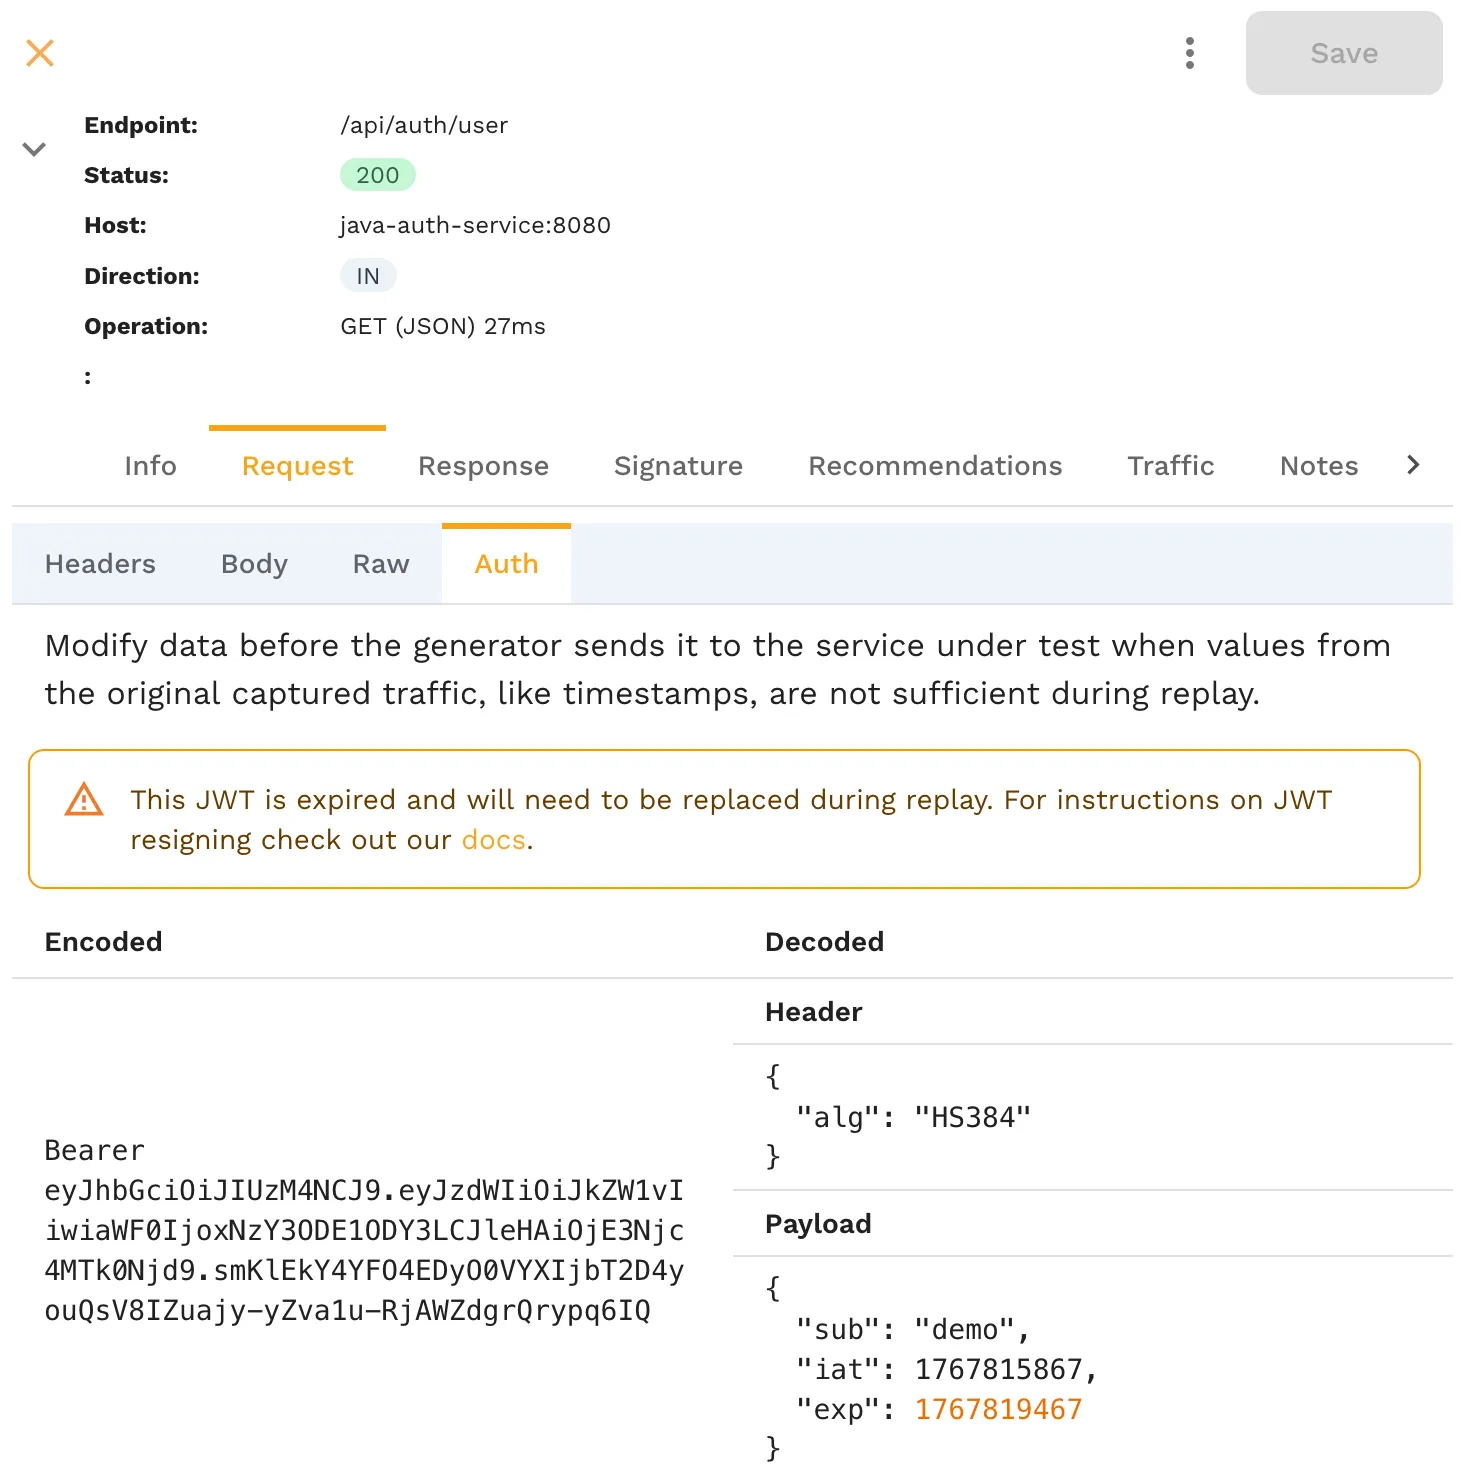
Inspecting JWT tokens with decoded claims and expiration details.
And remember, we didn’t have to run any kubectl commands. Even though I’m wearing my kubectl shirt in the video, I didn’t need any kubectl commands or YAML files to get here.
From Traffic to Load Test
Now let’s turn that captured traffic into a load test. I’ve collected just 11 calls in the last few minutes. With Speedscale, I can save this traffic and immediately see the traffic snapshot. This includes calls will be made, what status codes were returned, the full request and response bodies.
Traditional load testing is a bunch of work. Analyzing code, writing tests, figuring out how to run them inside your cluster. That’s a lot of work. But with Speedscale, there’s a replay button. Fill out a simple form: which cluster (minikube in my case), which namespace and workload, and what type of test to run.
You can run:
- A regression scenario for validation
- A performance scenario with additional traffic
- A chaos scenario with random interactions
- A custom scenario with your own parameters
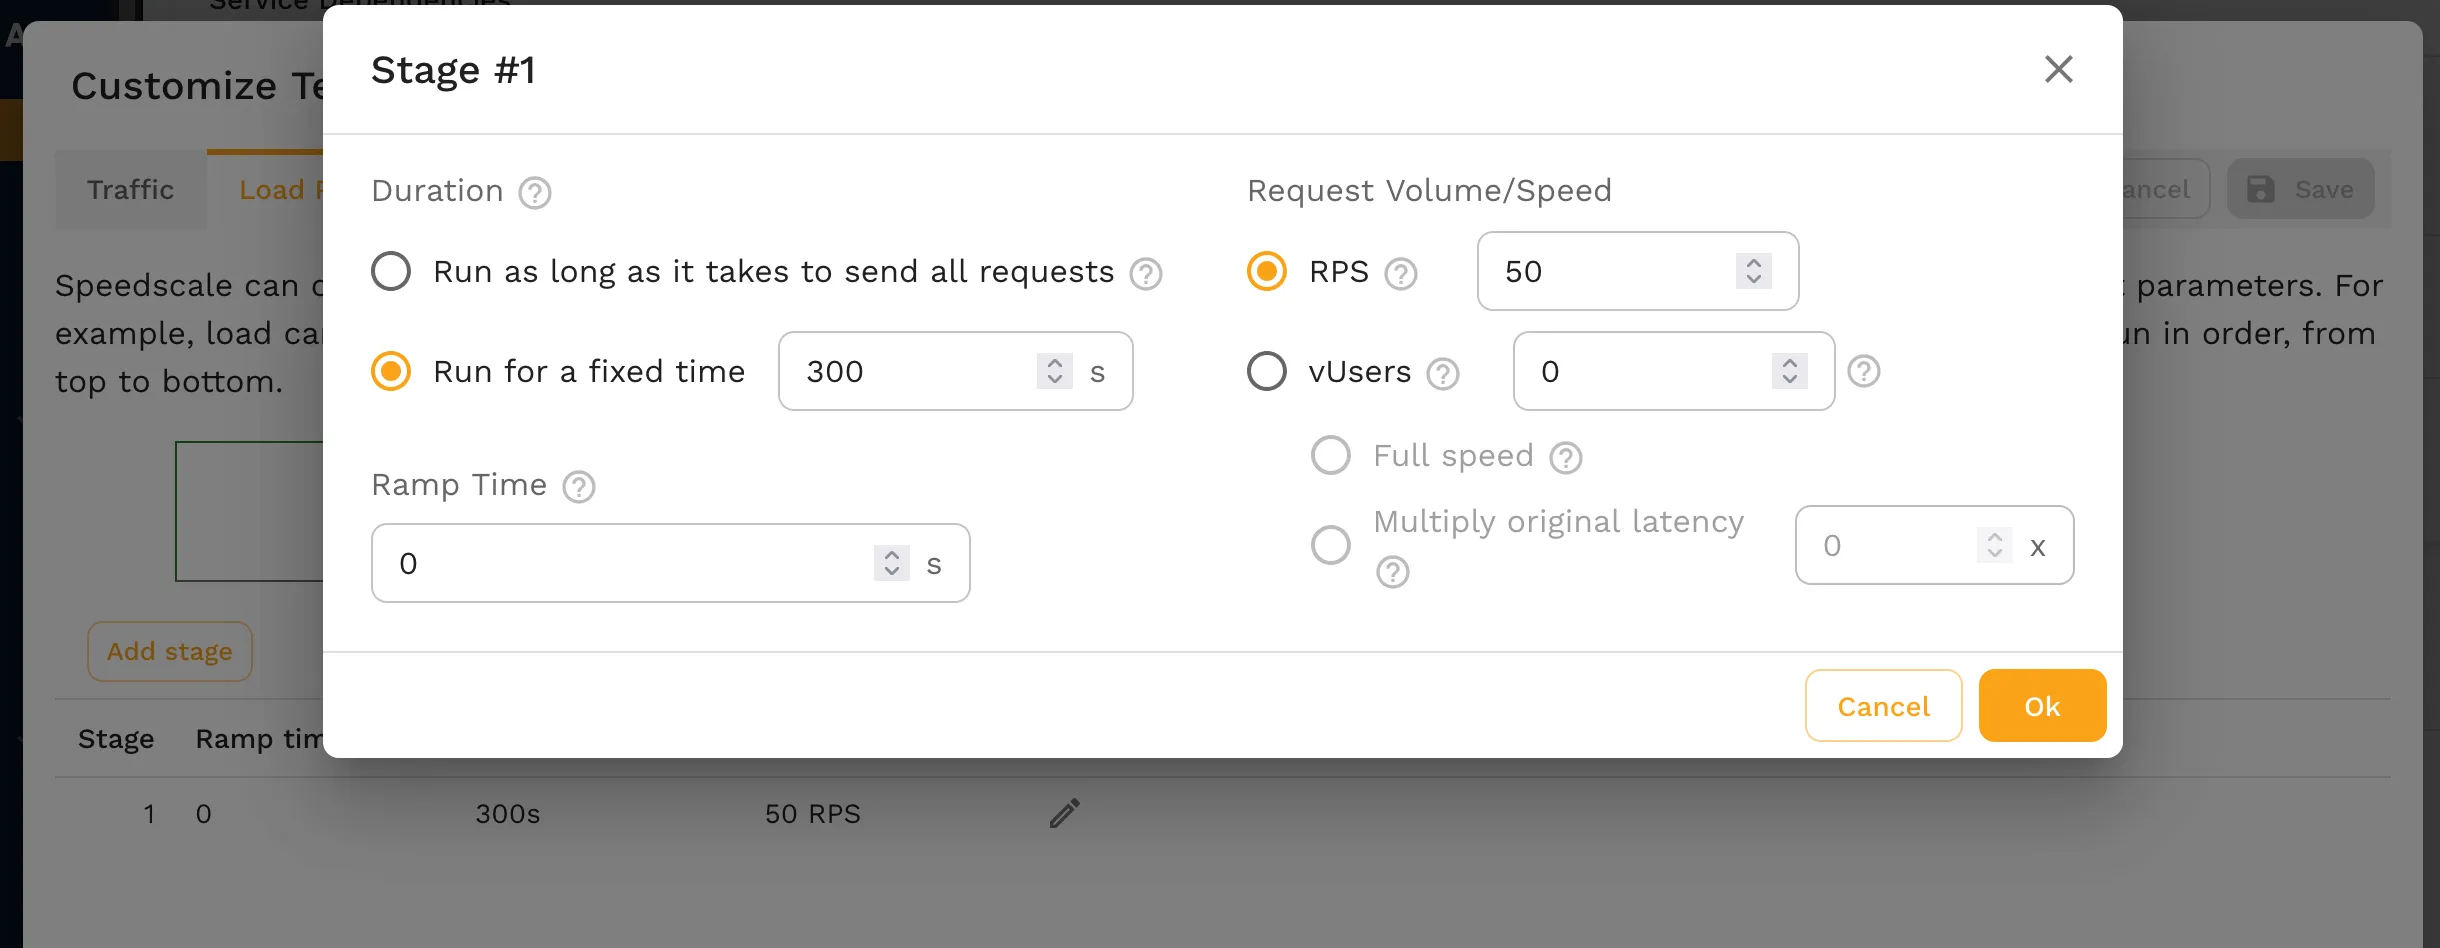
Configuring a custom load pattern with 50 requests per second.
For custom load scenarios, you can specify virtual users or target a specific throughput (like 50 calls per second).
And finally when you want to run it in the cluster, no need to worry about Kubernetes networking. No dealing with ingress controllers, routes, all that complexity. Just select your service from a list that the Kubernetes operator provides, and you’re good to go. Speedscale runs inside the cluster and calls the correct service automatically.
Watching Results in Real Time
Click start, and you’ve got a load test running. You can see the throughput by endpoint being achieved in real time. Speedscale will automatically determine how many virtual users are needed based on your application’s performance.
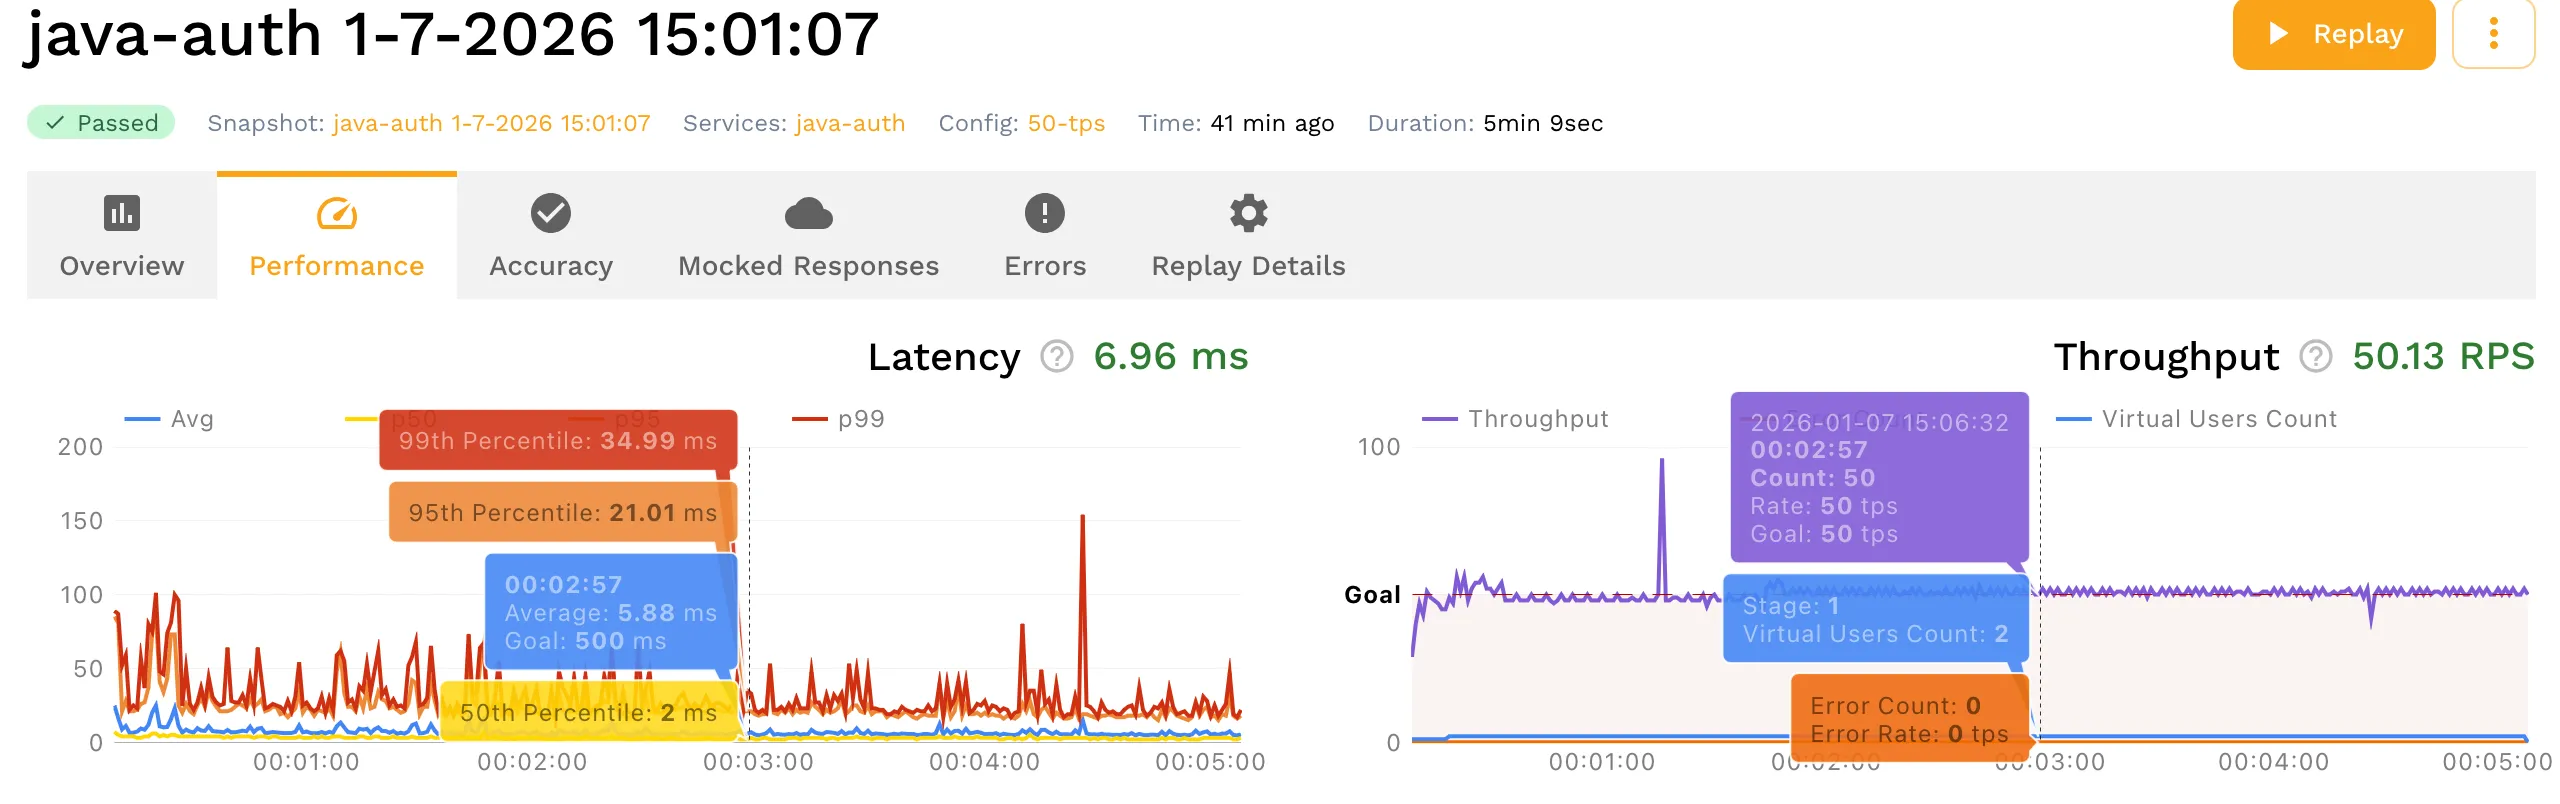
Real-time latency and throughput metrics during the load test.
That’s the complete workflow: add the sidecar, get visibility into your workloads, inspect traffic with full request/response details, and run it as a load test. Completely from the UI.
Try It Yourself
If you want to check this out, all our docs are online at docs.speedscale.com and everything I showed you is covered in this tutorial.
If you don’t have your own app to work with, check out the Speedscale demo repo on GitHub with examples in Go, Java, Node, Ruby and more.
Have questions? Join our Community Slack at slack.speedscale.com to ask questions and connect with the team.
Need help with API testing or performance optimization? Try Speedscale for free.