Isolating Bottlenecks: How to Determine If Your Slowdown Is Due to the Database or API
Every slowdown in your application can be traced to specific components like a database or an API, and quickly identifying the source aids the troubleshooting process. But when an API is underperforming, it may be difficult to tell whether the issue is with the API logic itself or an external service like a database that it interacts with before sending responses. These performance bottlenecks manifest as slowdowns and errors from your database as it handles queries or from your API as it processes requests.
Trying to fix a slowdown without first identifying and isolating the root cause increases the time spent on troubleshooting. Focusing on a root cause analysis allows you to identify what’s not operating as expected and make the necessary changes. This improves the efficiency of your troubleshooting process, reducing the impact of latency on your end users.
In this article, you’ll learn more about performance bottlenecks and see some examples of common performance bottlenecks encountered in databases and APIs. You’ll also learn about independent performance testing methods and how Speedscale helps you pinpoint performance bottlenecks accurately.
Blog Post: A Developer’s Guide to Continuous Performance Testing
Understanding Performance Bottlenecks
Performance bottlenecks occur when a part of your system, like the database or API, is not operating optimally. This leads to increased errors when making requests or longer response times that negatively affect the user experience.
Some common examples of performance bottlenecks in databases and APIs include:
- Databases:
- Slow queries because of improper indexing, which results in your database performing a full table scan to find the rows of interest for each query
- Hardware limitations in terms of factors like CPU speed, disk input/output speed, and memory, which make the database operate suboptimally
- Delayed query execution as a result of lock contention when multiple queries try to interact with the same data simultaneously (for instance, to update them) without techniques like row-level locking in place
- Ineffective and complicated data manipulation, retrieval, and storage because of poorly designed database schemas and models
- APIs:
- Inefficient implementation of logic and algorithms that result in longer processing times and a poorer user experience
- Uneven load distribution across servers in a system, with some being underutilized and others performing suboptimally
- High network latency as a result of data transfer across long distances, which causes slow response times
- Memory leakage that results in reduced available memory over time and hinders the ability of the API server to execute an expected number of requests
- Insufficient network bandwidth that limits the amount of transferable data
- Higher response times because inadequate RAM speed and memory hinder the API from executing queries and required computations
You can detect bottlenecks by monitoring metrics like the average response time of an API, the error rate of requests made to an API, database memory usage, and the throughput of a database or an API. When abnormal values are identified, they signify a performance problem with the database or API that can be solved to improve overall system efficiency.
Integrated vs. Independent Performance Testing Methods
Independent (isolated) performance testing methods are typically very efficient at helping you understand the capabilities and performance of individual components like your APIs and databases. Independent performance testing may involve subjecting your database or API to load, stress, and scalability tests. These tests help answer important questions, such as how your APIs respond to the expected load, at what point your API stops being able to process new requests, and how your database reacts to an increased or decreased number of queries. The answers to questions like these help you detect bottlenecks in your database or API, better allocate resources, and further optimize your operations.
On the other hand, integrated testing strategies evaluate your application as a whole, helping you identify and solve problems that arise from the interaction between the components in your system as they share data or other resources. Relying on integrated testing alone makes isolating the source of an observed problem more tedious because the interacting components in the system introduce additional complexity that wouldn’t exist if the components were being tested independently. Testing all the possible interactions between parts of a complex system can also be difficult, resulting in incomplete testing and problems that may not be obvious until the application is live.
Independent performance testing complements integrated testing efforts by focusing on individual components in a system like a database or an API and rigorously testing them to understand how they perform under varying conditions. These tests help you understand the state of your database or API and identify performance bottlenecks where they exist.
How Can Speedscale Help with Pinpointing Performance Bottlenecks Accurately?
Speedscale provides a reliable way to test and deliver applications by simulating high traffic volumes that can then be used for your different testing scenarios.
Speedscale helps you pinpoint performance bottlenecks by first capturing actual traffic from your users in a late-stage environment, like the user acceptability testing, staging, or production environment. This recorded traffic can then be analyzed to explore the requests made to and responses received from the various parts of your system. You can also filter and examine subsets of the traffic data to understand how individual APIs performed. This helps you isolate bottlenecks and move on to fixing issues. In addition, Speedscale allows you to replay recorded traffic to confirm that your fixes work. For more extensive testing, you can duplicate the traffic and modify it to run various independent performance tests. Databases and third-party services can also be mocked while doing this, so you can identify whether faults are due to the API logic itself or those services. These Speedscale features help you isolate performance bottlenecks in your databases and APIs efficiently and accurately without needing to string together different tools for each step.
Some benefits of using Speedscale for performance testing in development environments include:
- Saving time spent creating manual test scripts for your database or API using recorded traffic
- Improved database or API testing accuracy; Speedscale uses actual traffic while testing, allowing you to solve real issues before they impact your users
- Saving time and resources spent in setting up costly test servers using sophisticated mocks of third-party systems, internal backends, and databases while maintaining reliability as you test your APIs
- Easy inclusion of chaos variables that help you test the resilience of your APIs; these variables include random high latencies and bad status codes from third-party applications that allow you to test your database or API’s integrity
- Smooth integration with your existing continuous integration and continuous development (CI/CD) providers so you can add database and API performance testing to your workflow and understand how code changes impact metrics like latency and peak transactions per second before they impact your users
Speedscale provides all these benefits while allowing you to respect personally identifiable information and sensitive data by redacting it before it leaves your network and becomes available to Speedscale.
A Practical Scenario for Using Speedscale to Pinpoint a Performance Bottleneck
Let’s take a closer look at how you could use Speedscale to pinpoint a performance bottleneck. Consider a scenario where you provide an API that gives users access to time series data related to financial transactions from a MySQL database. However, they recently complained that during peak trading hours, the API is slower. You now need to determine whether the problem is due to performance issues with the database or with the API. You can use Speedscale CLI to mock the MySQL database and simulate high traffic volumes to determine the source of the performance bottleneck. If you don’t already have a Speedscale account, you can sign up for a free trial.
The first step involves running the command below to capture the traffic from your API:
bash speedctl install
In this scenario, your API is running in a Docker container. Select the `Docker` option as your infrastructure, pick the `Capture traffic and forward to Speedscale Cloud` option as what you want to do, name your service, and specify the port your API is listening on locally as `8080`. Speedscale then tells you to set some defined environmental variables for your HTTP and HTTPS proxy. Speedscale also automatically generates a Docker Compose file that can be run like this:
bash docker compose —file speedscale-docker-capture.yaml up -d
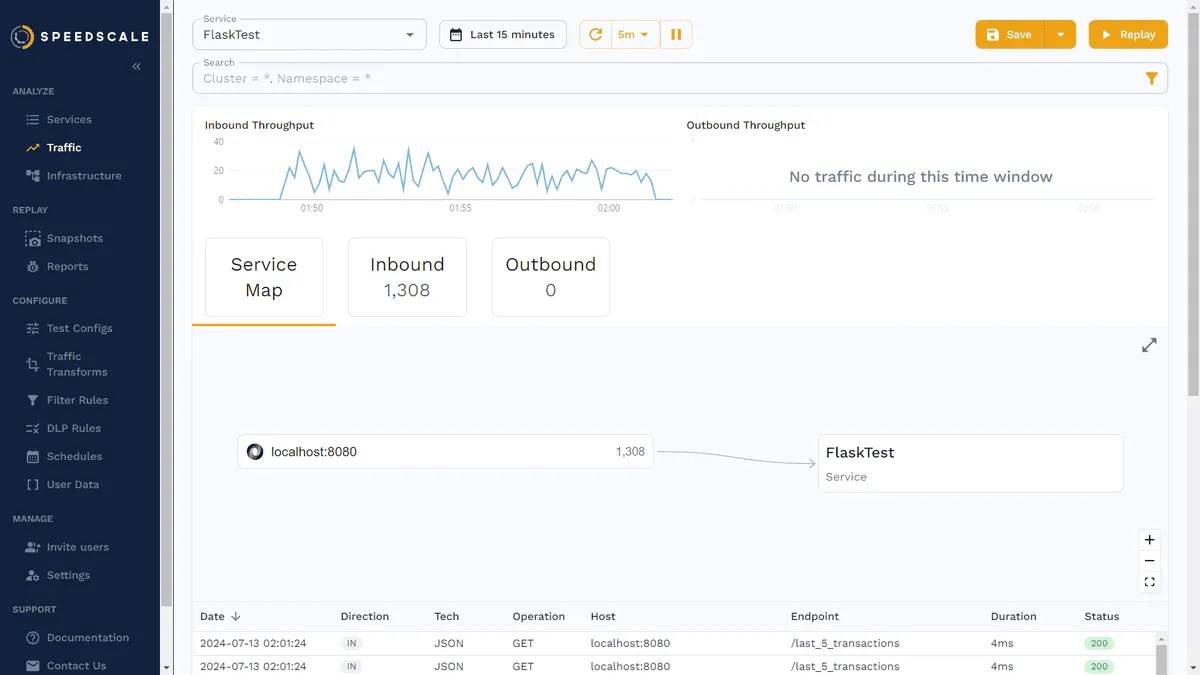
This starts up the containers that help you capture traffic and send it to Speedscale Cloud. At this point, you can interact with your API through the port provided by Speedscale, which also reports the traffic on the cloud, where it can be analyzed. You can review the requests and responses for each endpoint:

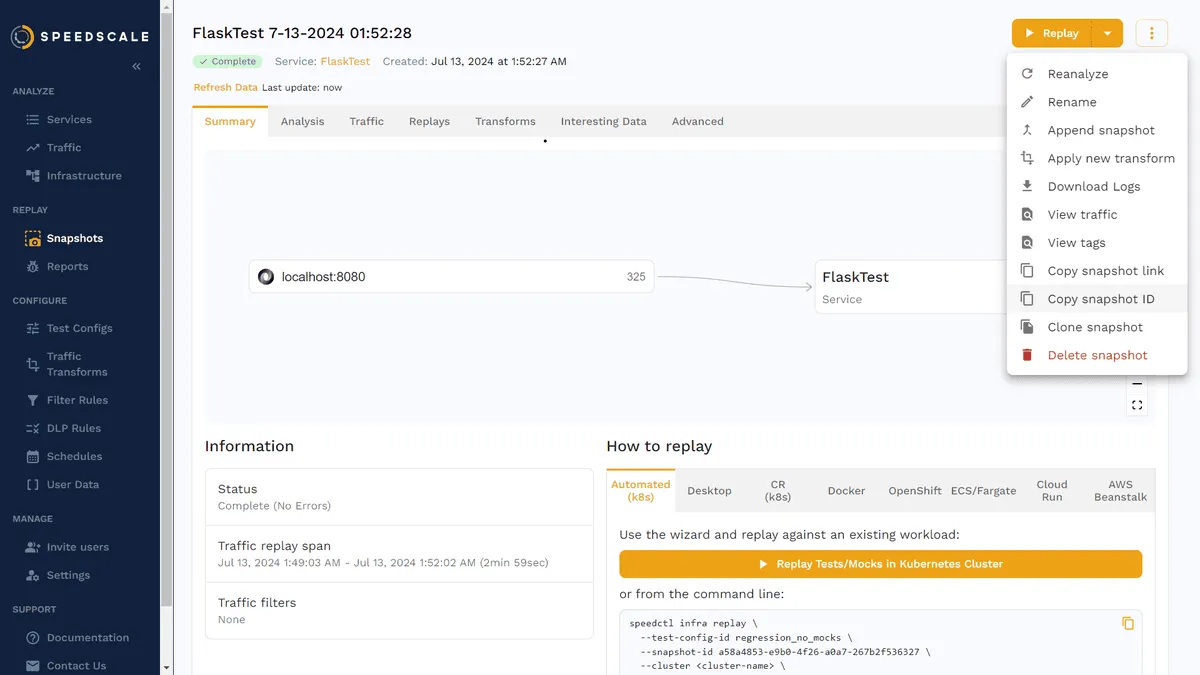
With the traffic capture process set up, you can create a snapshot of your traffic by selecting a time range on the Traffic page and clicking the **Save** button. This creates an item in the Snapshots window that you can open to copy the snapshot ID:

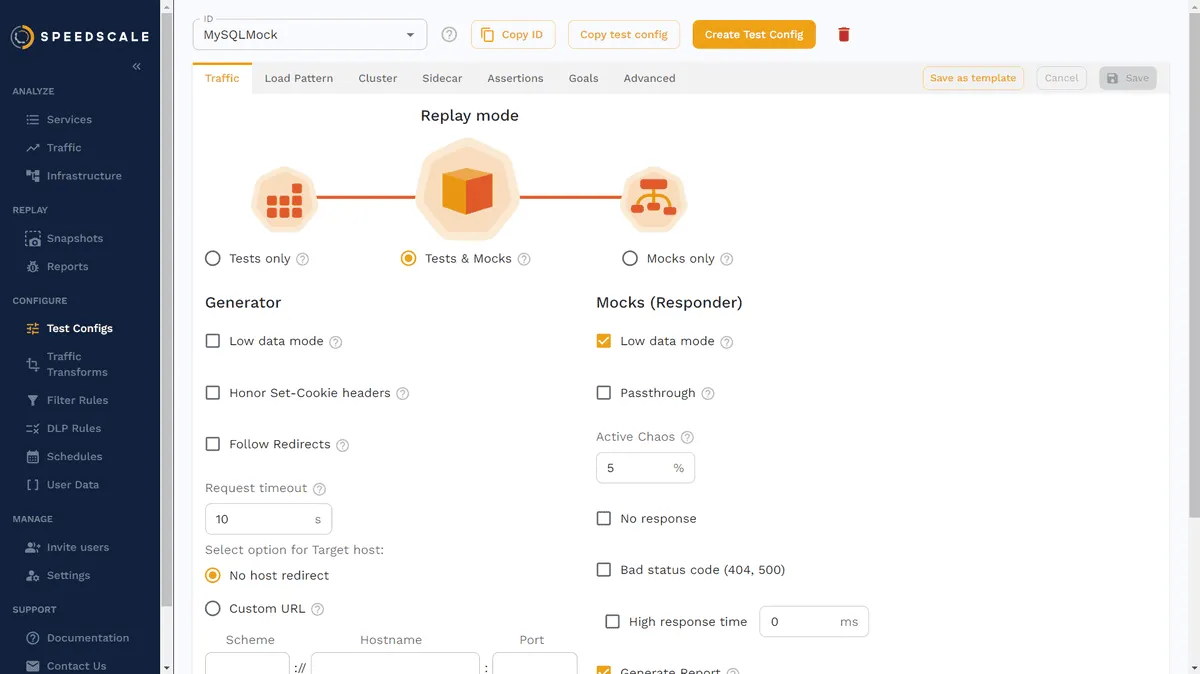
Following this, you can configure a test via the Speedscale app to replay your traffic snapshot, simulate high traffic volumes, and mock the database. This is also where the load pattern is defined with other configurations relevant to your test, like response validations and threshold conditions. Below is a screenshot of the Traffic tab in the Test Configs window:

Next, you can use this configuration in a new terminal by running `speedctl install` again. You can answer the first two questions in your terminal by selecting `Docker` as the infrastructure you’re running on and picking the `Create a Speedscale Responder to mimic an external endpoint locally` option when asked what you’d like to do. You can answer the other questions in your terminal by providing your Speedscale service, your test configuration, and the ID of the snapshot made from your captured traffic.
With this done, Speedscale automatically generates another Docker Compose file. You can turn down the earlier created containers and run the new Docker Compose file for testing and replay with the commands below:
bash docker compose —file speedscale-docker-capture.yaml down & docker compose —file speedscale-docker-respond.yaml up -d
Finally, you can return to the Speedscale app and go to the Reports window, where you’ll see your replay running and some displayed metrics. You can review these metrics when the replay is done to identify bottlenecks. If necessary, you can modify your test configuration or adapt an existing Speedscale test configuration to evaluate your API further.
With this done, you’d have used Speedscale to capture actual traffic, configure a test, and mock a database without the need for manual scripting or creating a fictional scenario. Speedscale makes your testing process faster, more accurate, and more efficient.
Conclusion
In this article, you learned about performance bottlenecks in databases and APIs, as well as the benefits of isolating them for efficient troubleshooting and maintaining system efficiency. You learned about some common performance bottlenecks encountered in databases and APIs. You also learned about independent (isolated) performance testing methods with mocks and why they are efficient and necessary for a well-rounded testing process. In addition, you were introduced to Speedscale and its working principles and benefits by going over a practical scenario where it mocked a MySQL database to help you identify bottlenecks in a financial transaction API.
Speedscale is a real-world traffic replication and testing tool that helps you pinpoint performance bottlenecks in your application. It focuses on doing this accurately by observing, analyzing, and replaying user-generated traffic for testing, making even complex testing processes cheaper, quicker, and less tedious for your engineers. With Speedscale, you can better understand your application performance, simulate production conditions, and be sure that your code changes will not break in production. Try out Speedscale today to revolutionize how testing is done in your organization.