Replay Real Customer API Sessions as Datadog Synthetics Tests
A customer pings support: “I tried to check out twice this morning and got a 500 each time, but it works fine for everyone else.” The session ID is in the email. You have full request/response capture in your environment, you have Datadog Synthetics already running browser checks against the same flow, and you still spend the next two hours grepping logs because none of those tools let you say “show me just this user’s requests, in order, and re-run them.”
That last step is the gap: replaying one customer’s exact traffic scenario as a real test. This post walks through how to close it with proxymock export datadog-synthetics --publish, which ships in the latest proxymock release.
Why a session ID is the right lens
When a single customer reports an intermittent failure, the useful unit of work is not “the checkout endpoint” or “all 500s in the last hour.” It is the exact sequence of API calls that customer’s browser made, in the order they happened, with the bodies they sent.
That sequence is hiding inside the larger pile of recorded traffic. To pull it out you need a stable correlation key that:
- is present on every request the user makes within a session,
- you control (so it survives a load balancer, a cookie reset, or a proxy hop), and
- does not collide with other users’ requests over the same window.
In practice that key is almost always one of:
- a
X-Session-ID(orX-Trace-Id,X-Request-ID) header set by your gateway or front-end, - a sticky cookie like
sessionid=…that your auth layer mints, - a
suborsidclaim baked into a JWT inAuthorization: Bearer …, or - a tenant-scoped query parameter (
?session=abc123) when the front-end is older.
If you have any one of these, you have everything you need to reduce a noisy capture to a single user’s story.
The workflow
flowchart LR
    A["Recorded traffic<br/>snapshot-UUID"] -->|filter and export| B["proxymock export<br/>datadog-synthetics<br/>--filter ... --publish"]
    B --> C["Datadog Synthetics<br/>multistep test"]
    B --> D["View and Run links"]
Three steps: capture, filter-and-export, run. Datadog gives you recorders for building Synthetics tests, but those are meant for an engineer to walk through the product, not as an always-on mirror of production. You cannot leave them running to faithfully replicate real users; you get whatever sequence you remembered to click through, which often misses retries, ordering quirks, and payloads that only show up when a customer is actually stuck. Exporting from proxymock closes that gap: you feed Synthetics real customer traffic from your capture pipeline instead of approximating it with a self-recorded tour.
Find the traffic scenario
Before you can export, you need to know which session to isolate. There are two ways to find it.
Option A: Speedscale Cloud traffic viewer
If you are running the Speedscale operator in Kubernetes, your traffic is already flowing into the Speedscale Cloud traffic viewer. Filter by any header value (email, session token, tenant ID) directly in the UI:
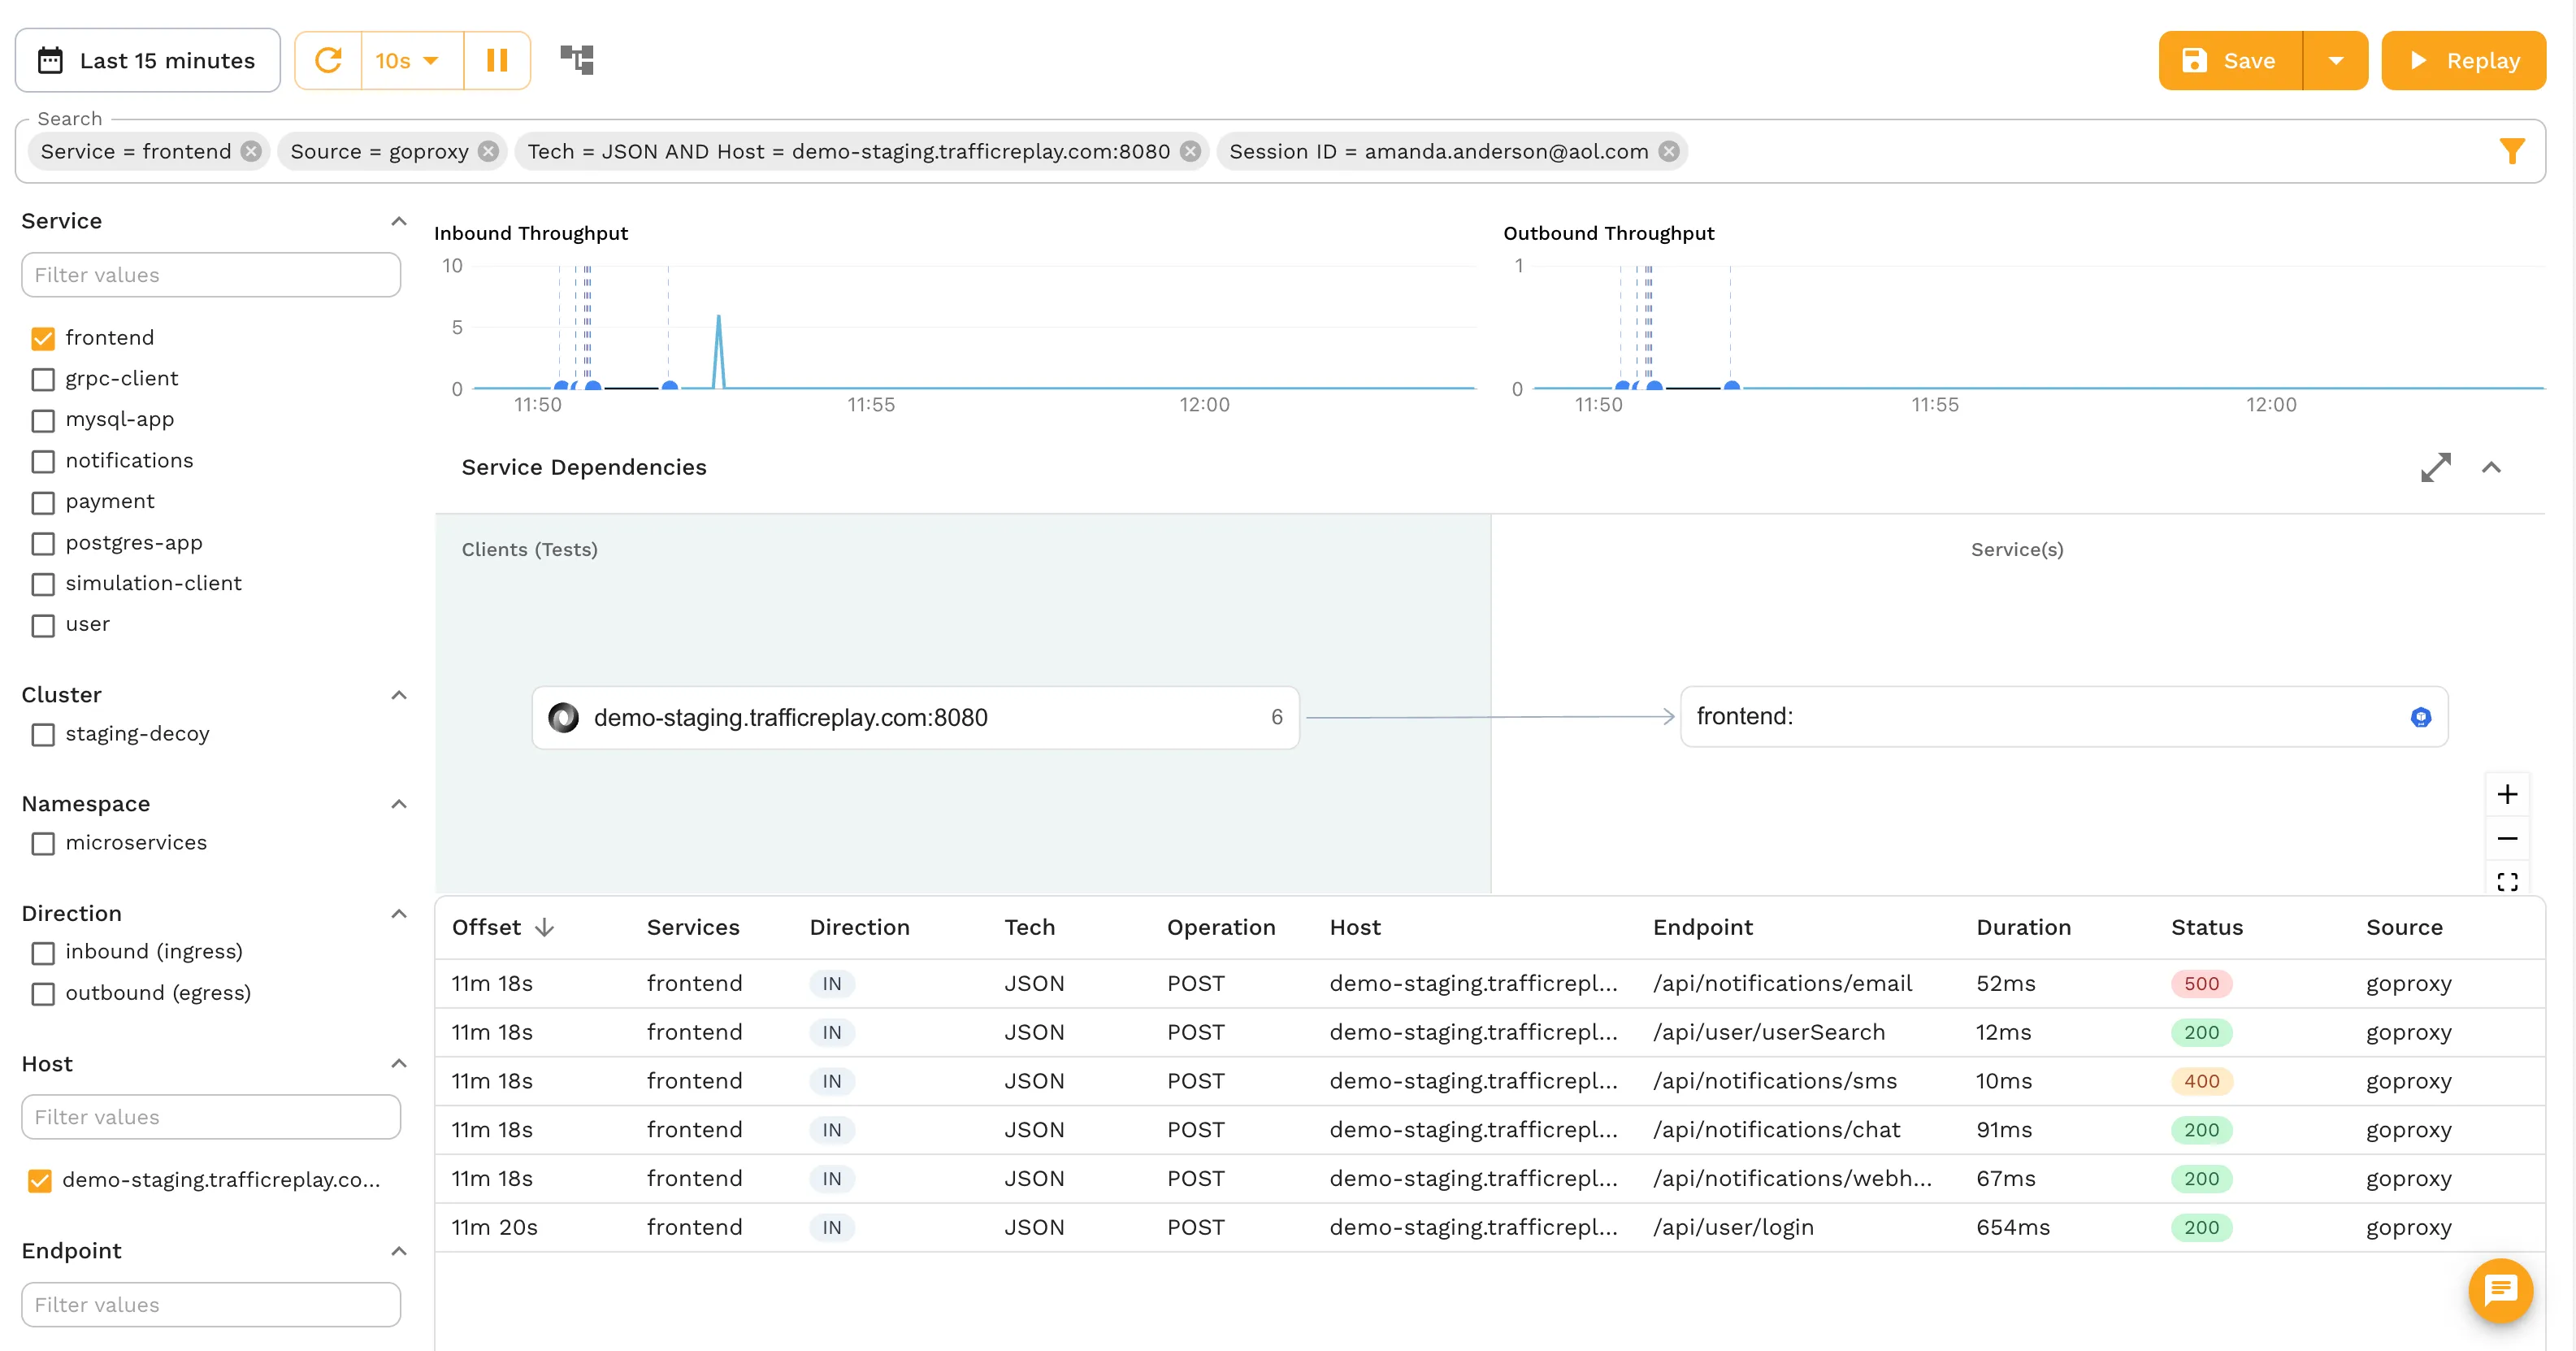
Once you can see the exact requests in the viewer, note the filter criteria. The same expression, (header[X-Session-ID] IS "amanda.anderson@aol.com"), drops directly into the proxymock CLI.
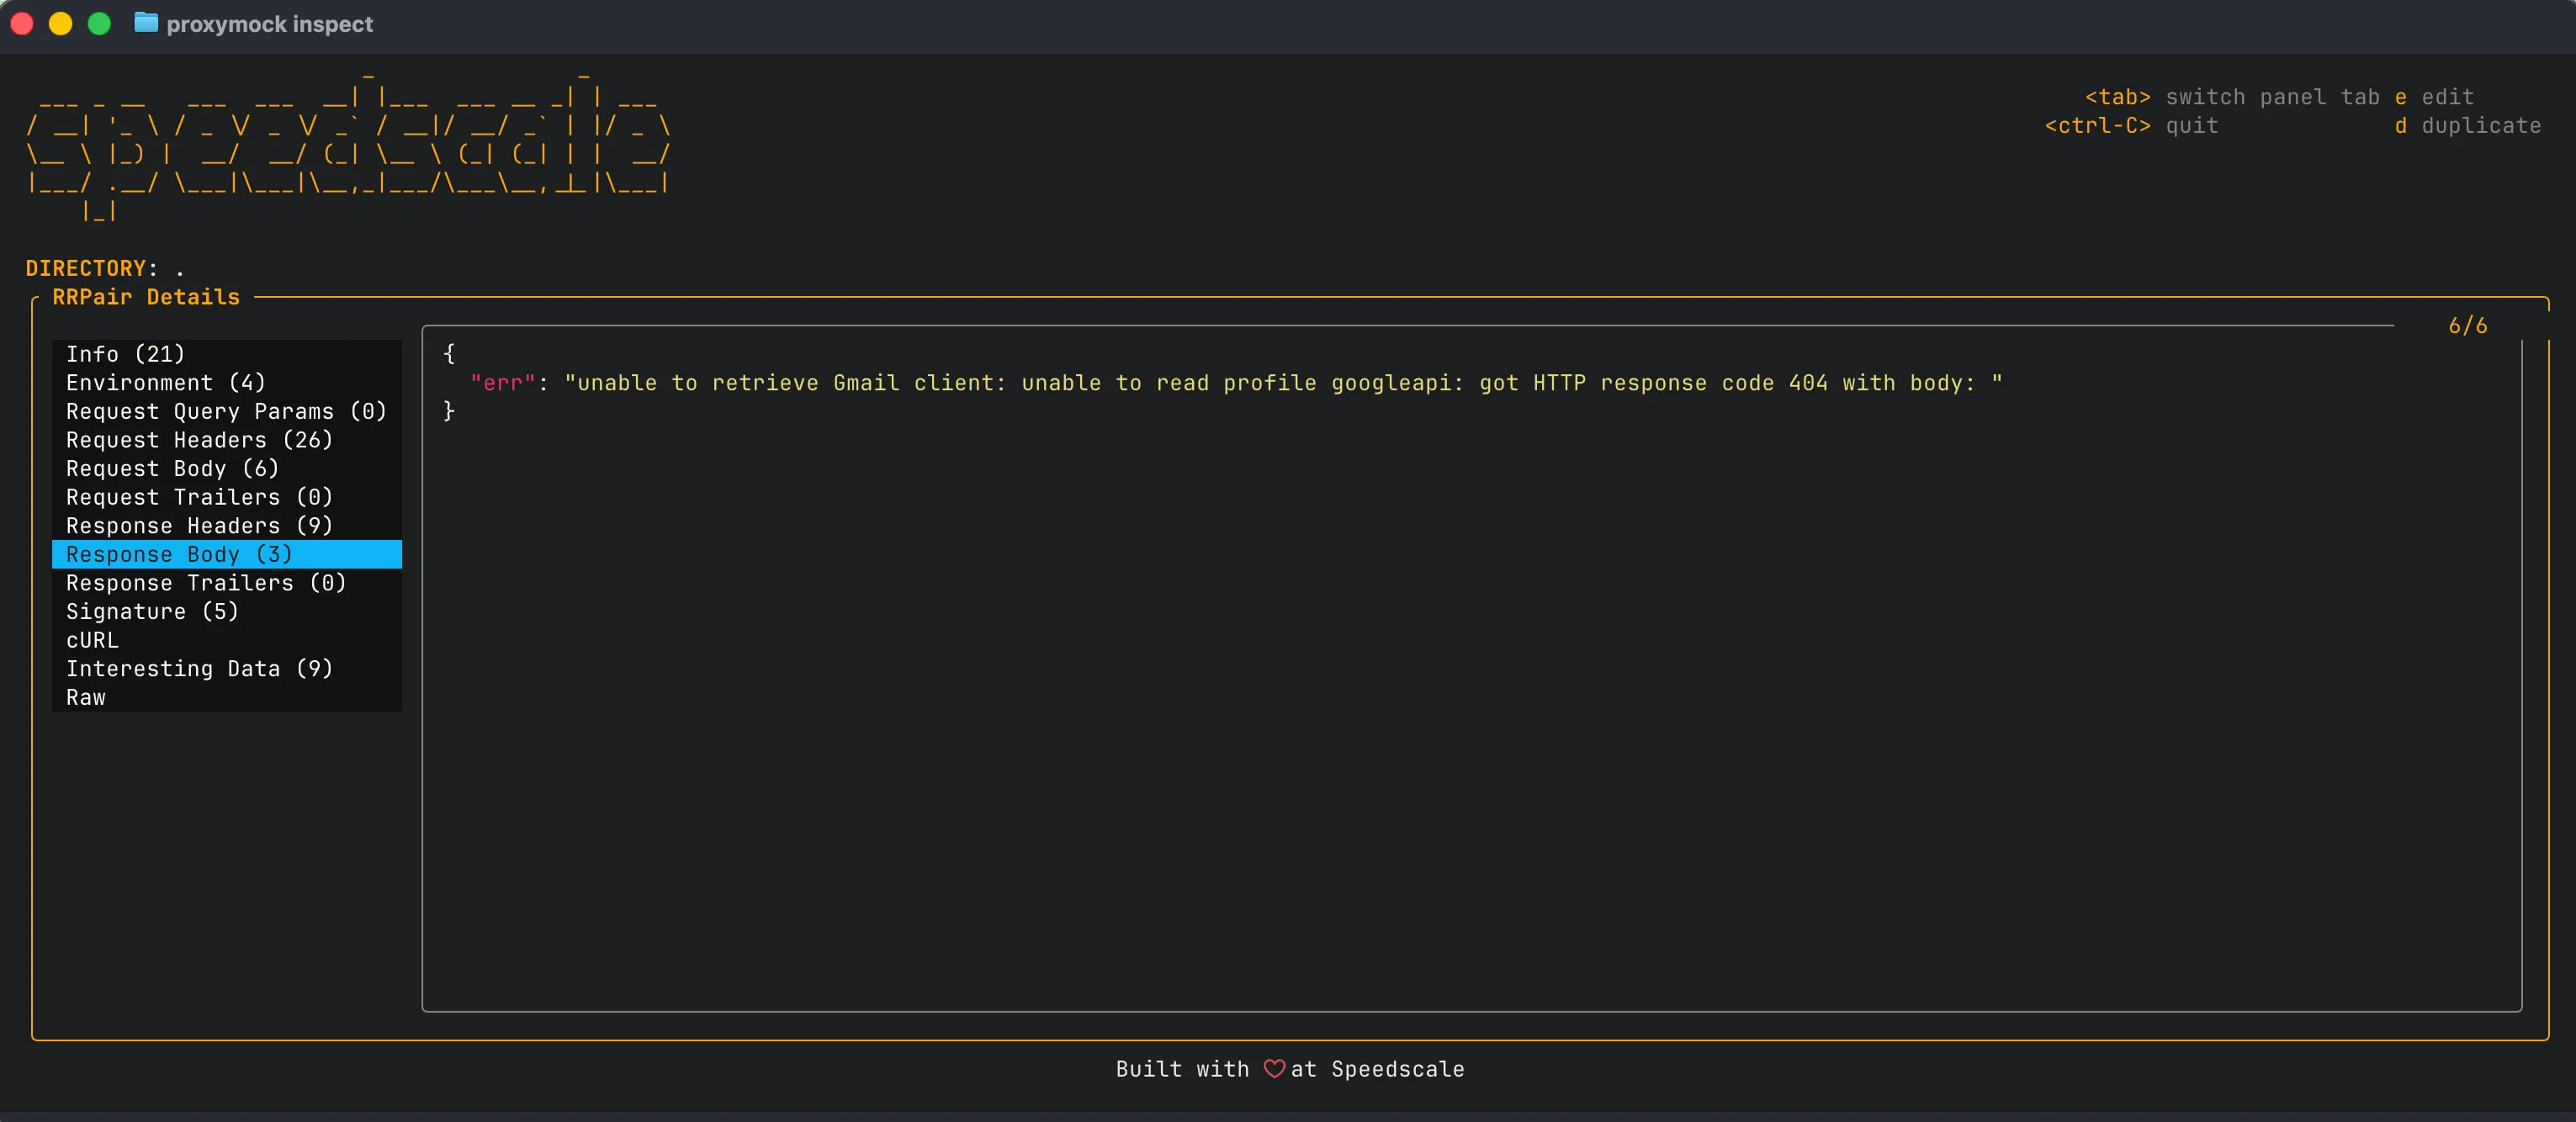
Option B: proxymock inspect
If you are running proxymock locally, use proxymock inspect to browse the recorded traffic in your snapshot and confirm the session header is present with the right casing:
Either way, you end up with a filter expression that isolates exactly the traffic scenario you want to reproduce.
The Datadog Synthetics exporter
proxymock export datadog-synthetics converts a recorded snapshot into a Datadog Synthetics multistep API test. --service and --limit handle broad cuts: host filtering and a request count cap. --filter handles the scenario-shaped case: a specific user’s requests in a specific window.
--filter accepts the standard Speedscale traffic filter expression, the same grammar proxymock search and the Speedscale Cloud snapshot builder already use:
# Pin to one session via a header your gateway sets
--filter '(header[X-Session-ID] IS "amanda.anderson@aol.com")'

# Same idea, but the session ID lives in a query param
--filter '(query_param[session] IS "amanda.anderson@aol.com")'

# Just the writes a customer attempted
--filter '(header[X-Session-ID] IS "amanda.anderson@aol.com") AND (command IS "POST")'

# All of one customer's failed requests across a window
--filter '(header[X-Session-ID] IS "amanda.anderson@aol.com") AND (status NOT "200")'
The grammar is intentionally explicit: parentheses around each predicate, an uppercase operator (IS, NOT, CONTAINS, REGEX), and string values in double quotes. AND/OR connect predicates. If you have written a Datadog log query before, the shape will feel familiar.
Two notes worth knowing:
- Header key casing is exact. If your gateway emits
X-Session-Id, use that casing in the filter, notX-Session-ID. ISmatches the full value;CONTAINSmatches a substring. UseCONTAINSwhen the session identifier is embedded inside a longer string, such as a JWT or a cookie with multiple fields.
The Datadog Synthetics export guide has the full flag reference, bundle layout options, and common patterns.
End-to-end: from a support ticket to a running Synthetics test
Assume ./proxymock/snapshot-UUID already contains a recording window that includes the affected customer. Set your Datadog keys once:
export DATADOG_API_KEY=...
export DATADOG_APP_KEY=...
1. Export and publish in one command
proxymock export datadog-synthetics \
  --in ./proxymock/snapshot-UUID \
  --out amanda-session.json \
  --filter '(header[X-Session-ID] IS "amanda.anderson@aol.com")' \
  --publish
The command exports the filtered traffic scenario, creates the Synthetics test in your Datadog account, and prints the exact links:
multistep test with 6 step(s) written to amanda-session.json

  Variables: amanda-session.vars.md
  View:      https://app.datadoghq.com/synthetics/details/abc-def-ghi
  Run:       datadog-ci synthetics run-tests --public-id abc-def-ghi
The View link opens directly to the test. The Run command is ready to copy into your CI pipeline.
2. Confirm the traffic scenario
Open amanda-session.vars.md next to the bundle. The “Skipped during export” section shows exactly how many RRPairs were dropped and why. If filtered by --filter equals the total number of RRPairs, the predicate matched nothing, most commonly because of header-key casing. Adjust and re-run with --force.
The sidecar also lists every sensitive header that was redacted, so you can confirm the right traffic scenario was captured before the test ever runs.
3. Pick the right bundle layout
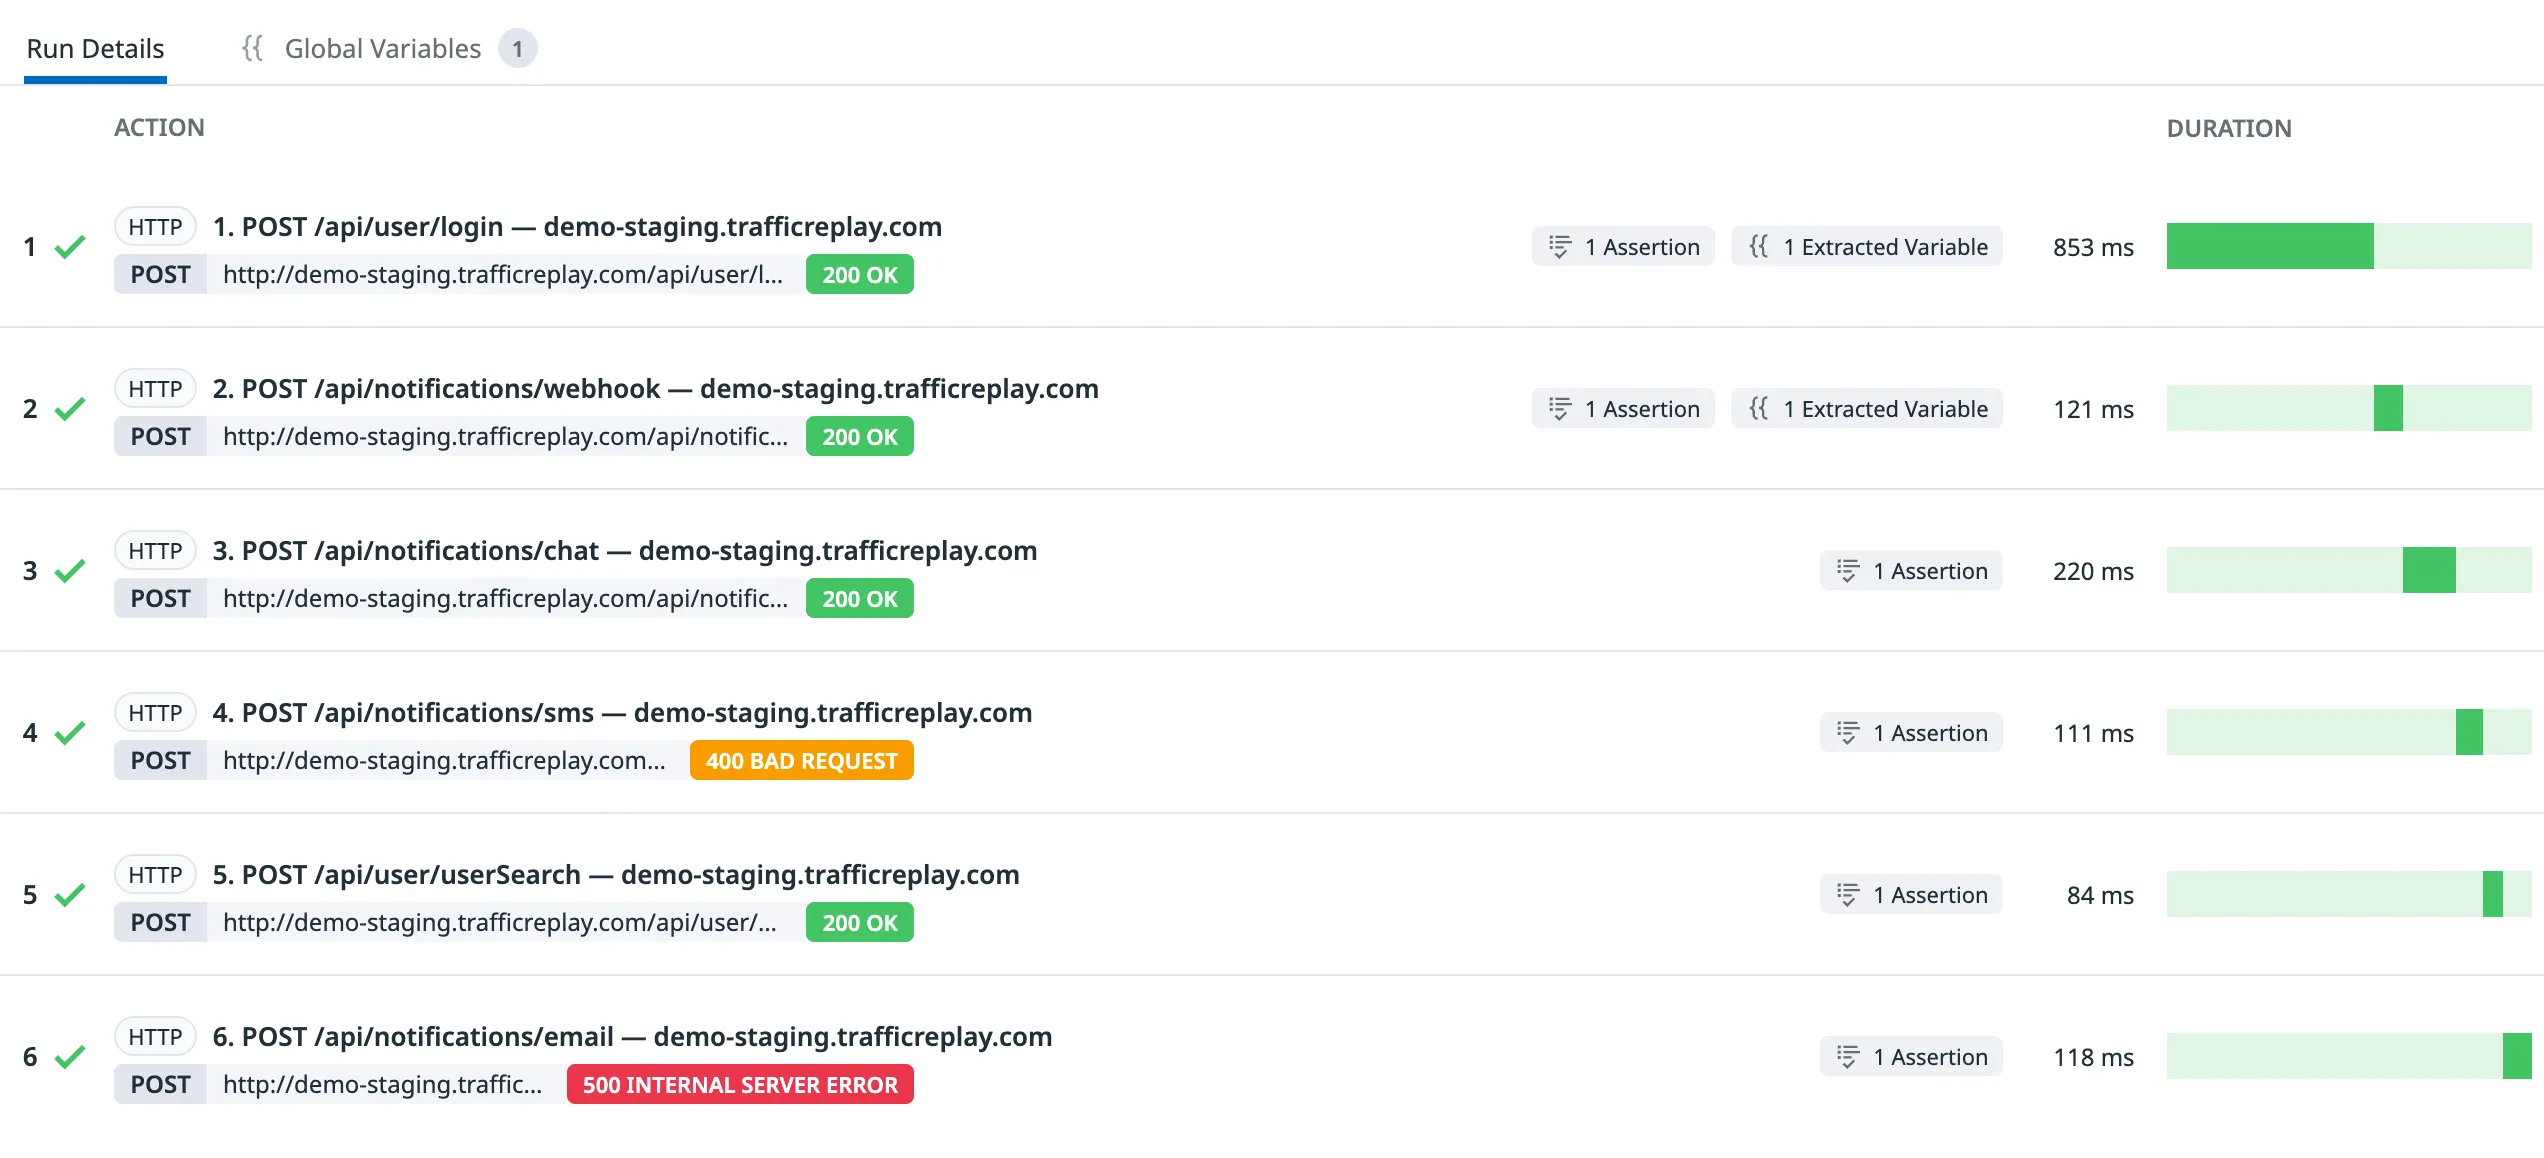
The default is --bundle multistep: one Synthetics API test, one step per recorded request, ordered by capture time. This is the layout that re-creates the customer’s exact traffic scenario and will surface “step 4 fails when run after step 3,” which is the whole point.
--bundle single emits one independent test per request. Useful when you want each call individually visible in Datadog alerts, or when the scenario spans more than 10 requests (Datadog’s multistep cap). To stay under 10 steps, narrow the scenario with a tighter filter:
# Just the failing leg of the checkout
--filter '(header[X-Session-ID] IS "amanda.anderson@aol.com") AND (url CONTAINS "/checkout")'
4. Automatic variable chaining between steps
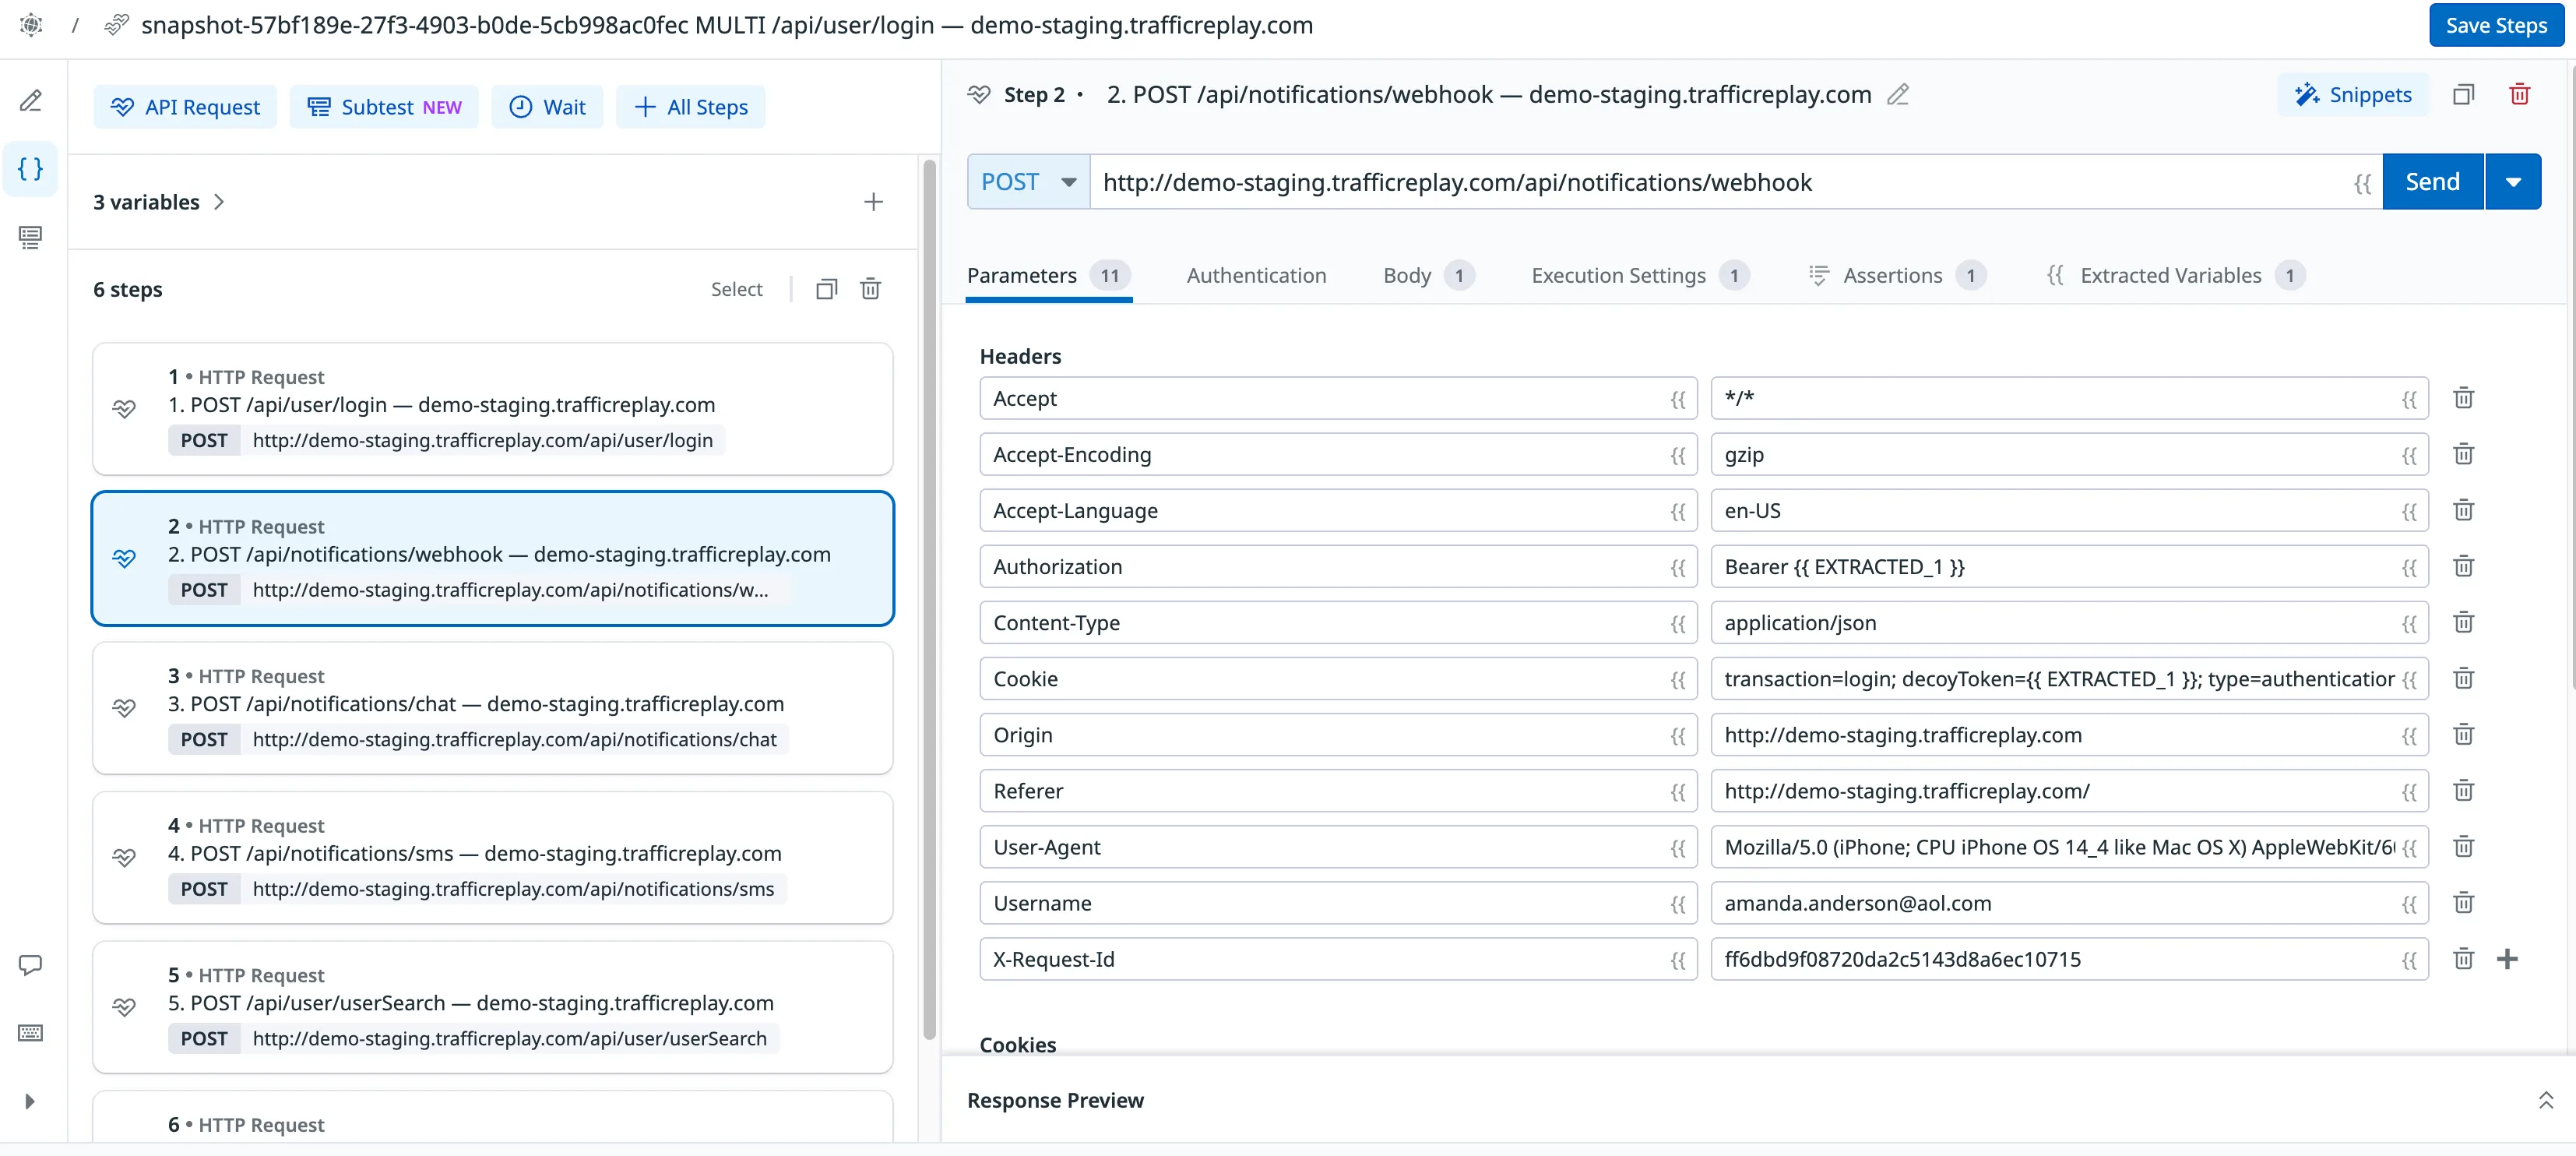
In multistep mode, the exporter scans each step’s JSON response for values that appear in a later step’s request and rewrites them as {{ EXTRACTED_n }}, automatically attaching a json_path extractor to the producing step. The test is not a brittle replay of yesterday’s tokens — it’s an executable traffic scenario that says “step 1 produces a token, step 2 must use it, step 3 must use the order ID step 2 returned.”
sequenceDiagram
    participant S1 as Step 1: POST /login
    participant E as Exporter
    participant S2 as Step 2: POST /cart
    participant S3 as Step 3: POST /checkout
    S1->>E: response {"token": "xyz"}
    E->>S2: inject {{ EXTRACTED_1 }}
    S2->>E: response {"order_id": "456"}
    E->>S3: inject {{ EXTRACTED_2 }}
This matters more for session-isolated scenarios than for broad exports. A single customer’s flow tends to be tightly coupled (login → cart → checkout → confirmation), and the auto-extraction recovers the exact dependencies that were live when the customer hit the bug.
5. Sensitive headers are handled automatically
Sensitive headers (Authorization, Cookie, X-Api-Key, …) are redacted into placeholders like {{ AUTHORIZATION_1 }} before anything is written. With --publish, matching Datadog global variables are created automatically using the real captured values, so the test runs immediately without manual setup.
You can review what was redacted in amanda-session.vars.md:
| Variable          | Source header   | Hosts           | Sample value        |
|---|---|---|---|
| AUTHORIZATION_1   | Authorization   | api.example.com | Bearer eyJhbGci…    |
| COOKIE_1          | Cookie          | api.example.com | session=abc123…     |
No live credentials committed anywhere. The same bundle runs from your laptop, your CI, or a Datadog private location.
Why this beats reproducing the bug by hand
The default playbook for “one customer hit a bug nobody else hit” is to read the logs, guess the inputs, and try to reproduce it locally with curl. (If you’re still building out your Datadog testing pipeline, this walkthrough covers the broader setup.) That works when the bug is shallow. It falls apart when the failure depends on:
- a token that has since been rotated,
- ordering between two writes that race only at the actual customer’s latency,
- a body field your front-end stopped sending last week,
- or a permission that exists only on that tenant.
Replaying the scenario as a Synthetics test sidesteps all four. The token is captured at recording time; ordering is preserved by --bundle multistep; the body is byte-for-byte what the front-end actually sent; the permission travels with the redacted-and-restored auth header. You are not reasoning about what the customer probably did. You are running what they did.
That distinction is also why scenario replay catches regressions traditional synthetics miss. A scripted browser test exercises the happy path you wrote down six months ago. A session-filtered replay exercises the path your customer took yesterday, including the weird back-button retry on step 3 that nobody would have thought to script.
Patterns that pay off
Once you can export filtered traffic scenarios straight into Synthetics, a few workflows become natural:
- Per-incident regression tests. When you ship a fix, capture a window after the fix, isolate the original session ID, and check the resulting bundle into CI. You now have a Synthetics test that fails the moment that exact regression returns.
- Tenant-scoped canaries. Use
--filter '(header[X-Tenant-Id] IS "...")'instead of a session header, and you have a canary that exercises one tenant’s real traffic against a new build, useful before rolling out schema changes that only some tenants depend on. - Compliance-grade reproductions. When a security or compliance team needs evidence of how a specific customer’s request was processed, the bundle plus the variables file is a self-contained, runnable artifact you can attach to the ticket.
Results
The mechanics are simple: capture once, identify the traffic scenario, publish with one command. The output gives you a direct Datadog UI link and a ready-to-run datadog-ci command. “I can’t reproduce it locally” stops being a valid answer to a customer ticket.
To try this against your own traffic, start with the Datadog Synthetics export guide. If you do not have a session key on every request yet, that is the first task. Add one. Everything else gets easier.