Replace API Synthetics with Traffic Replay
The alert fires at 2 AM. Your observability platform’s synthetic test just failed. Login is broken.
So you open your laptop, pull up the dashboard, and stare at a single red dot: the browser test. You know the problem is somewhere in the stack, but not where. Is it the auth service? The token validator? The user profile API? The API gateway timing out?
You’re now about to spend the next 45 minutes correlating traces, tailing logs, and manually hitting endpoints until you find it. A human just walked up to a problem that good tooling should have already localized.
This is the fundamental limitation of UI synthetics: they tell you the building is on fire but not which room.
What UI Synthetics Actually Test
Synthetic monitoring from observability vendors runs scripted browser sessions or HTTP checks against your public-facing endpoints. They simulate a user clicking through a checkout flow, or send a request to /api/health and check for a 200. This is useful. Uptime monitoring and user journey validation catch real problems.
But when a synthetic fails, you’re left with a correlation problem.
You know the checkout broke. You don’t know if it was:
- The product catalog service returning a 504
- The inventory API with a schema change that broke deserialization
- The cart service leaking memory under load
- A downstream payment provider having an outage
The synthetic test sits at the outermost layer of your system. It sees the same thing your users see: a broken experience. The diagnostic value ends there.
The blast radius of investigation starts the moment the synthetic fires. An SRE has to manually triage across every service in the call graph. This is where most of the incident time goes. Not fixing the problem, but finding it.
Observability platform synthetics are genuinely sophisticated. You can script multi-step flows, assert on DOM elements, run global tests from multiple regions. But the one thing they cannot do is isolate a failure to a specific backend service. That capability requires tests that live at the service boundary, not the user boundary.
The Smarter Strategy: Synthetics at the Service Level
The fix is conceptually simple: run synthetic checks against each individual microservice, not just the frontend edge.
When your cart service synthetic fails at 2 AM and the product catalog synthetic passes, you’ve eliminated a dozen potential causes before anyone touches a keyboard. The incident commander wakes up a single on-call, not the whole team.
This is API-level synthetic monitoring: a dedicated health check per service that verifies:
- It accepts the same request shapes as production
- It returns responses that match expected contracts
- It responds within acceptable latency thresholds
- Its dependencies (databases, downstream APIs) are behaving correctly in context
The diagnostic value is completely different from a UI synthetic. Instead of “the building is on fire,” you get “the second-floor east wing has a gas leak.” A human walks up to a pre-diagnosed problem.
This is standard platform engineering advice. The problem is executing it at scale without drowning in script maintenance.
Why Traditional API Synthetics Are Hard to Maintain
Building API-level synthetics against every microservice sounds good on paper. In practice, teams abandon them because:
Scripts go stale immediately. Your checkout API changes its request body shape in a sprint. The synthetic script you wrote six months ago still sends the old format. It either fails for the wrong reason or, worse, passes because the service silently ignores unknown fields. Either way, you’re not testing reality.
Scripted traffic is inherently narrow. A script that sends POST /checkout with a hardcoded payload is testing one specific scenario. Real users hit your API with thousands of different item combinations, session states, auth tokens, and sequencing patterns. A script can’t capture that breadth without enormous investment.
Scripts test happy paths by default. Engineers write test cases they can reason about. But the bugs that reach production are rarely in the happy path. They’re in edge cases that nobody thought to script: malformed JWTs, empty carts with discount codes applied, requests that arrive slightly out of sequence.
Maintenance costs compound. For a system with 30 microservices, maintaining 30 sets of synthetic scripts is a part-time job. APIs evolve. Scripts drift. The synthetic infrastructure becomes a liability.
This is why teams default to a small number of UI synthetics on the critical path and accept the diagnostic gap. The cost of maintaining API-level scripts is too high.
Traffic Replay Changes the Equation
Speedscale’s approach to API synthetics is different at its core: instead of writing scripts that approximate real traffic, you record actual production traffic and replay it.
This distinction has deep consequences:
You write zero scripts. Traffic is captured directly from your running service: every request, every response, every header, every payload. There’s nothing to author, nothing to maintain.
It’s exactly consistent. Every replay sends the identical requests your production service received. The test is deterministic: the same inputs, in the same sequence, at the same timing. Not an approximation of production traffic. The actual thing.
It’s 100% accurate out of the box. Because the test data comes directly from real usage, it includes all the edge cases, unusual request shapes, and real-world sequencing patterns that manual scripts miss. You’re not testing hypothetical scenarios; you’re testing what your service actually handles.
Refreshing is a single operation. When your API evolves (new endpoints, new request shapes, new authentication patterns), you don’t rewrite scripts. You record a new traffic snapshot and the synthetic test automatically reflects the updated behavior. Press record, wait a few minutes, done.
The contrast with scripted synthetics:
| Scripted API Synthetic | Speedscale Traffic Replay | |
|---|---|---|
| Test authoring | Manual: write Postman/cURL scripts | Zero: captures automatically |
| Traffic accuracy | Approximation of real behavior | Real production requests |
| Edge case coverage | Only what you thought to script | Every real-world pattern |
| Maintenance | Rewrite when APIs change | Record a new snapshot |
| Consistency | Varies by script quality | Deterministic every run |
Scheduling Replay as a Direct Replacement for Synthetics
The scheduling model in Speedscale is what makes traffic replay a direct replacement for traditional synthetics.
Configure a replay to run against a microservice on a recurring schedule: every 15 minutes, every hour, after every deployment. The replay fires the captured production traffic at the service, verifies responses against the recorded baselines, and reports pass/fail.
This creates a continuous validation loop for each service:
flowchart LR
    A[Record Traffic] --> B[Store Snapshot]
    B --> C[Schedule Replay]
    C --> D[Compare Responses]
    D -->|pass| C
    D -->|fail| E[Alert on Failure]
    E --> F[Fix and Re-record]
    F --> B
When the scheduled replay fails, you know exactly which service is failing and exactly which requests it’s failing on, because the replay is deterministic. There’s no ambiguity about what was sent or what the expected response should be.
The operational comparison to traditional synthetics is direct:
| Observability Vendor UI Synthetic | Speedscale Scheduled Replay | |
|---|---|---|
| What it tests | Frontend user journey | Individual microservice API |
| Test authoring | Write Selenium/Puppeteer scripts | Zero: records automatically |
| Traffic accuracy | Scripted approximation | Real production requests |
| Failure isolation | ”Something in the stack broke" | "Service X is failing on endpoint Y” |
| Maintenance | Manual script updates | Record a new snapshot |
| Coverage breadth | Happy paths you thought to script | Every real-world request pattern |
| Scheduling | Polling interval on edge | On-demand, scheduled, or post-deploy per service |
Both approaches belong in a mature monitoring stack. But they answer different questions. A UI synthetic tells you whether the user-facing experience is intact. A Speedscale scheduled replay tells you whether a specific service is behaving correctly. You need the first for user journey coverage and SLA reporting. You need the second to diagnose failures faster than any human can.
Running API Replay Across Your Entire Fleet
Scaling this pattern across a microservices fleet is where the strategy pays off most.
With a UI synthetic, you have one test that traverses the full call graph. With Speedscale scheduled replays, you have one test per service, each independently validating its own behavior in isolation.
The operational impact during incidents:
Before: Synthetic fails → team starts manual triage → 45 minutes to identify root service
After: 3 of 30 service replays fail → team immediately knows which services are affected → 5 minutes to page the right on-call
The second scenario requires no investigation to isolate. The failing service replays tell you exactly where to look. A human walks up to a pre-diagnosed problem, not an undifferentiated alert.
For platform engineering teams, this pattern is particularly powerful. You can build traffic capture and scheduled replay into your service onboarding pipeline, so every service gets API-level synthetic coverage automatically. Engineers don’t have to opt in or write test cases. It happens as part of the platform. The coverage is structural, not opt-in.
This is the key shift: with scripted synthetics, coverage is proportional to how much script-writing investment you’ve made. With traffic replay, coverage is proportional to how many services are running, because they all generate traffic automatically.
The Limits of Any Synthetic Approach
It’s worth being precise about what scheduled replay does and doesn’t do.
Scheduled replay validates that a service continues to behave the way it did when traffic was recorded. It’s a regression check: did this deploy break something that was working? It’s excellent for catching behavioral regressions, contract violations, and dependency failures.
What it doesn’t replace: load testing (which requires scaling traffic volume, not just replaying at 1-to-1), chaos engineering (which requires injecting faults), and end-to-end user journey validation (which requires coordinating across services). Observability vendor synthetics remain valuable for the last category.
The right monitoring stack layers these:
- UI synthetics (observability platforms) for user journey and uptime monitoring
- Scheduled API replay (Speedscale) for per-service behavioral validation and failure isolation
- Load testing replay for performance regression detection before deploys
Each layer answers a different question. The gap most teams have is the middle layer (per-service API validation), and that’s where scripting costs have historically made it impractical.
Getting Started
The Speedscale workflow for setting up scheduled API replay per service. See the getting started guide for AI local development or Kubernetes deployment.
-
Capture: Deploy the Speedscale collector alongside your service. It records all inbound traffic transparently, with no code changes required.
-
Select a snapshot: After capturing representative traffic (typically a few hours during normal load), designate a snapshot as your synthetic baseline.
-
Configure a schedule: Set the replay to run on an interval or trigger it post-deploy via your CI pipeline.
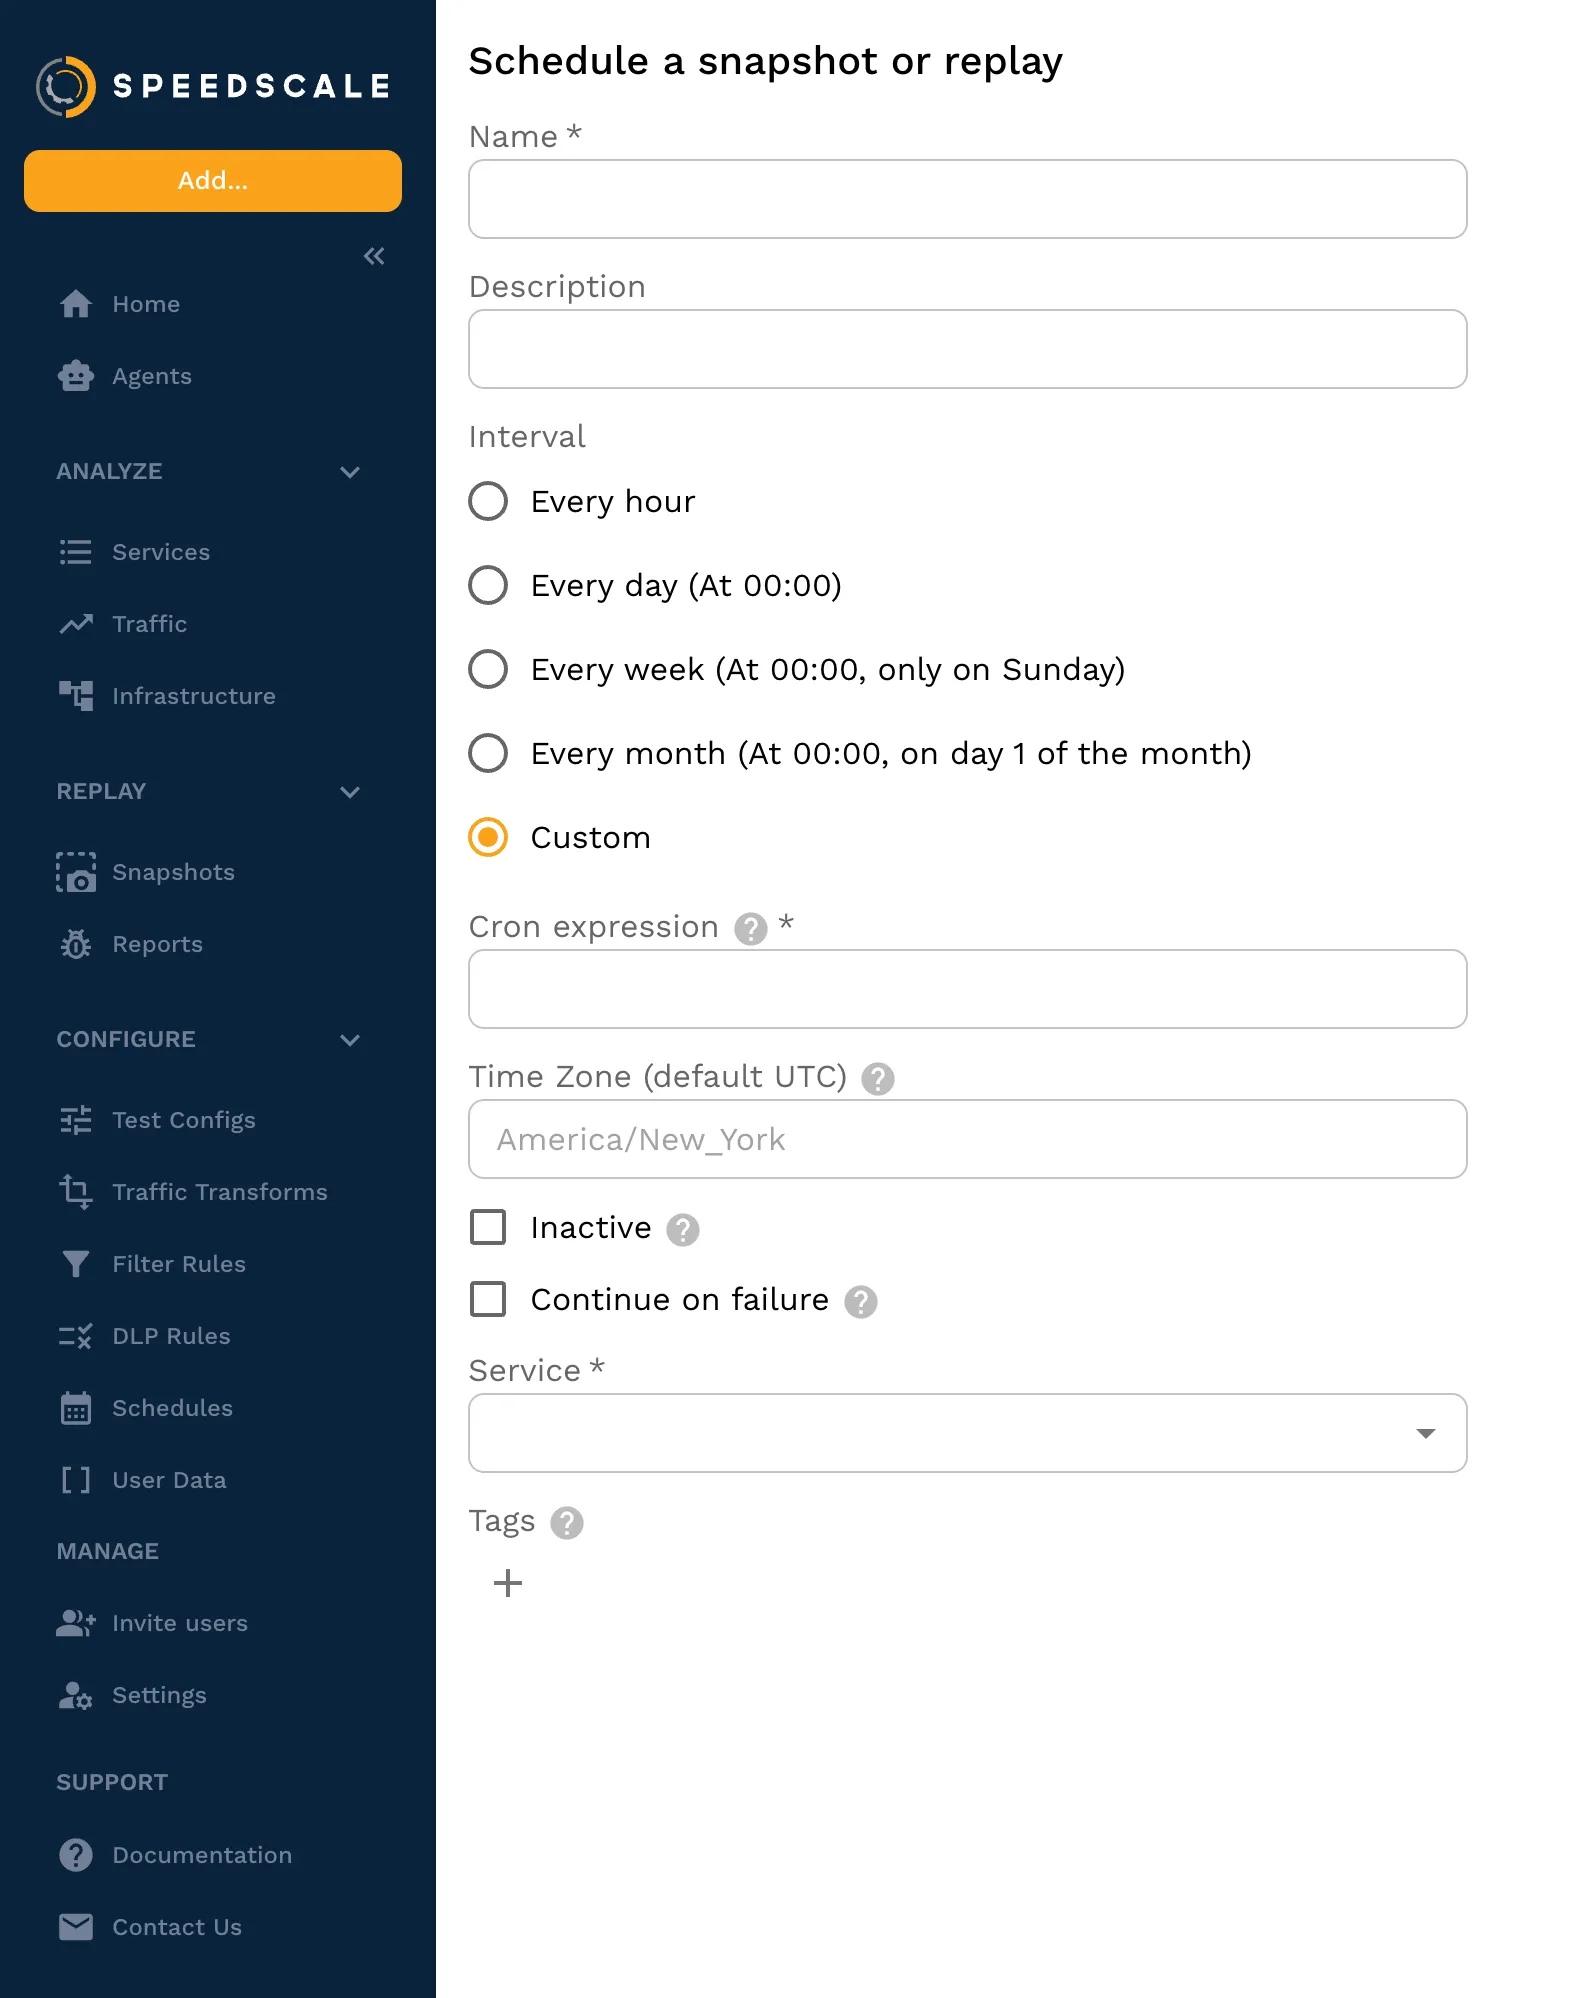
-
Review assertions: Speedscale automatically compares responses against the baseline. Define acceptable drift thresholds for status codes, headers, and body content.
-
Connect alerting: Export replay results directly to Datadog, New Relic, Grafana, and others via
speedctl export. Failed replays surface in your existing dashboards and alerting workflows — Speedscale slots in as an add-on, not a replacement. -
Refresh on demand: When your API changes, capture a new snapshot. The synthetic updates automatically, with no rewrite required.
That’s it. No Selenium. No maintained test cases. No happy-path-only coverage. Real traffic, running on a schedule, against the service that actually matters.
The Monitoring Strategy That Actually Cuts MTTR
UI synthetics are valuable for user journey coverage and public uptime reporting. They belong in your stack. But they’re a blunt instrument for diagnosing failures in distributed systems. Relying on them as your primary reliability signal means your SREs spend most of their incident time doing work that good tooling should have already done.
The pattern that actually reduces mean time to resolution is running traffic replay on a schedule against each microservice. When something breaks, you know which service broke it before a human is paged, and that human walks up to a pre-localized problem.
Speedscale makes this practical at scale: no scripts to write, no test cases to maintain, no approximations of production traffic. Record the traffic, schedule the replay, and get out of the way. When the replay fails, you already know where to look.
That’s the monitoring strategy worth building.