APIs are the backbone of modern software and enable different systems and applications to communicate seamlessly. API traffic capture is an essential technique that allows developers to monitor and analyze data transmitted between different parts of their application and external services. Capturing and monitoring real time API traffic can also be a gateway to improving performance, troubleshooting issues, and enhancing security. However, you’ll need a specialized tool to navigate the complexities of the process of capturing and interpreting this traffic.
This article discusses the following solutions for implementing traffic capture: tcpdump, Wireshark, TShark, Kubeshark, Proxyman, Charles Proxy, Postman, and Speedscale.
The article examines the tools based on the following criteria:
-
Features
-
Ease of use and developer experience
-
Ease of integration
-
Customization and flexibility
-
Recording and playback
-
Traffic filtering and searching
-
Request and response inspection
-
Performance impact on your app
By the end, you’ll be equipped to make informed decisions on which tool best suits your specific requirements in API traffic capture, observation, and network analysis.
Top 8 API Testing Tools and Methodologies
tcpdump
tcpdump is one of the most widely used command line tools for real time network traffic analysis. It displays the captured data in a textual format for analysis and offers basic features like packet filtering, readable timestamps, basic protocol info, packet counting, and various output formats. However, it’s primarily a network packet capture tool rather than an advanced analysis tool.
tcpdump operates on a large variety of Unix-like operating systems and relies on the libpcap library. Written using C/C++, the libpcap library facilitates low-level network monitoring and allows for network packet capture outside the network stack of the operating system. You can also use libpcap to develop bespoke network monitoring tools that enable more in-depth and programmable analysis.
Ease of Use and Developer Experience
Due to its text-based, real time output, tcpdump’s learning curve may be steep for those unfamiliar with command line interfaces or network protocols. If you want to effectively use libpcap, you’ll also need a strong grasp of C.
Ease of Integration
Integrating tcpdump is straightforward on single-server instances where it’s installed on the same server as the application, but it can be complex in a distributed environment. However, the libpcap library is widely supported and can be integrated into various programming languages.
Customization and Flexibility
Both tcpdump and libpcap offer a high degree of customization in specifying what data to capture. tcpdump can be easily used in scripts and automated tasks, but its text-based output often requires additional processing.
Recording and Playback
tcpdump supports saving captured packet data to files and reading them for analysis or use in advanced tools like Wireshark.
Traffic Filtering and Searching
tcpdump provides extensive command line options for precise network traffic capture based on source or destination host, port, IP/MAC address, protocol, packet size, and time. Filters can be combined with logical operators and grouped for complex conditions.
Request and Response Inspection
tcpdump primarily focuses on capturing network packets and does not provide built-in features for inspecting higher-level application-layer data such as URL request and response information.
Performance Impact on Your App
tcpdump and libpcap are relatively lightweight and have a minimal performance impact on your application. However, if you experience high network traffic, they may compete for system resources if they are running on the same server as the application.
Overview
tcpdump and libpcap are powerful for network packet capture and offer extensive filtering. They suit users with network and programming expertise. You’ll need to ensure sufficient network bandwidth and system resources for high-traffic environments to prevent bottlenecks in your application.
Wireshark
Wireshark is an industry-standard network protocol analysis tool. It’s open source and cross-platform. It’s typically used for network troubleshooting, analysis, malware analysis, network forensics, vulnerability analysis, protocol development, and other educational purposes.
Wireshark provides deep packet inspection, real time network packet capture, and detailed analysis of various network protocols, including HTTP, HTTPS, and gRPC, in real time or from existing captures in PCAP files. It also offers built-in functions for statistical analysis as well as flow graphs and analysis.
Ease of Use and Developer Experience
Unlike tcpdump, Wireshark has a graphic user interface (GUI). However, it is rather complex, with a comprehensive feature set for detailed traffic analysis. This makes it more suited for advanced users who have a good understanding of network protocols.
Ease of Integration
As a standalone GUI application, Wireshark doesn’t provide many options to directly integrate into your application environments. It does support Lua scripting for advanced automation and analysis, but this requires scripting expertise and manual effort to correlate its data with specific application behaviors.
Customization and Flexibility
Wireshark offers extensive customization options, including layout options, flexible logging, filters, color coding, and protocol dissectors. You can also tailor the tool to focus on specific traffic types you are interested in.
Recording and Playback
Wireshark allows for the capture of live data, which can be saved for later review and analysis offline. However, Wireshark by itself doesn’t support the playback of traffic in a way that simulates network interactions. This isn’t ideal for debugging, so you’d need other tools like Scapy and Tcpreplay.
Network Traffic Filtering and Searching
Similar to tcpdump, Wireshark offers powerful and extensive display searching and filtering capabilities that allow you to efficiently sift through large volumes of data to find and isolate relevant information. However, the filter syntax may not be intuitive for beginners.
Request and Response Inspection
Wireshark provides granular inspection of network packets, including requests and responses in various protocols. However, its focus is more on the network level. It requires manual interpretation and lacks a user-friendly API view on specific API calls.
Performance Impact on Your App
Wireshark can be resource-intensive, especially during long captures, as it captures all network activity—even if it’s unrelated to your application. However, its impact on the application being monitored may be generally minimal, as it passively captures network traffic.
Overview
Wireshark is a powerful tool for experienced developers and network professionals who need deep-level analysis of API traffic. However, its steep learning curve and lack of user-friendly API views make it less suitable for beginners or those looking for a quick and easy way to analyze API interactions.
TShark
TShark is essentially the command line version of Wireshark. It can capture and produce network traffic analysis in real time or from saved files. TShark offers a powerful toolset for inspecting and dissecting network traffic. It focuses primarily on network and packet-level data, including detailed protocol dissection, decryption support for many protocols, and powerful display filters.
It’s a go-to choice for network administrators, cybersecurity professionals, and developers who need to diagnose network-related issues or understand network traffic patterns.
Ease of Use and Developer Experience
As a command-line-based tool, TShark can have a steeper learning curve than GUI tools. However, it may actually be easier to use for developers, as they’ll be more comfortable with command line interfaces and network protocols.
Ease of Integration
TShark can be integrated into scripts and automated processes, making it highly versatile for advanced users who need to embed network traffic analysis in their workflows.
Customization and Flexibility
TShark provides extensive customization options through a variety of command line parameters, making it well-suited for scripting in environments where a GUI is either unnecessary or unavailable.
Recording and Playback
TShark can capture network activity in real time or analyze previously captured traffic saved in files. However, it does not have a playback feature in the same sense as application-focused tools.
Traffic Filtering and Searching
TShark excels in this area with robust filtering capabilities, allowing users to zero in on specific packets or protocols such as HTTP, WebSocket, and FTP-based packets in a specific time frame through a specific network interface.
Request and Response Inspection
TShark allows you to do a detailed inspection of individual network packets for insights, including requests and responses in various network protocols. However, this isn’t possible for HTTPS API requests without first installing SSL certificate keys for decrypting requests over secured connections. This level of detail is valuable for in-depth network analysis but may be a bit overwhelming for a developer’s purposes.
Performance Impact on Your App
As a network capture tool, TShark’s impact on application performance is generally minimal, but capturing large volumes of traffic can consume significant system resources.
Overview
While TShark is a powerful and flexible tool, it’s best suited for users with solid networking knowledge and those comfortable with command line interfaces. Its capabilities are more aligned with network-level analysis than high-level API traffic capture and analysis.
Kubeshark
Kubeshark is similar to Wireshark but designed for monitoring and analyzing network and API traffic in Kubernetes environments. Kubeshark focuses on capturing this intracluster communication, providing insights into how different services within a Kubernetes cluster communicate via APIs for troubleshooting and optimizing application performance and interactions. Its service map view monitors and visualizes API interpod communications and service interactions.
Ease of Use and Developer Experience
Kubeshark, while powerful, might present a slight learning curve for those not already familiar with Kubernetes observability. However, it provides quite an intuitive and modern web interface with user-friendly API views for interaction.
Ease of Integration
Kubeshark is tailored to work seamlessly with Kubernetes clusters, which makes its integration straightforward for those already operating in such environments.
Customization and Flexibility
Kubeshark offers relevant customization options for Kubernetes observability based on namespaces, pods, and resources. It also includes a script engine that developers can use for further customization and automation.
Recording and Playback
Kubeshark allows you to capture traffic within Kubernetes clusters in the PCAP format for later offline analysis. The replay functionality allows you to resend a single request and payload to the destination host and port. However, this is limited and cannot completely simulate a working instance of your application.
Traffic Filtering and Searching
Given its specialized nature, Kubeshark offers robust filtering and searching capabilities through Kubernetes-specific API traffic such as destination resources, HTTP status codes, namespaces, and so on.
Request and Response Inspection
Kubeshark provides a detailed UI for request inspection of supported protocols such as HTTP, AMQP, Apache Kafka, Redis, gRPC, GraphQL, and DNS requests and responses within the Kubernetes cluster environment for thorough debugging and analysis.
Performance Impact on Your App
Kubeshark has minimal impact on resource usage when running in capture mode within your cluster but tends to be resource-intensive when monitoring and dissecting packets over the dashboard.
Overview
Kubeshark is a niche tool for developers and administrators in the Kubernetes networking space, and its effectiveness is best evaluated within the context of such workflows.
Proxyman
Proxyman is a web debugging proxy and network monitoring tool designed primarily for macOS but does support Windows, Linux, iOS, and Android. Proxyman provides a wide range of features, including SSL interception for secure API analysis, support for various protocols (HTTP, HTTPS, WebSocket, GraphQL), traffic history and search, request manipulation, response mocking, breakpoint debugging, and performance analysis for insights into request/response times and potential bottlenecks. It presents these functions and insights in a clear and well-organized user interface. However, most of the advanced features require license fees to access.
Ease of Use and Developer Experience
Unlike previous tools such as Wireshark, Proxyman makes it easier to grasp the big picture as it’s designed for developers of all skill levels. It focuses on a clear and organized view of API traffic and provides summaries and visual representations of API calls.
Ease of Integration
As a cross-platform tool, Proxyman seamlessly integrates into various development workflows. It works on development or client devices without needing to touch your infrastructure. It also offers various options for setting up proxying, including manual but simple configuration, browser extensions, and mobile apps.
Customization and Flexibility
Though its features cover almost all potential use cases, Proxyman also provides a scripting engine that can automate specific behaviors and actions according to your needs.
Recording and Playback
Proxyman provides basic web API traffic record and replay features for testing or debugging purposes, with limited options for exporting request and response data. You can record all API calls while browsing through your application replay or repeat them individually.
Traffic Filtering and Searching
You can filter API traffic based on various criteria like URL, method, headers, and status code. You can search captured data for specific keywords or patterns. While this works fine, the filtering options are not as granular as those offered by some other tools, such as Wireshark.
Request and Response Inspection
Proxyman displays requests and responses in a structured and readable format, including headers, payloads, and body previews that let you expand and explore different parts for detailed interactive analysis (even over SSL/TLS encryption, which can be a struggle for most other tools, including Wireshark and Kubeshark). With its Map Local and Map Remote features, you can also manipulate or mock responses from your backend without the need to touch code.
Performance Impact on Your App
Proxyman operates directly on development and testing devices like desktops, laptops, and mobile devices, and traffic is captured on the local device. So, it’s lightweight and has a minimal impact on application performance.
Overview
Proxyman excels at user-friendliness and flexibility, making it a great choice for developers who want a modern and intuitive tool for analyzing API calls. Features like request manipulation, replay, and breakpoint debugging make it ideal for testing and debugging various API scenarios. While it may not offer the deep-level analysis of tools like Wireshark, its ease of use and focus on developer experience make it a valuable asset for many development workflows.
Charles Proxy
Similar to Proxyman, Charles Proxy is a popular web debugging tool that operates as a proxy server to monitor HTTP and HTTPS traffic between your computer and the internet. Though a little outdated, it has some practical features, including SSL interception for decrypting HTTPS traffic, traffic history and search, remote access via mobile devices, mapping and rewriting capabilities for linking remote resources to local files, and bandwidth throttling to simulate low-latency scenarios. It’s particularly useful for debugging the content of remote HTTP sessions and is often used by mobile and web developers to debug issues and understand the behavior of their applications. Its features are locked behind a license fee, but it does offer a thirty-day trial.
Ease of Use and Developer Experience
Charles Proxy offers a simple and well-organized user interface with options for detailed inspection, making it accessible to developers of all skill levels. However, its overall look and feel are somewhat dated, and it may lack some advanced features found in tools like Proxyman.
Ease of Integration
Charles Proxy supports macOS, Windows, and Linux and provides various options for setting up proxying, including manual configuration and mobile apps. Similar to Proxyman, this works solely on the developer’s local machine and is limited to specific web protocols.
Customization and Flexibility
Apart from the standard proxy configurations, it offers no further integration or customization.
Recording and Playback
Charles Proxy offers basic recording features by logging API traffic in the sequence of requests from your browser, which it allows you to repeat with or without modification for individual testing or debugging purposes.
Traffic Filtering and Searching
Charles Proxy’s filtering options are pretty basic; you can filter API traffic based on various criteria like URL, method, headers, and status code. The filter options are not as granular as those of tcpdump or Wireshark.
Request and Response Inspection
Like Proxyman, Charles Proxy displays requests and responses in a structured and readable format, including headers, payloads, and body previews. You can expand, explore, and modify different parts of requests and responses for detailed analysis, testing, and debugging.
Performance Impact on Your App
Charles Proxy is lightweight and should have minimal impact on application performance, as it runs on your development machine and is not directly integrated into your application infrastructure.
Overview
Overall, Charles Proxy is good for beginners who want a minimalist tool for debugging purposes. However, it lags behind Proxyman in features and a modern look, especially considering the license cost involved.
Postman
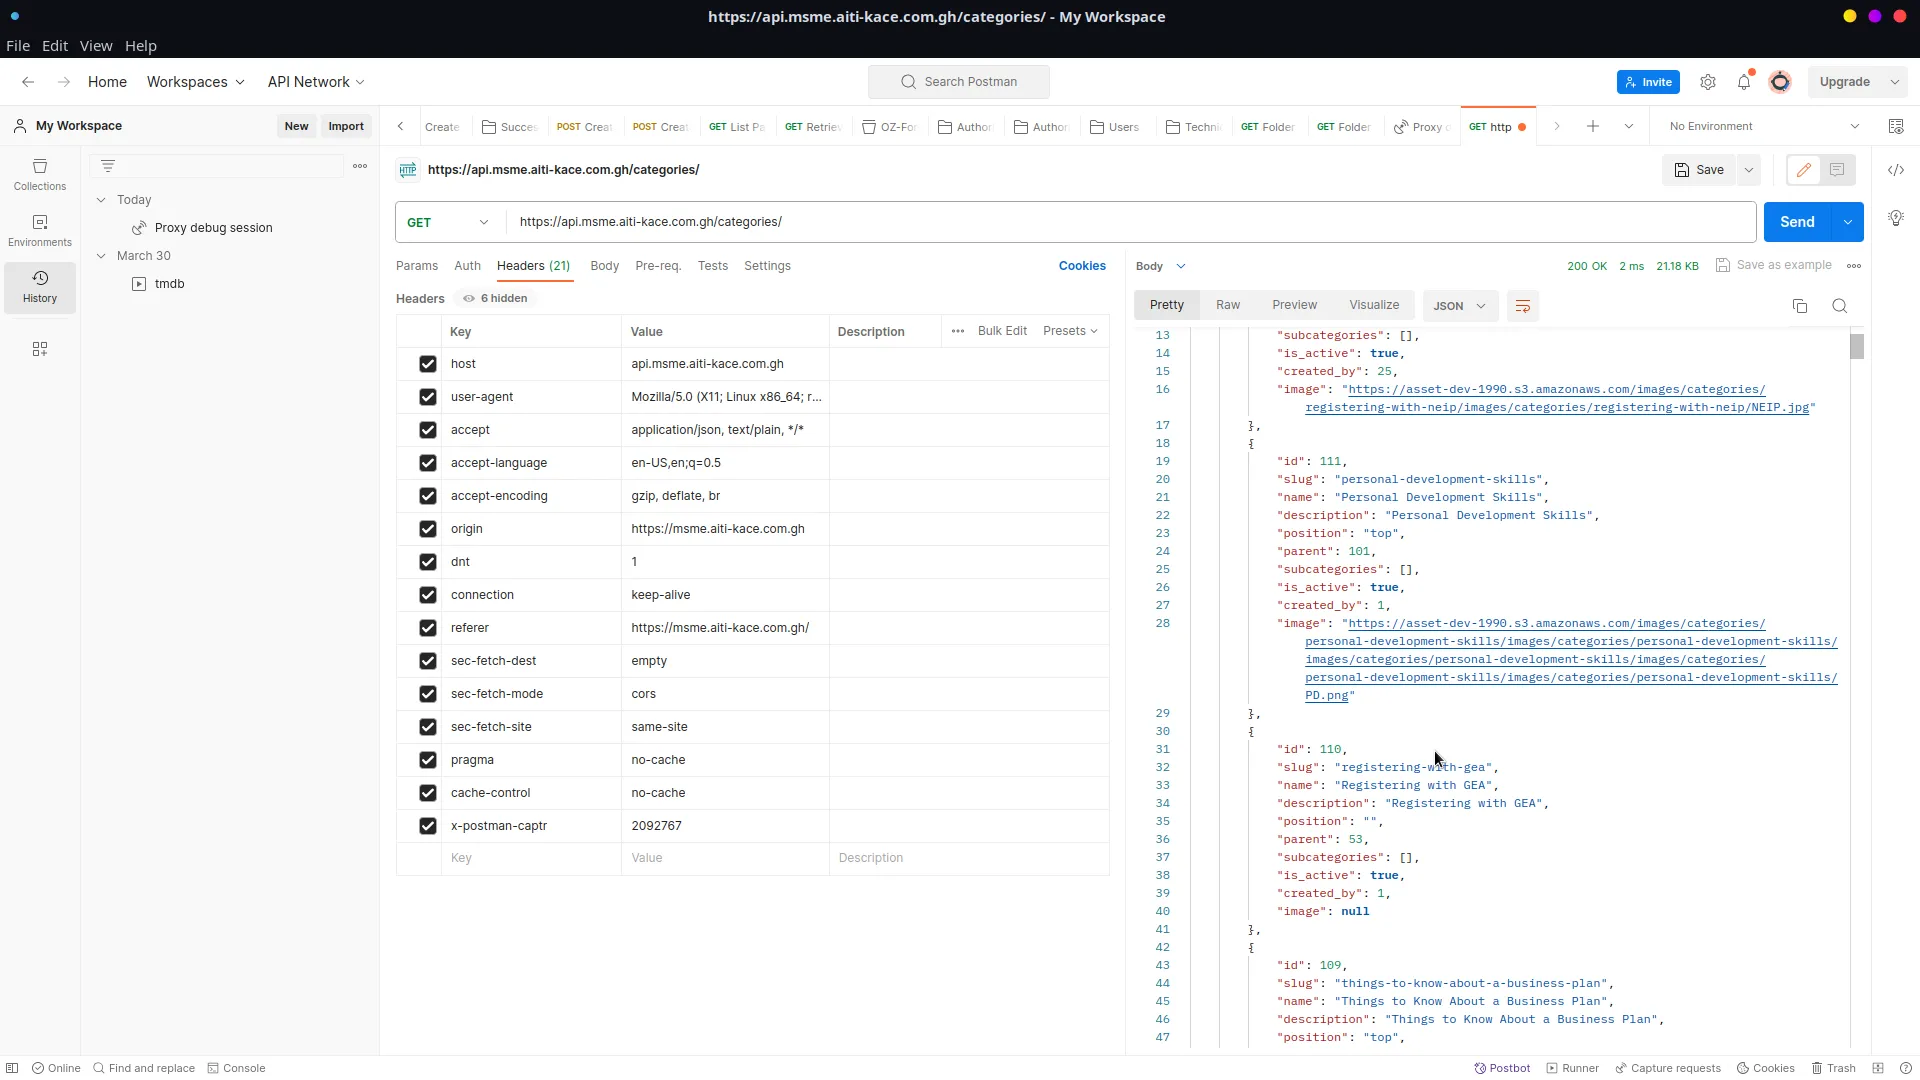
Postman is a well-known tool that’s popular for API testing and development. Postman handles HTTP, HTTPS, WebSocket, and various other protocols. It offers a user-friendly interface that simplifies creating mock responses and organizing requests for efficient testing. For advanced testing, it also provides prerequest and test scripts to automate tasks before and after sending requests. Its proxy and interceptor features make it a powerful and versatile tool for capturing and analyzing API traffic. You can share and collaborate on API collections and testing workflows with your team. It provides graphs for visualizing traffic captured in a session.
Ease of Use and Developer Experience
Postman features a user-friendly and familiar interface with a drag-and-drop interface and intuitive options. It’s a good option both for developers already comfortable with making API requests and for new developers just getting started.
Ease of Integration
Postman runs as a dedicated application for Mac, Windows, and Linux, separate from your development infrastructure environment. Postman also provides a Postman Interceptor browser extension for Chrome, Safari, Edge, and Firefox. However, it usually requires manual configuration to capture traffic from other programs. Postman can organize requests into collections and environments for better workflow management.
Customization and Flexibility
Postman can automate API testing to customize the behavior and sequence of requests to your APIs. However, this requires a lot of initial manual work to get right.
Recording and Playback
Recording and playback in Postman are limited. You can save captured API traffic and requests to collections and later replay them for testing or debugging purposes. However, playing them sequentially as they were captured requires a manual process where you chain and execute them together.
Traffic Filtering and Searching
Postman allows you to filter captured traffic based on domain, URL, method, headers, and status code.
Request and Response Inspection
The Postman proxy works similarly to Proxyman and Charles Proxy. It acts as an intermediary for communications between client apps and the server. Requests and responses are easily readable and should provide any details you need.
Performance Impact on Your App
Postman generally has minimal impact on application performance during capture as it runs solely on the developer’s computer.
Overview
Postman is a comprehensive API testing tool with built-in capture and replay capabilities. It has a user-friendly interface, a strong focus on testing, and collaboration features. However, while it can capture and analyze API traffic, its analysis capabilities are not as in-depth as dedicated traffic capture tools like Wireshark or Proxyman.
Speedscale
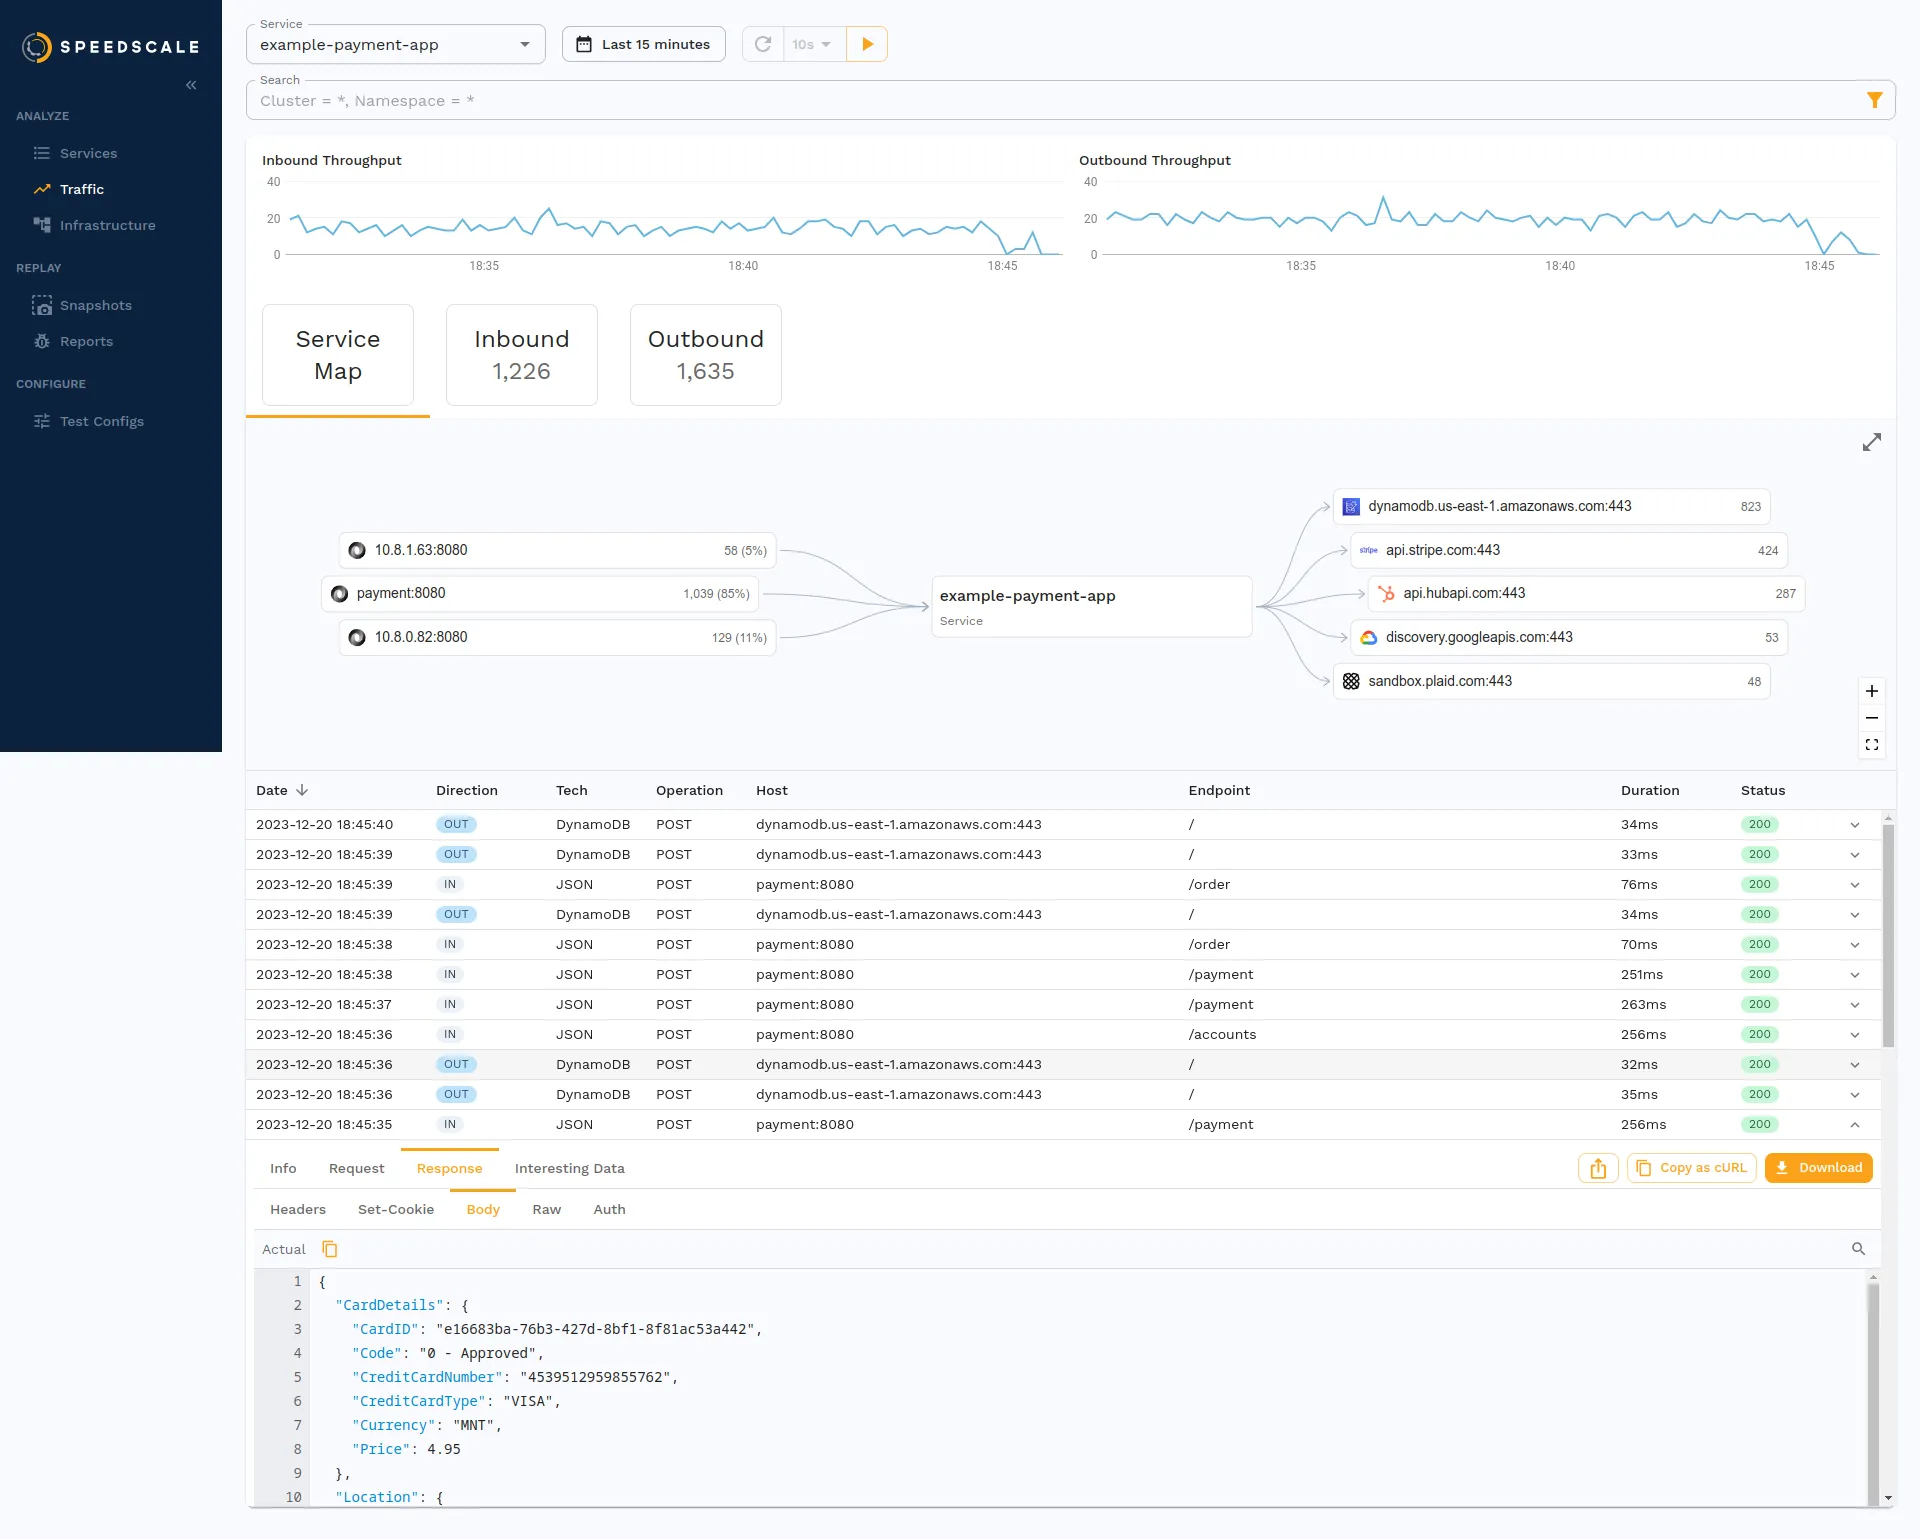
Speedscale is a relatively newer tool in the API observability and testing landscape. It’s designed to cater to the needs of modern cloud-native applications. It differentiates itself by focusing on traffic replay and analysis, allowing developers to understand how their APIs behave under real-world conditions.
Speedscale captures traffic in live environments and then replays this traffic in a test environment. It offers insights into API performance and regression, which can help you identify potential bottlenecks, broken API calls for previous versions of your API, and issues in complex interactions. It features a service map that graphically represents the communication paths between the various services your application depends on. It’s designed to be used in complex, distributed architectures often found in microservices and Kubernetes environments.
Ease of Use and Developer Experience
Speedscale is geared towards developers working with complex, distributed systems, yet it provides a clean and well-organized web user interface and a simple CLI application to get started and set up. In some cases, it might have a steeper learning curve compared to more straightforward tools like Postman, but it offers advanced capabilities tailored to its specific use cases.
Ease of Integration
Speedscale integrates well with Kubernetes observability environments and cloud-native applications. It can work as a proxy, like Proxyman and Charles, but for both local and cloud environments. The integration process is streamlined for a wide range of compatible systems, such as Amazon EKS, GKE, AKS, minikube, and more. You can also integrate Speedscale into your CI/CD systems.
Customization and Flexibility
Speedscale offers a high degree of customization, particularly in how traffic is captured, replayed, and analyzed, catering to the diverse needs of microservices and distributed architectures.
Recording and Playback
This is one of Speedscale’s core strengths. It captures real-world traffic from production environments and replays it in test environments, allowing for realistic testing and debugging scenarios rather than just from your local device. You can import traffic data from Postman Collections and many other sources and tools to mock requests and responses for diverse testing use cases.
Traffic Filtering and Searching
Speedscale provides robust filtering and analysis capabilities. It also allows you to pinpoint specific requests or patterns within the traffic data visualized via its cloud-based dashboard. You can filter by hostname, port, protocol, request status code, etc.
Request and Response Inspection
Speedscale offers detailed inspection capabilities for requests and responses, which is crucial for understanding API interactions in a replayed environment. It also has the ability to mask sensitive data from being captured.
Performance Impact on Your App
While capturing traffic, you’ll barely notice any performance impact on your app, even in high-traffic environments, as it’s designed to scale to accommodate and minimize such impact. This is especially effective in cloud-native environments.
Overview
Speedscale is an advanced tool best suited for teams working with complex, distributed systems that need to capture, replay, and analyze real-world traffic to identify various issues outside the typical test cases in a development environment.
!Speedscale API traffic performance analysis
The Complete Traffic Replay Tutorial
Conclusion
This article introduced various tools and compared them based on key factors. tcpdump captures general network traffic, but you’ll need tools like TShark or Wireshark for advanced analysis via PCAP files, which may be less productive for developers focused on their application. Kubeshark is limited to Kubernetes environments, making it less suitable for other contexts. Proxyman, Charles Proxy, and Postman are effective for local client-side debugging but may not offer sufficient insights at scale from the end user and backend/infrastructure perspectives.
Almost all the tools reviewed here are either focused on debugging purposes or general network analysis. However, Speedscale provides insights both for debugging purposes and API traffic analysis. Its strength lies in its ability to provide realistic testing scenarios and detailed analysis based on replaying real-life traffic captured in a production environment.