How to Calculate TPS for Kubernetes Performance
Transactions-per-Second (TPS) is a valuable metric for evaluating system performance and is particularly relevant for engineers overseeing Kubernetes environments. TPS, alongside average response time, provides critical insights into system performance during load testing. This post covers two approaches to calculating TPS; a manual approach applicable in all environments, and an automatic Kubernetes-specific solution using production traffic replication.
Kubernetes manages containers by considering resource requirements, storage systems, and other constraints to achieve the desired state and performance. Providing fast storage and efficient access to data is crucial for containerized applications. Kubernetes projects in the CNCF landscape help address these challenges, and features like the ability to delete or serve resources are helpful for maintaining cluster health.
Additionally, this post will discuss how different variations of TPS impacts the metric’s usability in different scenarios. Understanding the differences in calculation approaches and variations will aid in optimizing your infrastructure and applications in a Kubernetes environment, ensuring optimal performance.
Kubernetes Overview
Kubernetes, often referred to as K8s, is an open-source platform designed to automate the deployment, scaling, and management of containerized applications. As organizations increasingly adopt microservices and container-based architectures, Kubernetes has become the de facto standard for orchestrating these complex environments. Its robust management capabilities allow teams to efficiently deploy and manage applications across diverse infrastructure, whether in the cloud or on-premises data centers.
At its core, Kubernetes streamlines the process of running containerized workloads by handling critical tasks such as service discovery, load balancing, automated rollouts and rollbacks, and resource allocation. This ensures that applications remain highly available and can scale seamlessly to meet changing demand. By abstracting away much of the manual work involved in deployment and management, Kubernetes empowers engineering teams to focus on delivering value and innovation.
The name “Kubernetes” is derived from the Ancient Greek word κυβερνήτης (kubernḗtēs), meaning helmsman or pilot, reflecting its role in steering and managing application workloads. The abbreviation “K8s” is commonly used in the industry, representing the eight letters between the “K” and the “s.”
With Kubernetes, organizations can manage data, configuration, and deployment processes in a unified way, making it easier to maintain, update, and scale containerized applications. This powerful orchestration system is foundational for modern DevOps practices, enabling teams to deliver reliable, resilient, and scalable services at speed.
Understanding Transactions-per-Second (TPS)
Transactions-per-Second (TPS) is a crucial metric in performance testing that measures the number of transactions or requests a system can process within a second. It serves as a key indicator of a system’s ability to handle a large volume of work, making it essential for evaluating the performance of web applications, databases, and other software systems.

In the context of load testing, TPS is used to simulate real-world usage scenarios and measure the system’s response to different levels of traffic. By analyzing TPS, performance testers can identify bottlenecks, optimize system resources, and ensure that the system can handle expected or peak loads.
TPS is typically measured in transactions per second (TPS) or requests per second (RPS). It can be calculated using various methods, including:
- Average transaction response time: This method involves measuring the average time it takes for a transaction to complete and then calculating the TPS based on that time.
- Response time: This method involves measuring the time it takes for a system to respond to a request and then calculating the TPS based on that time.
- Network latency: This method involves measuring the time it takes for data to travel between the client and server and then calculating the TPS based on that time.
In Kubernetes environments, resource requirements and other constraints matter significantly when interpreting TPS results, as they directly impact how workloads are scheduled and managed within the cluster.
Understanding these methods and their implications can help you accurately determine TPS and make informed decisions about your system’s performance.
Manually Calculating Transactions-per-Second

Calculating TPS in a generalized environment is relatively simple: determine how many transactions occur in a time period and divide by the total number of seconds. However, TPS alone isn’t sufficient for useful insights. Several factors can significantly impact how you view and utilize TPS, especially when replicating production conditions to exercise your application or network, such as load balancers or CDNs. In Kubernetes, resource requirements, other constraints, and the desired state of the system all influence how TPS should be interpreted and calculated.
Ramp Patterns
TPS provides moment-in-time insight. Understanding ramp patterns—how load starts and tails down—is essential in providing context to your TPS calculation and realistically simulating production conditions. Depending on your target audience’s geolocation, your load patterns can vary wildly and impact your need for testing. Comparing ramp patterns across the same test can provide valuable insights into system performance.
Experiencing immediate load in production but only testing slow ramp conditions won’t provide useful insights. Conversely, experiencing sustained loads in production but only testing spikes has the same effect, and you could be missing important memory or CPU issues only occurring over long periods of time.
Testing autoscaling often requires an understanding of ramp patterns as it often doesn’t work how people expect—like taking longer to scale up than anticipated—and allows for direct comparisons to production when optimizing your application. Ultimately, understanding your ramp patterns aids in creating a more resilient service, ensuring high availability even under fluctuating conditions.
Determining a baseline ramp pattern from production, you can apply modifications to understand future possible scenarios, e.g., how a 30% increase in the user base will affect application performance.
Sustained TPS
Sustained TPS loads can occur in a variety of scenarios and possibly result in memory leaks, CPU issues, and other critical failures. If your application experienced sustained TPS, it’s essential to replicate this behavior with soak tests.
While spike TPS can indicate some failures, errors like memory leaks might not occur until an hour or two into sustained load, like with caches filling up. Traffic replication is a powerful tool for soak tests as you can record five minutes of traffic, then loop it. This also ensures realistic usage, resulting in valuable and actionable insights.
Realistic load generation is especially crucial in environments with small requests occurring millions of times, such as database queries. The query itself may be small in isolation, but failures happening with thousands of requests per second can have severe consequences. Inducing those kinds of issues with realistic sustained TPS is important. Understanding maximum throughput is essential for ensuring that applications can handle sustained TPS loads.
Sustained TPS can place significant demands on the underlying storage system in Kubernetes environments, making it essential to provide fast and reliable storage to maintain application performance and support persistent data.
Coupling this with detailed monitoring can help set a baseline for how TPS and resource usage correlate, allowing you to experiment with optimizations like the use of connection pooling while ensuring the same or higher level of TPS.

Spike TPS
Spikes in traffic can be the result of events like Black Friday or high-profile media coverage, but may have severe consequences if your autoscaling isn’t prepared for it. You should determine the max TPS encountered in production and verify your ability to scale for it—again requiring you to understand ramp patterns.
Monitoring transaction rate during atypical spike TPS can help measure application resiliency or determine failure behavior during intense traffic spikes. With distributed systems, spike TPS can also be useful in determining how the system dissipates the high load, either with atypical spikes for chaos testing or with realistic spikes during feature development or optimization.
Engineering managers may also invoke spike TPS in testing to aid in developing contingency plans and failure strategies. In the same vein, invoking spike TPS can help set realistic expectations for application behavior during upcoming events, like a new marketing campaign.
When implementing design patterns for resiliency like the circuit breaker pattern, you can invoke spike TPS to stress the application, then monitor if and how the new pattern affects the overall TPS. This can help you understand the tradeoff in performance for improved resiliency, an important consideration during decision-making.
Variability Given Differences in Message Size and Average Response Time
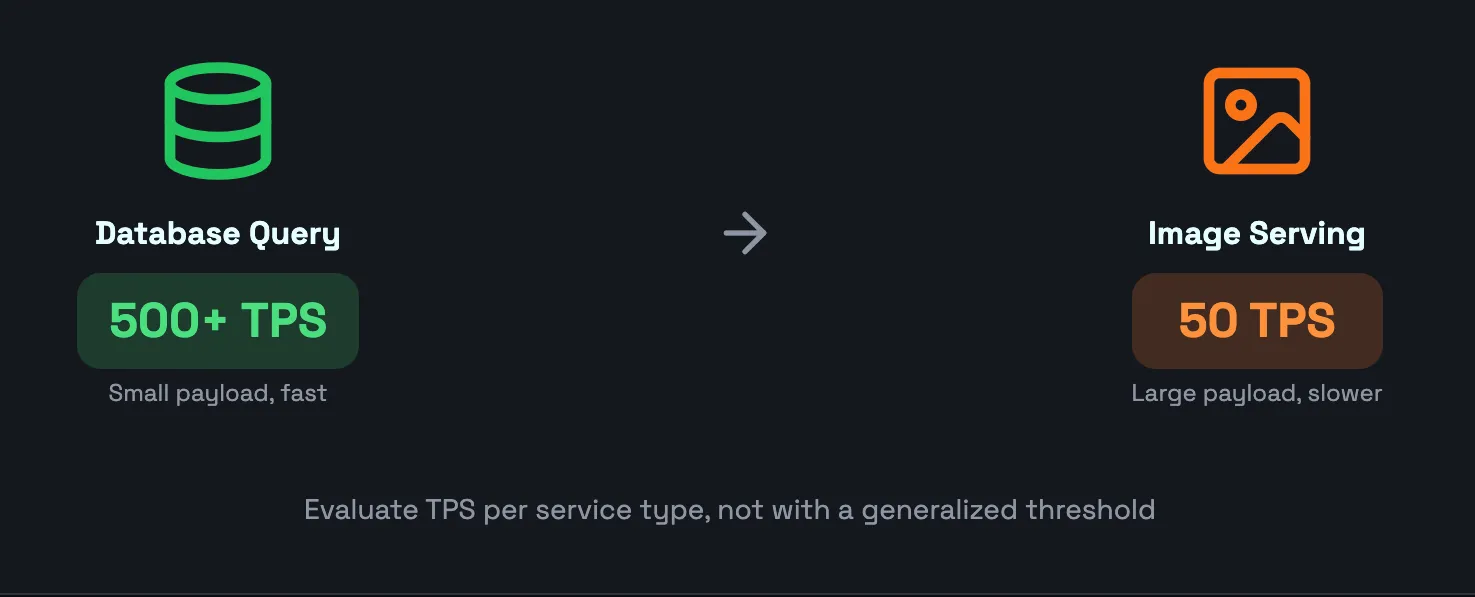
Database queries are processed quicker than serving images due to the variability in message size and is an essential consideration to keep in mind when calculating and monitoring TPS. Larger message sizes can also impact the performance of the underlying storage in Kubernetes, making it important to monitor storage metrics alongside TPS. You should determine the expected TPS of a specific service individually to avoid a false sense of security from higher TPS achieved due to smaller messages, as opposed to evaluating every kind of service using a generalized TPS threshold. 50 TPS may sound reasonable in theory, but in practice, an API may be handling 150 TPS at normal operation. The performance of a web server can significantly impact TPS when processing different message sizes.

Keeping this in mind, you may discover certain processes or components more sensitive to message size, like a content management platform, and implement optimizations or compromises. For example, you could split images into multiple requests with parallel processing or utilize data partitioning.
Production traffic replication can ensure realistic user and backend input, using traffic replication and automatic mocks respectively. Monitoring the TPS of the edge nodes can then help verify whether more images are being served each second while monitoring the resources of your infrastructure, ultimately evaluating the effectiveness of your optimizations, both in terms of user experience and resource usage/cost.
Use of a CDN in Load Testing
CDNs can provide local caching and accelerate load times, resulting in a better user experience. Monitoring TPS during the implementation of a CDN can provide insights into how the overall system performance is optimized.
For insights into how effective the CDN is you can monitor its TPS compared to the real backend, again aiding in decision-making. For example, should you focus on optimizing the backend, or optimizing the CDN usage? If the CDN TPS is significantly higher with no clear or obvious bottlenecks in the backend, it may be beneficial to optimize CDN usage. Conversely, it may indicate the severity of any known bottlenecks.
You may also implement advanced CDN features like serverless functions, and monitor the difference in TPS between cache hits and serverless functions.
If you’re already using a CDN it’s important to keep in mind during testing, as you want to avoid using the TPS calculated based on a mixed usage of the CDN and the real backend, if you only intend to test the service in isolation. On the other hand, you want to ensure that you’re using the user-facing TPS if you do intend to include your CDN as part of testing.
Load Balancers
Properly configured load balancers can optimize TPS by efficiently distributing traffic, with improper configurations possibly causing traffic to be routed incorrectly, negatively affecting throughput. Establishing a baseline TPS can help identify load balancer issues, and load testing with higher TPS can fine-tune balancing rules to ensure stability and resiliency.

Utilize your understanding of ramp patterns along with sustained and spike TPS to verify how your load balancer handles different scenarios, either those experienced in production or those you expect to occur as a result of upcoming changes or events.
This approach can also reveal opportunities for cost savings or resource optimization. For instance, you may discover certain configurations providing similar performance benefits with fewer resources, like routing to different clusters with different configurations depending on the nature of the request.
Some load balancers offer advanced capabilities like SSL/TLS termination or session resumption, which can heavily influence performance. Monitoring TPS along with resource utilization and how they correlate, can provide a better image of the overall performance impact.
Network Latency
Given how the network of your infrastructure affects everything, analyzing TPS changes based on different network configurations can provide useful insights, possibly discovering situations with network congestion. For latency-sensitive applications like real-time communication or online gambling, ensuring optimal network performance is essential.
TPS can also be useful when doing network migrations like moving from HTTP/2 to HTTP/3, or implementing QoS mechanisms, and in comparisons like how Nylas discovered more than 40% better price-to-performance.
Monitoring TPS across different geolocations can aid in deciding whether to expand into more geographically diverse data centers, optimize routing policies, or implement network acceleration techniques like TCP optimization. By replicating real-world production traffic, engineering managers can test these various implementations, proactively addressing network-related performance issues before they significantly impact the user experience.
Limitations of Manual Calculation
Though manually calculating TPS can provide valuable insights and is possible with most metric collection tools, there are important limitations to consider that are inherent to manual calculations. Automated tools and built-in Kubernetes features can be helpful in addressing these challenges, making it easier to manage and scale applications efficiently within a cluster. The above example illustrates the challenges of manual TPS calculation.
Requires Exact Timing
In a workload with your TPS being in the hundreds or thousands, a slight variation in the timing of data can significantly impact the accuracy of your TPS calculations. This can in large part be mitigated with averages or 99th percentiles, but it’s often impossible to get fully accurate numbers.
This variation can result from metric sampling, the effective distance between the service and the monitoring agent, or simply inconsistent metric collection. This inaccuracy may lead to misinformed decisions.
The optimal mitigation strategy is to use an agent living as close to your service as possible like a sidecar, able to capture the exact timing of your requests and allow for filtering out irrelevant data. Using advanced tools may also aid in understanding how TPS correlates between services, like in a microservice architecture.
Requires More Maintenance
Manually TPS calculation adds more configurations that require support and maintenance, potentially affecting your team’s efficiency. Consider what it takes to show TPS on a monitoring dashboard.
Assuming you’ve already collected the metric “request count”, it’s as simple as dividing that metric by the number of seconds in a chosen period. However, this is still another configuration needing to be maintained—and replicated on each dashboard individually—and requires close attention to how data is aggregated, which then has to be replicated precisely in other tools like CI/CD pipelines.
Important questions to ask are: does it only count requests started within the time period? Does it include requests that started but have not finished? What about requests that started before the time period but finished within?
It’s crucial that your system allows full transparency and control over how TPS is calculated.
Possibly Complex in Dynamic Scenarios
In dynamic scenarios, determining TPS for each service instance can become complex. This complexity may impede your ability to monitor performance effectively and make informed decisions about infrastructure needs.
For instance, when monitoring the performance of autoscaling you need to monitor the TPS of each individual instance and the overall system. A dip in overall TPS but no TPS dip in an individual instance may indicate that new instances aren’t spinning up fast enough.
May Prevent Transactions-per-Second Being Included in CI/CD
Though all of the above limitations can result in miscalculations, you may decide a TPS variation of 10 is not too impactful in a service averaging 500 TPS. On a monitoring dashboard this may be true, but can result in unintended failures of CI/CD pipelines.
If your application usually reaches 505 max TPS you may define a goal like, “application must reach 500 max TPS at a minimum”. Then, it reaches 505 TPS, you have a variation of 10, the pipeline reports 495 TPS, and now it fails. Especially if it’s not readily apparent when any variation is present from a miscalculation, this can cause frustration and wasted time in troubleshooting.
Though regression testing has historically been confined to functional testing, including TPS in CI/CD can allow for performance regression testing.
Determining Transactions-per-Second in Kubernetes
Mitigating the above limitations in Kubernetes and ensuring reliable inclusion of TPS in testing can be done with production traffic replication. Automated TPS calculation tools in Kubernetes, such as Speedscale, can take into account resource requirements—like CPU and memory allocations—to help ensure the system achieves the desired performance state. This section covers how Speedscale automatically calculates and reports TPS.
Note that while this doesn’t include a complete overview of how to set up Speedscale, it should still prove useful in showcasing the possibilities available in Kubernetes.
Viewing TPS in Real-Time

Speedscale uses an Operator installed in your Kubernetes cluster, which can be installed either using the speedctl CLI tool or with a Helm chart. This non-intrusive method collects traffic data by instrumenting Pods with a sidecar-proxy and reports it in the WebUI.
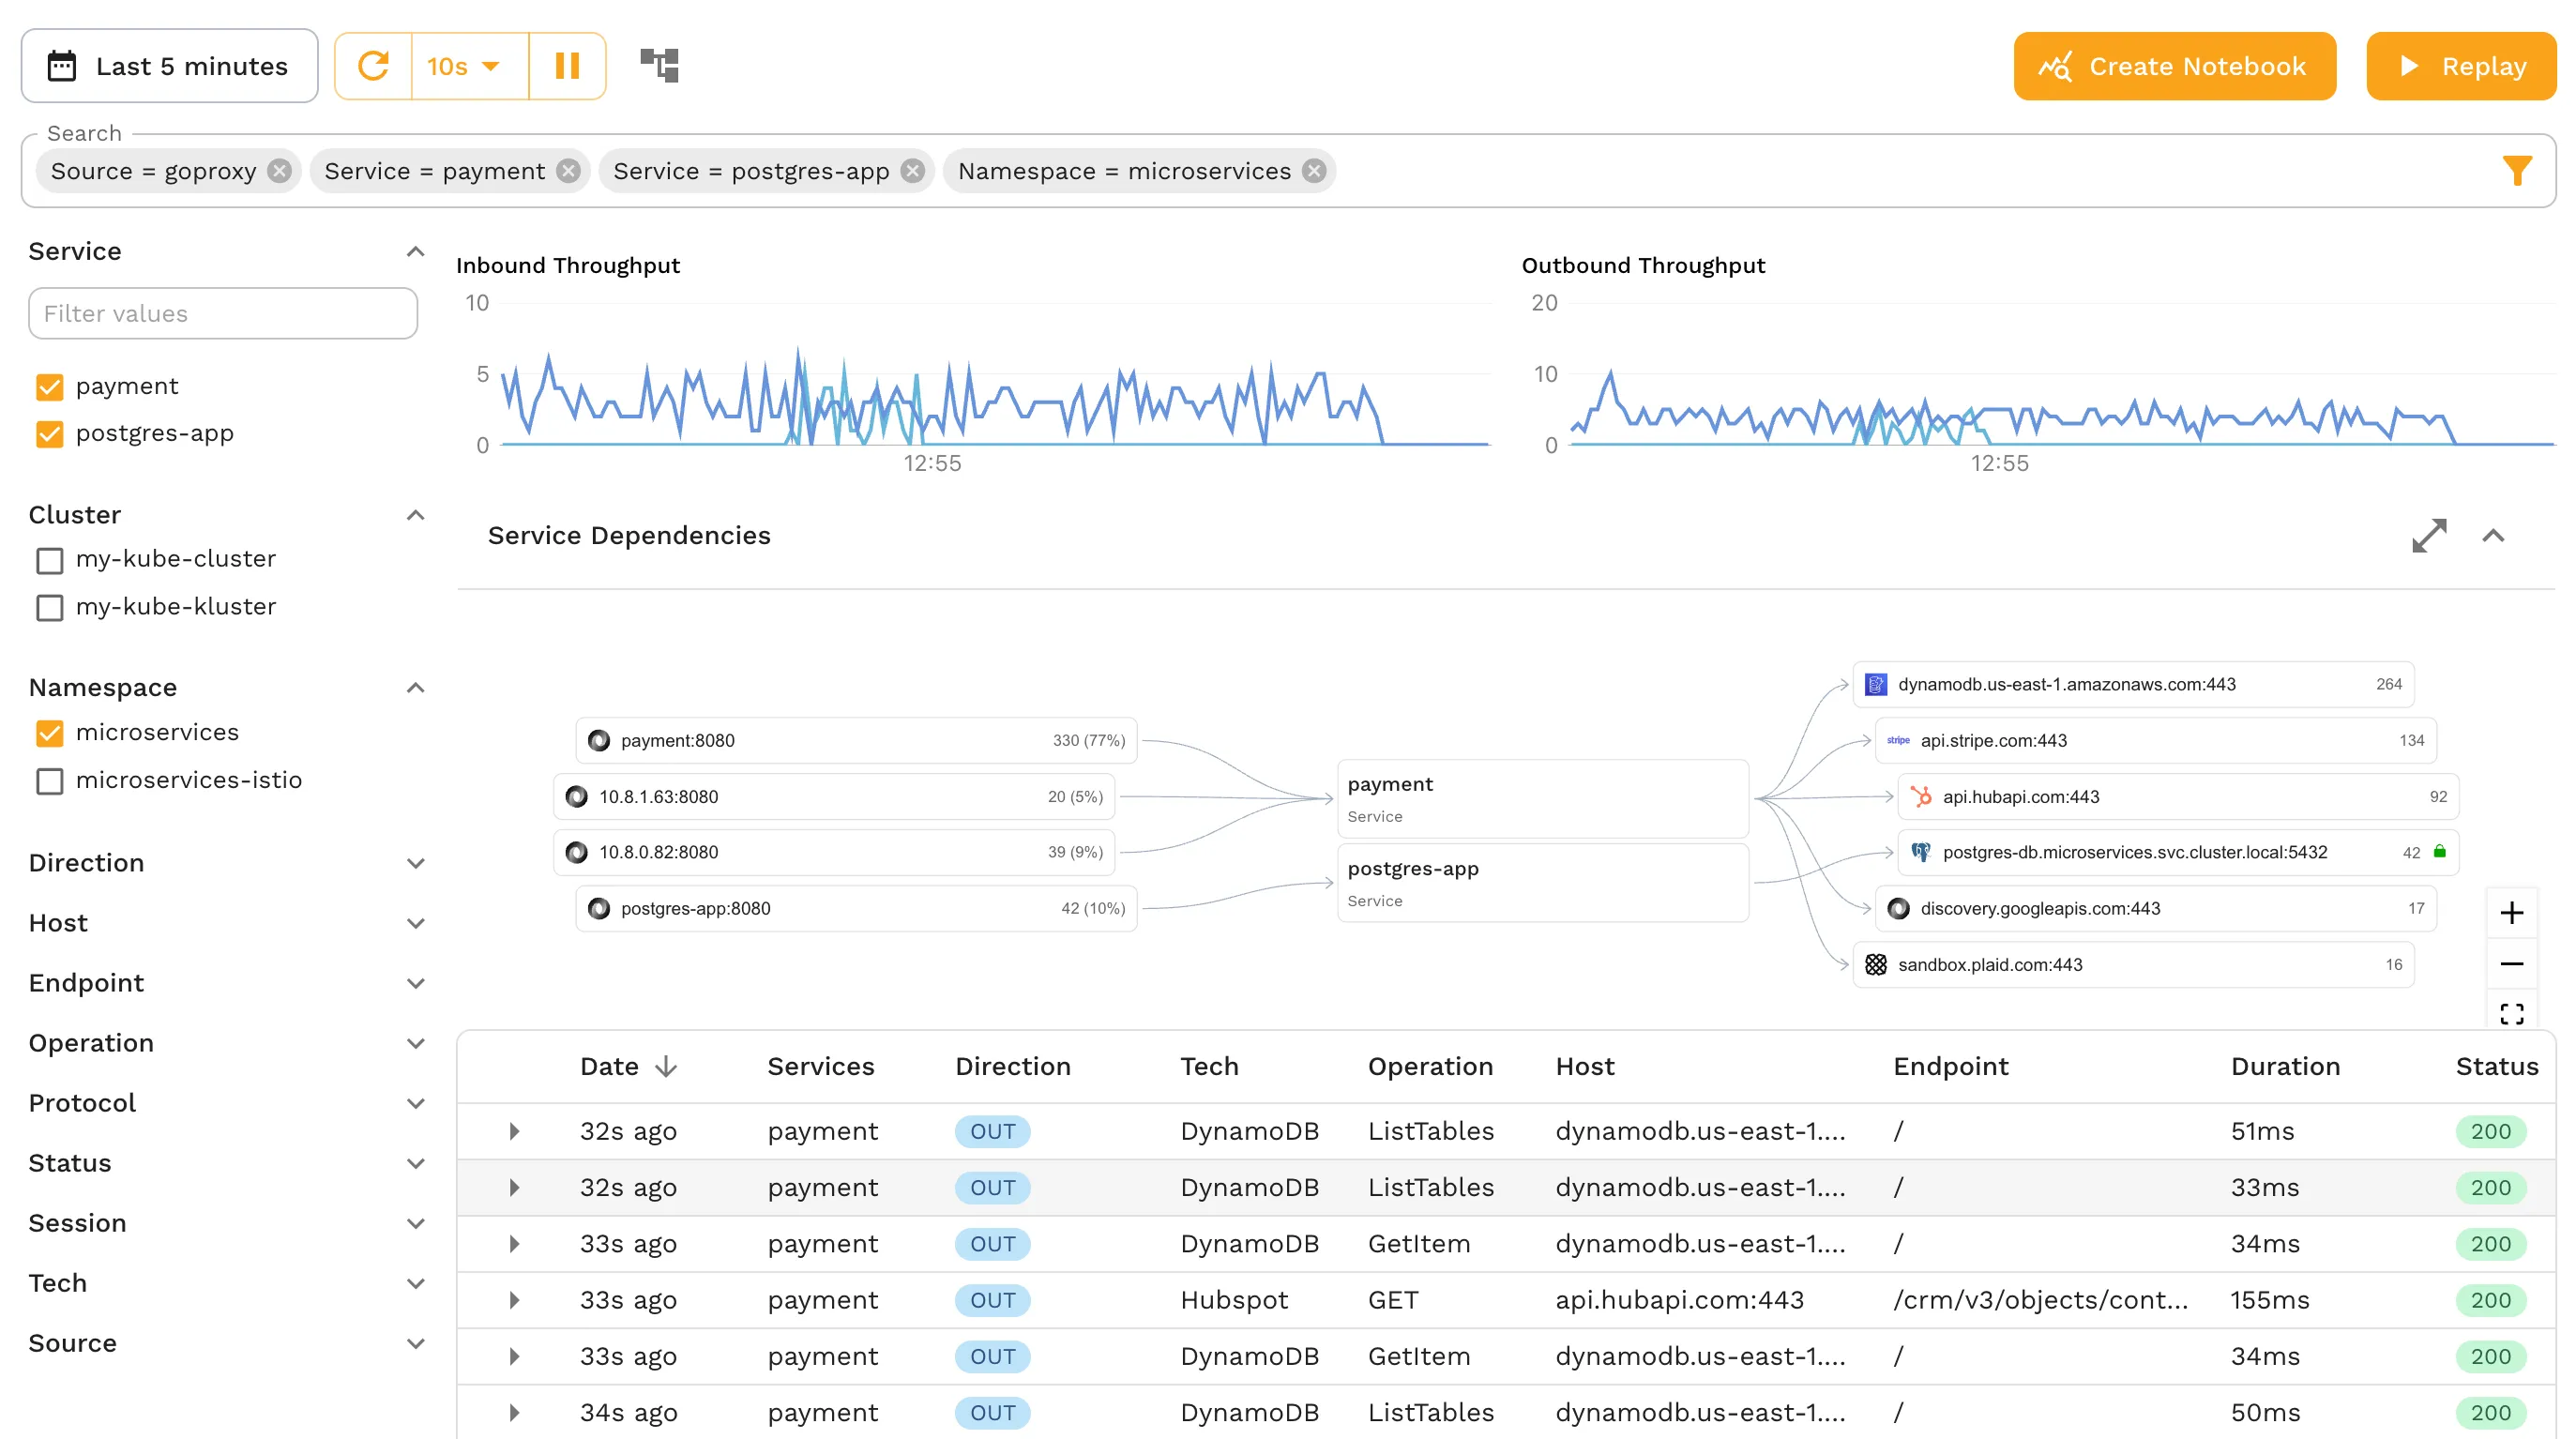
The WebUI presents incoming and outgoing traffic data along with the calculated TPS. As the tool also reports outbound TPS—a feature not often found in other monitoring solutions—you can examine whether performance degradation stems from logic inside the application or from the application’s dependencies.
To view the TPS of a given service, open it in the traffic viewer (seen in the screenshot above) in your Speedscale account, or use the interactive demo. Hovering over the either the inbound or outbound throughput reveals the effective TPS at any given point in time.

This approach of using a sidecar-proxy ensures accurate timestamps, as requests are captured as they enter and leave the Pod, removing possible influences from other parts of your infrastructure, like network latency.
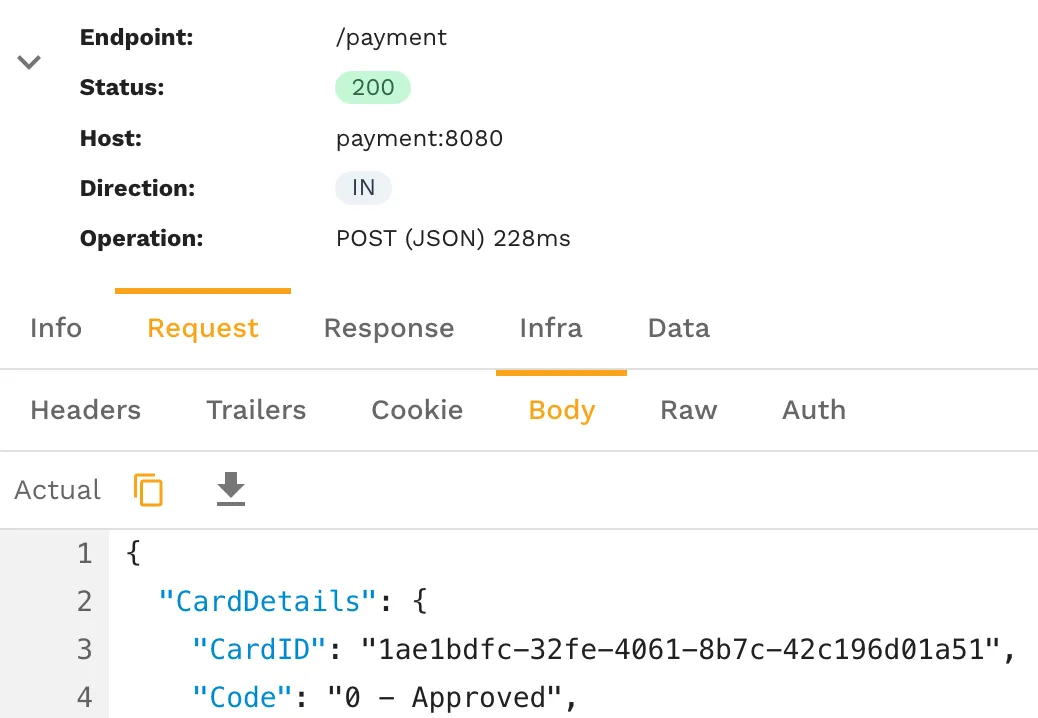
Should you want to manually calculate TPS at any point, this helps mitigate most limitations, like inaccurate timing or lacking control over which requests to include. Each request includes the start time and duration, making it possible to e.g. exclude requests initiated but not completed within the time period.

Including Transactions-per-Second in CI/CD
Leveraging production traffic replication enables load generation in any environment—like staging or development—that simulates production. Running a traffic replay during CI/CD runs, you can set and validate specific TPS goals.

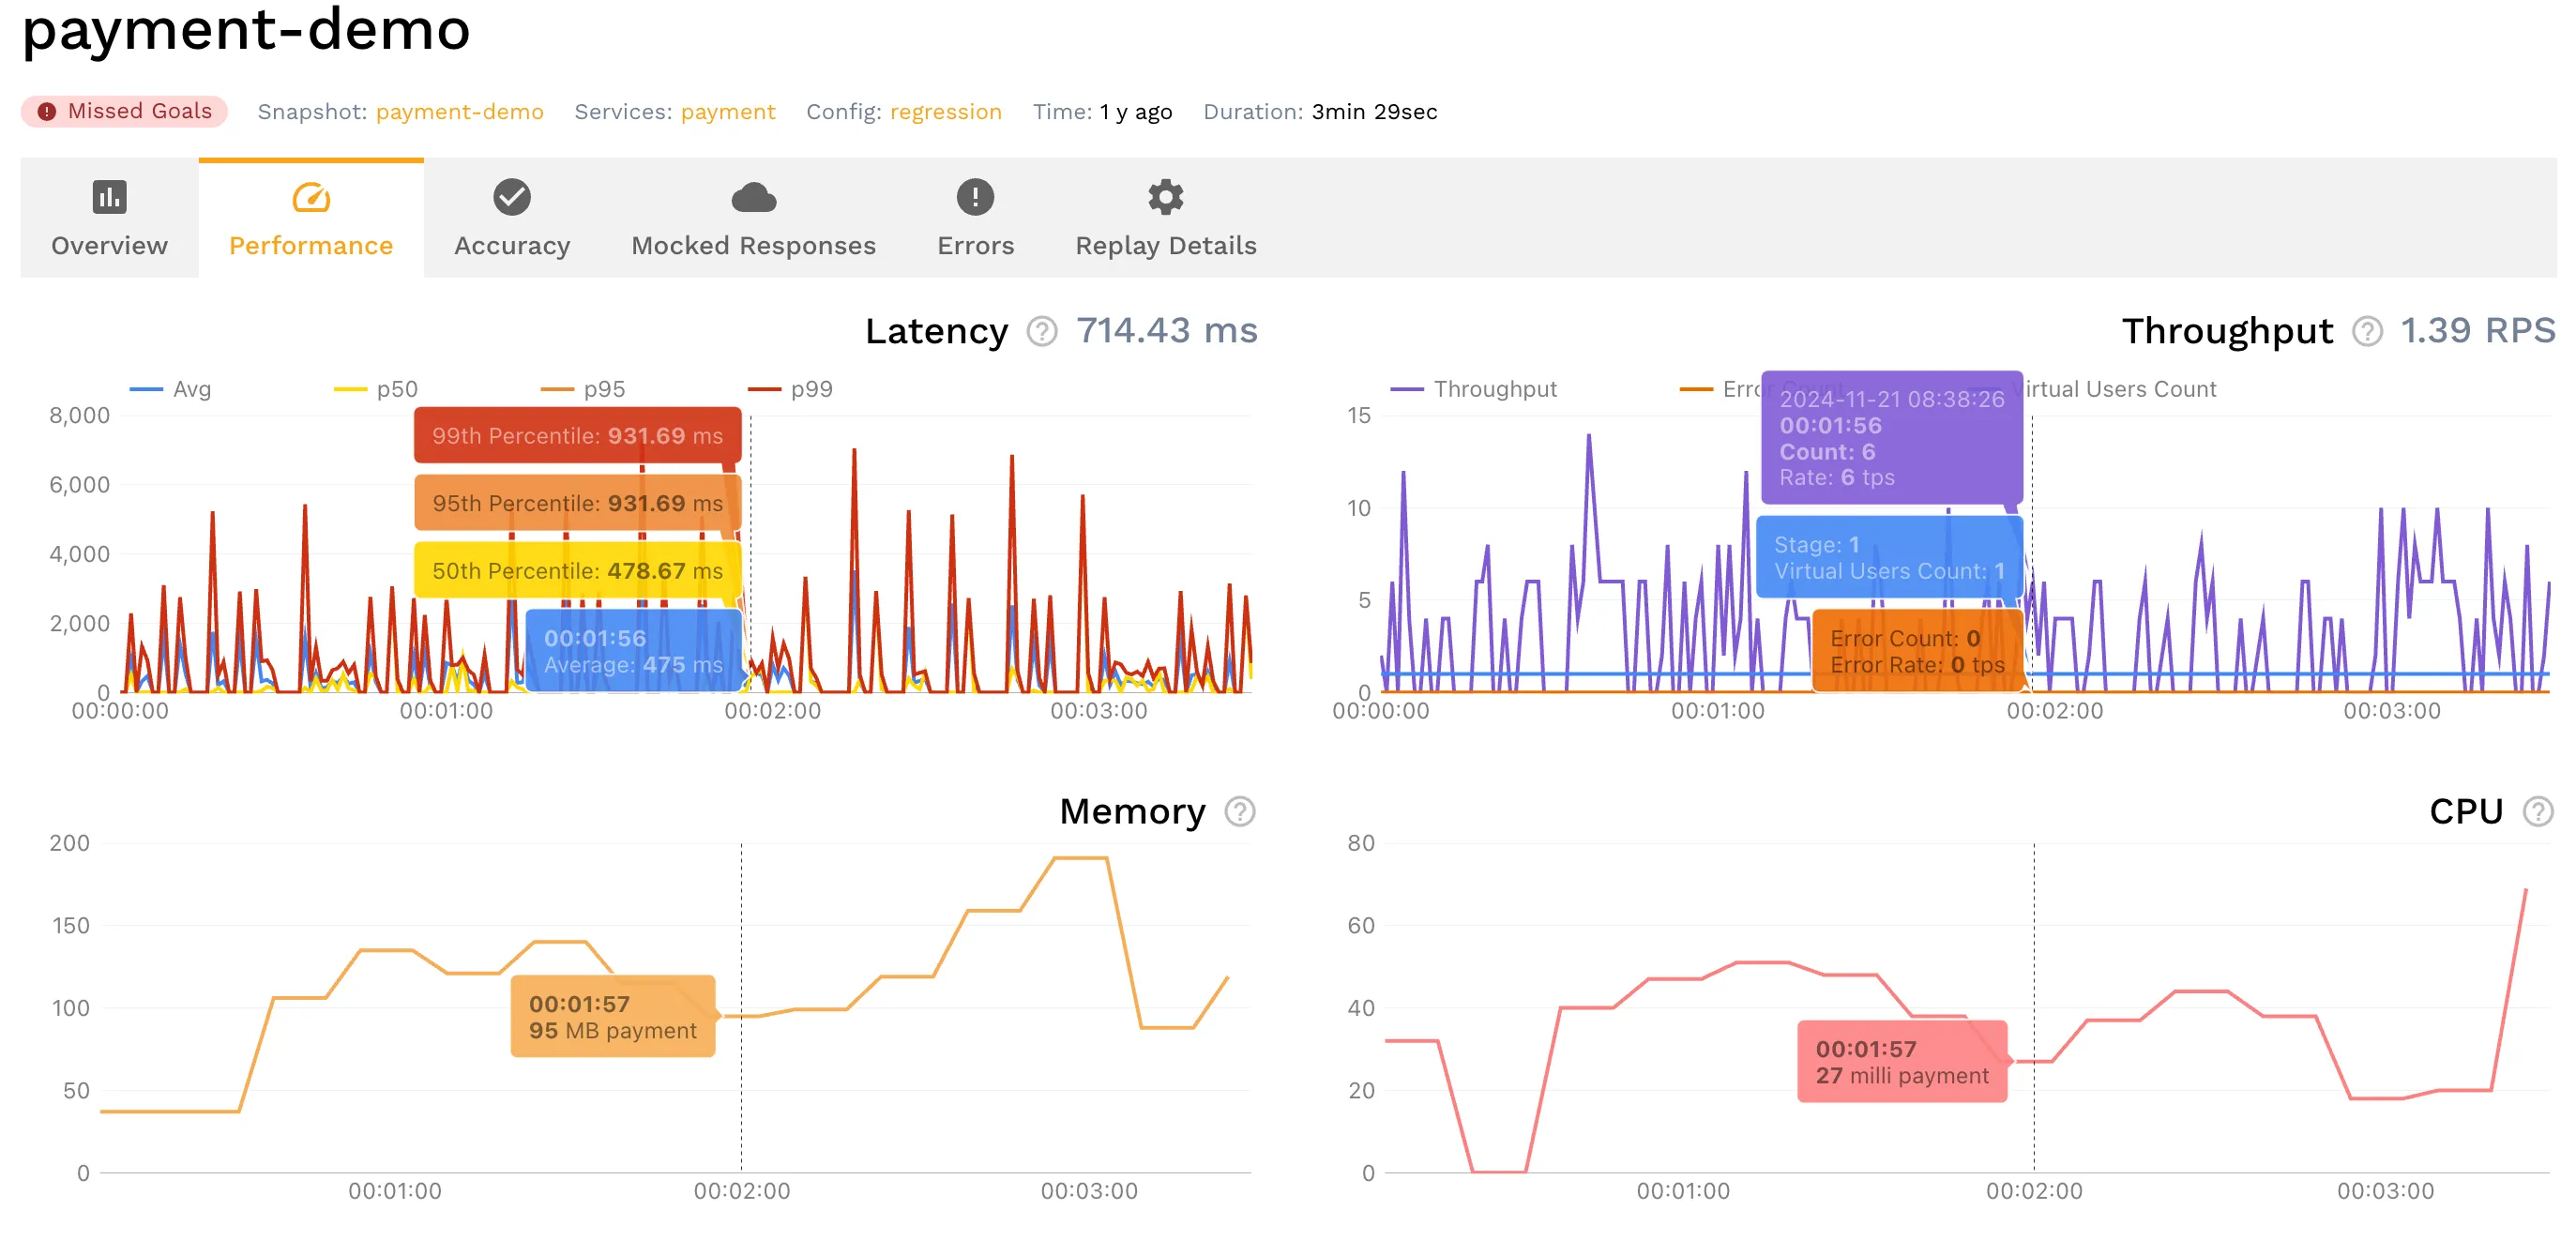
With the TPS being a reported metric in the traffic replay report, this goal can then be validated programmatically with speedctl:
speedctl analyze report f4f7a973-xxxx-xxxx-b316-2f6a6d671c62 | jq '.status'You should see a result such as Passed if it ran well or Missed Goals if the throughput is not met.
Optimization Techniques for Improving TPS in Kubernetes
Achieving optimal Transactions-per-Second (TPS) status in a Kubernetes cluster is essential for delivering fast, reliable services and ensuring the smooth deployment and management of containerized applications. As organizations increasingly rely on Kubernetes to orchestrate complex workloads, fine-tuning your environment to maximize TPS can make a significant difference in both user experience and operational efficiency.
Here are several proven techniques to optimize TPS status in your Kubernetes deployments:
1. Right-Size Resource Requests and LimitsCarefully configuring CPU and memory requests and limits for your pods is crucial. Over-provisioning can waste resources, while under-provisioning may throttle your application and reduce TPS. Use historical data and performance testing to set appropriate values, and regularly review them as your workloads evolve.
2. Leverage Autoscaling for Dynamic WorkloadsKubernetes offers both Horizontal Pod Autoscaling (HPA) and Vertical Pod Autoscaling (VPA) to automatically adjust resources based on real-time demand. By enabling autoscaling, your cluster can maintain a stable TPS status even during traffic spikes or dips, ensuring that containerized applications remain responsive and available.
3. Optimize Deployment StrategiesChoose deployment strategies that minimize downtime and disruption. Rolling updates and canary deployments allow you to gradually roll out changes, monitor TPS status, and quickly roll back if issues arise. This approach helps maintain high TPS during updates and reduces the risk of performance degradation.
4. Enhance Storage and Network PerformanceA fast and reliable storage system is vital for stateful workloads. Use storage classes optimized for your application’s needs, and ensure your network configuration minimizes latency and maximizes throughput. This is especially important for applications with high TPS requirements, as storage or network bottlenecks can quickly impact overall status.
5. Implement Application-Level OptimizationsTechniques such as caching, connection pooling, and efficient request handling can significantly boost TPS. Review your application’s architecture to identify opportunities for reducing unnecessary processing or round-trips, and use tools to monitor the impact of these changes on TPS status.
6. Streamline Access and Permissions ManagementJust as an employment authorization document is essential for verifying work eligibility, managing access and permissions in your Kubernetes cluster is key to secure and efficient operations. Use Kubernetes Role-Based Access Control (RBAC) and service accounts to ensure that only authorized services and users can deploy, manage, or modify resources, reducing the risk of accidental disruptions that could affect TPS.
7. Continuously Monitor and Review TPS StatusOptimization is an ongoing process. Use monitoring tools to track TPS status in real time, set alerts for anomalies, and regularly review performance data. This proactive approach allows you to identify trends, address issues before they escalate, and ensure your Kubernetes cluster consistently delivers the desired TPS.
By applying these optimization techniques, you can enhance the performance and reliability of your containerized applications, maintain a healthy TPS status, and ensure your Kubernetes cluster is ready to meet the demands of modern, high-velocity deployments.
Best Practices for Performance Testing in Kubernetes
Kubernetes is a popular container orchestration platform that provides a scalable and flexible way to deploy and manage containerized applications. Here are some best practices for performance testing in Kubernetes:
- Use a load testing tool that supports Kubernetes: There are several load testing tools that support Kubernetes, including LoadRunner, JMeter, Gatling, and k6. These tools can help you simulate real-world usage patterns and traffic levels in a Kubernetes environment. Several open-source projects in the Kubernetes ecosystem, such as k6 and other CNCF projects, provide advanced capabilities for performance testing and traffic simulation.
- Use a realistic load testing scenario: The load testing scenario should simulate real-world usage patterns and traffic levels to provide meaningful insights into the system’s performance.
- Use a sufficient number of pods: The number of pods should be sufficient to generate a realistic load on the system, ensuring that the test results are valid.
- Use a pacing value: A pacing value can be used to control the rate at which transactions are sent to the system, helping to maintain a consistent load and avoid overwhelming the system.
- Monitor system resources: System resources such as CPU, memory, and disk usage should be monitored during the load test to identify bottlenecks and ensure that the system can handle the load.
- Monitor the storage system: Monitor the performance of the storage system integrated with Kubernetes, especially for stateful workloads. Ensure it can provide fast and reliable storage for persistent data, databases, and root images to support seamless performance in containerized applications.
- Analyze response times: Response times should be analyzed to identify any performance issues and understand how the system behaves under different load conditions.
- Ensure secure access to the Kubernetes API: During load testing, control and manage access to the Kubernetes API by enforcing authentication, authorization, and using TLS to secure API endpoints. This helps prevent privilege escalation and ensures minimum privilege principles are followed.
Some popular performance testing tools for Kubernetes include:
- JMeter
- Gatling
- Locust
- Grafana k6
By following these best practices, performance testers can ensure that their Kubernetes-based applications are scalable, reliable, and perform well under load.
The Importance of Transactions-per-Second in Performance Testing
In summary, understanding TPS is crucial for gauging service and infrastructure performance. Though the TPS calculation formula is straightforward, complexities may arise without the right tools, or not considering the factors affecting the measurement.
In Kubernetes, the flexible nature of the platform allows for deeply integrated solutions like sidecars to capture requests as they happen, ensuring precise and accurate feedback on your system’s performance. Outside of TPS, this implementation can prove useful in various testing scenarios like regression testing or continuous performance testing.