Max throughput is a critical aspect of measuring application performance and stability, determining the threshold at which an application can process requests without compromising on factors like latency. Understanding the maximum possible transactions-per-second (TPS) helps engineering managers gain confidence in the system’s ability to avoid unexpected downtime.
When determining max TPS, it’s vital to consider factors such as ramp patterns, sustained TPS, and spike TPS. Realistically simulating these during testing provides a more accurate assessment of your application’s capabilities, and is discussed in more detail later.
This post aims to offer a concise, step-by-step guide for determining your application’s max TPS using production traffic replication in Kubernetes, along with an understanding of important considerations. By the end, you’ll be able to gain valuable insights and make informed decisions on how to optimize and scale your system.
Why Is Max TPS an Important Metric?
Management may often ask to understand the breaking point of applications in which case engineers must provide an accurate answer, requiring engineers to determine max TPS. Determining max TPS is also often done to aid in decision-making, helping engineers and engineering managers decide on which optimizations to prioritize or what changes are needed to accommodate future changes or events, though results are only truly realistic when replicating production traffic.
Running tests to determine max TPS will reveal whether the infrastructure and applications can handle this and what parts may require optimizations. An expected 20% growth may have teams modify autoscaling rules to spin up 20% more instances, which neglects to verify whether new instances can spin up fast enough.
The many factors influencing scale-up time and readiness require thorough testing to simulate what will happen in production. This testing also creates an understanding of application behavior, removing the fear of spikes, and allowing you to size pods with appropriate headroom to avoid overprovisioning and reduce costs.
Strategies and Considerations for Assessing Max Throughput
Simulating production is the overall strategy and requires an understanding of the tactics needed in order to accomplish it. In general, any test aiming to determine application behavior is done via load generation. However, the points below specify the specific considerations essential to determining max TPS.
Ramp Patterns
Setting an improper ramp time will invalidate the accuracy of any TPS test as application behavior can vary wildly depending on how traffic ramps up or tails down, with different failures showing up at different load patterns.
Consider Ticketmaster putting new tickets on sale. Only validating the case of selling tickets for a popular artist can lead to overly sensitive autoscaling rules, leading to overprovisioning. Conversely, only testing for lesser-known artists may lead to insufficient autoscaling.
Testing different ramp patterns can help determine whether different underlying resources need to change for different scenarios. For instance, could it make sense to use more expensive and resilient nodes for certain artists, and what are the optimal scaling rules outside of new tickets being released?
In summary, understanding and accurately simulating ramp patterns will determine the usefulness of your testing.
Sustained TPS
A memory leak is a common error only revealed when testing with a sustained load, along with many other issues like caching issues. Targeting a specific geolocation will likely mean 10-15+ hours of sustained load, possibly causing failures that are impossible to catch with a 5-minute load test—again, like memory leaks.
Testing with sustained TPS increased the likelihood of catching transient faults. For instance, deadlocks happen when two or more processes are waiting for each other to release resources, and race conditions happen when multiple processes try to access the same resource at the same time. Both failures can happen immediately but are more likely under a sustained load, especially in distributed systems.
Testing with sustained TPS can also reveal cases of resource exhaustion, like reaching the maximum number of concurrent database connections by not terminating connections after use.
Spike TPS
Though TPS testing often aims to simulate existing production scenarios, useful insights can often be had from evaluating sudden surges in traffic. In real life, these can happen due to new product launches, successful marketing campaigns, news coverage, etc.
Invoking spike TPS during testing will help prepare for such events and create a more fully-formed understanding of your application, leading to accurate answers when management asks about response times under various load conditions, identifying when the infrastructure returns to a normal state, or how long it takes to recover from high-throughput-induced crashes.
Spike TPS may also prove useful in continuous integration. Engineering may find it inefficient to run fully-fledged hour-long tests upon each pull request and instead, opt to use spike TPS for quick validation. Then, using realistic ramp patterns and sustained TPS in preparation for new releases.
Correlation
Exclusively monitoring TPS during testing can be useful, but really powerful insights come from correlating it with resource usage. Take a look at the graphs below.
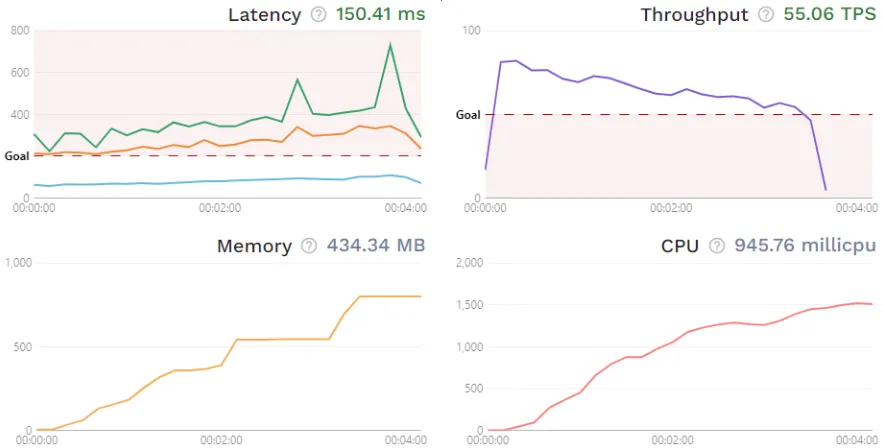
Here, you see the throughput decreasing and latency increasing over time, while memory and CPU usage steadily increases, with the latency 99th percentile (green line) showing spikes near the end of the test. Proper insights are impossible without a full understanding of the application being tested, however, it clearly indicates that engineers may want to investigate resource utilization.
In other words, monitoring TPS is useful for understanding how different load conditions affect the user experience, but bug fixes require you to correlate it with application and infrastructure metrics.
Goals
Though it’s not necessary to set a goal when determining max TPS, it’s a crucial step in getting useful insights. And, establishing your reasoning for those goals can help you configure the test properly. For example, “We’re finding the breaking point in order to prepare for upcoming news coverage” would mean preparing for a very sudden influx of traffic, so you want to test with spike TPS/a very quick ramp-up pattern.
You can be more detailed and continue “…upcoming news coverage during peak operating hours.”, which would require you to ‘warm up’ the service with sustained load first.
How to Determine Max Throughput
Using traffic from production is the only true way of simulating real-world usage. This section showcases how to use production traffic replication to accurately determine the max TPS of your application in Kubernetes, implementing the features found in Speedscale.
Although instructions won’t be given on setting up Speedscale, this section should still build an understanding of the core principles behind the concept. A Speedscale installation of your own is required in order to follow along, however, some features—like clicking around the test report—can be explored in the interactive demo.
Creating Your Own Test Config
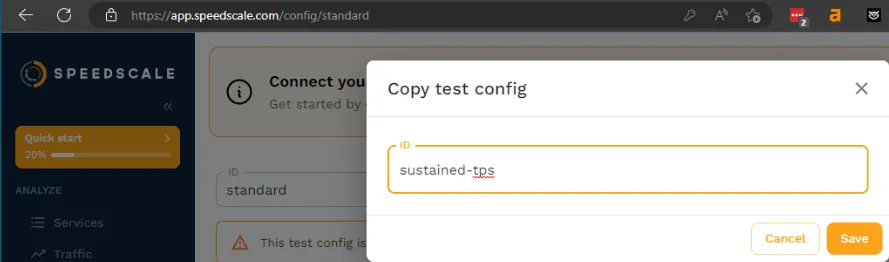
Tests in Speedscale are always done by executing a ‘traffic replay’. All traffic replays need a test config defining the behavior of the load generation, which you can create from scratch, or clone and modify an existing one. For this tutorial, copy the “standard” configuration and name it “sustained-tps”.
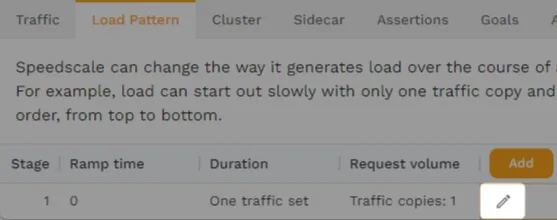
Now, go to the “Load Pattern” tab and edit the existing stage by clicking the pencil icon.
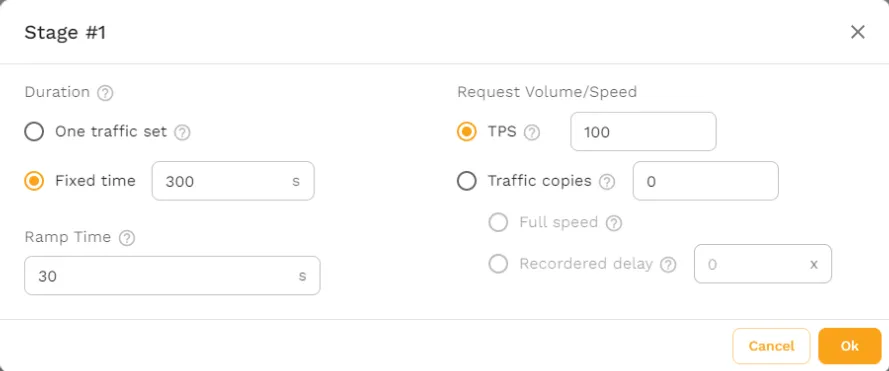
Change the “Duration” to be a fixed time of 300 seconds (5 minutes) and ramp time to 30 seconds. In a real test, make sure that these options accurately reflect production behavior.
Set TPS to 100. The load generation algorithm is auto-tuning and will back off if the application cannot keep up. Because of this, you can in theory set the TPS to be anything—like 10,000—when performing stress tests, just make sure it’s higher than what you expect your application can handle. Now, click “Ok” to save the stage.
For the sake of simplicity, this guide will refrain from modifying other options like “Goals” and “Assertions”, however, you’ll want to set those during real tests. For now, you can view them in your own installation or in the demo. Note that “Goals” and “Assertions” are different in that they are concerned with metrics and requests respectively.
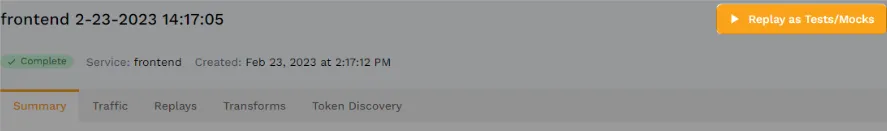
Executing a Traffic Replay
Assuming you’ve already created a snapshot, you can now replay it as a test from the snapshot overview in your installation.
You can also execute a traffic replay with the speedctl CLI tool:
$ speedctl infra replay \
  --test-config-id sustained-tps \
  --snapshot-id <snapshot-id> \
  --cluster <cluster-name> <workload-name>
Whatever the approach, make sure to change the test config to “sustained-tps”. As soon as the replay has started, you can find the accompanying report in the WebUI, although the replay will need to finish before any data appears of course.
Note that the same snapshot can be replayed many times with different configs, allowing you to validate different load patterns based on the same traffic.
Analyzing the Report
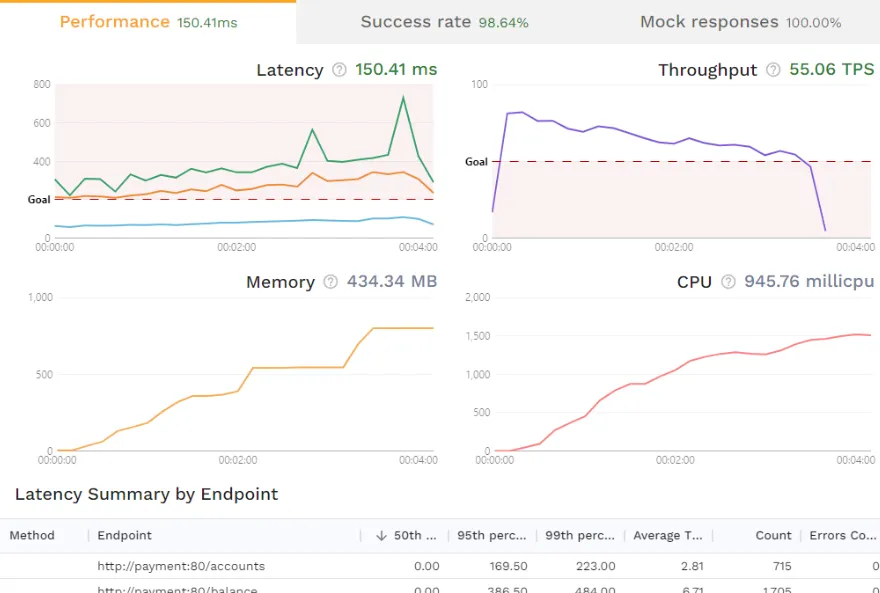
Once the replay is done and the results have been analyzed, you’ll be presented with an overview of the latency, throughput, memory usage, and CPU usage, with an additional latency summary by endpoint below.
This overview alone should provide a high-level understanding of how your application performs, and how that performance correlates to resource usage. The “Success rate” tab provides insight into how well the responses from the service under test align with what’s recorded from production. Here you can dig into the actual resiliency of the application under various load conditions.
Lastly, the “Mock responses” tab shows how many outgoing requests were sent to the mock server, a very useful feature within the tool.
Increase Efficiency With Automatic Mocks
By default, all test configs in Speedscale utilize automatic mocks to isolate the Service-Under-Test (SUT). In practical terms, a new Pod is spun up as a mock server and the sidecar proxy then redirects traffic to the new Pod. This avoids depending on third-party dependencies that may be rate-limited and ensures realistic input during testing from both the user and the dependencies, while retaining the realism of inter-Pod communication.
This automatic approach to mock servers is essential in creating realistic tests, as well as in other use cases like preview environments.
Getting Useful Insights From Real Traffic
By now, it’s hopefully clear why max TPS is such a valuable metric to determine, and why it’s not as simple as just ramping up traffic until your application breaks. From here, you can explore the different possibilities with test configs and start validating your own applications. One possibility is to utilize multiple stages and maintain a sustained TPS for a set amount of time, then induce spike TPS with another stage to determine application behavior if traffic surges during normal operations—like sudden news coverage.
Once you’ve determined your testing methodology, you’ll likely want it implemented in a continuous manner, helping you catch errors early in the development process.