
Load testing is one of the most common ways to test the resiliency of your web application. In this k6 tutorial, we reveal how recording production data with Speedscale and exporting to k6 gives you maximum benefits. Implementing performance tests with both tools allows you to:
- simulate traffic spikes
- verify the resiliency of both applications and the infrastructure as a whole
- implement production data simulation
Speedscale + k6 tutorial overview
When it comes to load testing, two of the most modern tools are Speedscale and k6. While there are many reasons for choosing one over the other, there are more benefits to using them together. If you want to know what the main differences are, check out this in-depth comparison.
By default, Speedscale integrates directly into your Kubernetes cluster with their Operator. k6 is an open source load testing tool that is more commonly used on its own, run on your local PC.
In many organizations there are several good reasons for integrating a load testing tool directly into your infrastructure, such as the ability to integrate with your CI/CD pipelines, plus, a Kubernetes Operator isn’t much more work to manage.
On the other hand, there may be times when you don’t require a fully integrated system, and you want to load tests directly from your PC instead. This is where k6 comes into play, and we’ll explain why, exactly, this is useful for your test case later.
First, let’s break down why you’d want to implement load testing for your test case in the first place.
What is load testing?
Load testing is a type of performance test that determines how well an application performs when subjected to an anticipated number of users. While load testing is done most commonly via HTTP requests, more advanced tools like Speedscale and k6 will also work with other protocols like gRPC.
This might make load testing seem simple, but there are many ways to maximize the benefits. For example, Speedscale allows for production data simulation – this means you can record real production traffic, which you can then replay for load tests.
Depending on the test case, proper load testing should also consider other scenarios such as: mocking the backend, transforming authentication headers, etc.
Why combine k6 and Speedscale?
With k6 load tests, you can run test execution on a local PC (whatever your test case may be, like k6 load testing, performance testing, stress testing, smoke testing, browser testing), whereas Speedscale is more focussed on integrating with your entire infrastructure.
In practical terms, this means Speedscale can be used as part of a development workflow, but it also means your development applications have to run in a Kubernetes cluster. If you’re using other tools like Skaffold, this is not an issue. Many organizations, however, still have developers run applications directly on their local hardware, and in those cases you still want the ability to perform load tests.
So, why use k6 with Speedscale?
Well, k6 cannot record production data, so you will have to create the tests yourself. This can be useful if you have specific scenarios that you want to replicate, but it’s not ideal when you want to ensure that your overall application responds properly to real-life traffic.
By recording production data with Speedscale and exporting it to k6 load tests, you can run a load test from your own PC using real-life production traffic – the best of both worlds.
“In less than 3 hours I was able to fully load test our core services. Without Speedscale, this same project last year took an entire sprint to complete” – Jeff Kwan, Principal Software Engineer, Cimpress
Speedscale + k6 tutorial
Now that you know why k6 and Speedscale are so great together, it’s time to try it out. You can sign up for a free 30-day trial of Speedscale, and start pairing it with k6 yourself. For instructions, follow along with our Speedscale + k6 tutorial below.
Learn how Cimpress used recorded traffic to reduce load testing time by 80%
Exporting Speedscale snapshots to k6 load tests
This tutorial will guide you through creating a load test with Speedscale, and then exporting it to a k6 test.
Objectives
- Deploy a demo application to Minikube
- Instrument application with Speedscale
- Create a load test
- Export and run it with k6
Set up Minikube
- Install Docker
- You can either choose to install Docker Desktop, or you can install Docker via the following script:$ curl -fsSL https://get.docker.com -o get-docker.sh$ sh get-docker.sh
- Add user to the Docker group
- Usually docker needs to be run as sudo, but there is a way to circumvent this, which will make following this tutorial a lot easier. The following command will add your user to the docker group, allowing you to run it without sudo.$ sudo usermod -aG docker $USER && newgrp docker
- Download and install Minikube
- Installing Minikube can be done in a few different ways, depending on what operating system you’re using. If you’re on MacOS or Linux and have Homebrew installed, you can run:$ brew install minikube
- Start Minikube$ minikube start
- Verify Minikube installation by viewing all pods:$ kubectl get pods –all-namespaces
Deploy a demo application
- Clone the demo repo and go to the nginx example $ git clone https://github.com/speedscale/demo.git && cd demo/nginx
- Deploy the demo application $ kubectl apply -k ./
- Verify the deployment
- Open a connection to the gateway service $ kubectl config set-context –current –namespace=demo # Change the Namespace $ kubectl port-forward svc/gateway 8080:80 # Open a connection to the service on port 8080
- Open a new terminal window $ curl localhost:8080/payment # Your output should resemble the following:{“args”: {},”headers”: {“Accept”: “*/*”,”Host”: “httpbin.org”,”User-Agent”: “curl/7.81.0″,”X-Amzn-Trace-Id”: “Root=1-63579d10-6fe42b9457164dcb1252bf31″},”origin”: “34.142.77.110”,”url”: “https://httpbin.org/get”}
- Close the terminal window and close the connection by pressing CTRL+C
Set up Speedscale
NOTE: These instructions can also be found at the top of the Speedscale UI dashboard, which is also where you’ll find your API key.
- Sign up for a free trial of Speedscale
2. Install the Speedscale Operator
- Add the Helm repo$ helm repo add speedscale https://speedscale.github.io/operator-helm/ && helm repo update
- Install the Operator (be sure to replace the API key)$ helm install speedscale-operator speedscale/speedscale-operator -n speedscale –create-namespace –set apiKey=<api-key> –set clusterName=demo-cluster
3. Install the speedctl CLI$ sh -c “$(curl -sL https://downloads.speedscale.com/speedctl/install)”
- If you are running on Linux without a display, you may run into an error after inputting your API key. If so, simply ignore the error and continue with the next step
4. Instrument the services with Speedscale $ speedctl install
- _ _
- ___ _ __ ___ ___ __| |___ ___ __ _| | ___
- / __| ‘_ \ / _ \/ _ \/ _` / __|/ __/ _` | |/ _ \
- \__ \ |_) | __/ __/ (_| \__ \ (_| (_| | | __/
- |___/ .__/ \___|\___|\__,_|___/\___\__,_|_|\___|
- |_|
This wizard will walk through adding your service to Speedscale. When we’re done, requests going into and out of your service will be sent to Speedscale.
Let’s get started!
Choose one:
- Kubernetes
- Docker
- Traditional server / VM
- Other / I don’t know
- Quit
▸ What kind of infrastructure is your service running on? [q]: 1
✔ Checking Kubernetes cluster access…OK
✔ Checking for existing installation of Speedscale Operator…OK
Now add the Speedscale sidecar to your services to capture traffic.
https://dev.speedscale.com/?popupId=addNewKubernetes
Thank you for using Speedscale!
Looking for additional help? Join the Slack community.
https://slack.speedscale.com/
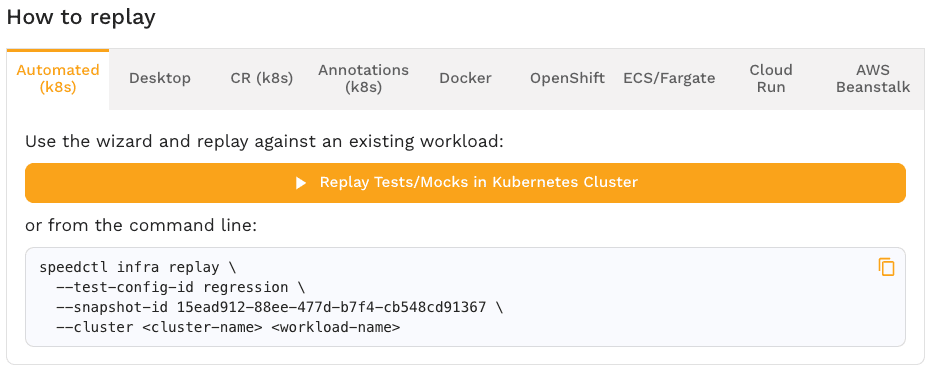
Kubernetes traffic replay:
how it works
Generate load
- Deploy the Job found in the demo repo$ kubectl apply -f job.yaml
- Wait a few minutes for the traffic to be generated and sent to Speedscale
- Enter the Speedscale UI
- Click the payment service
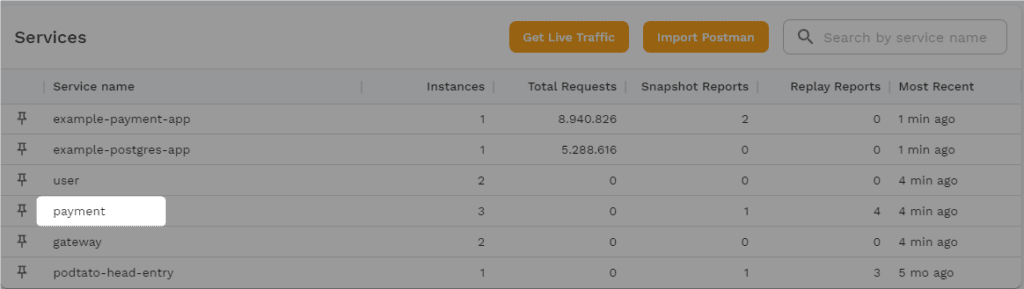
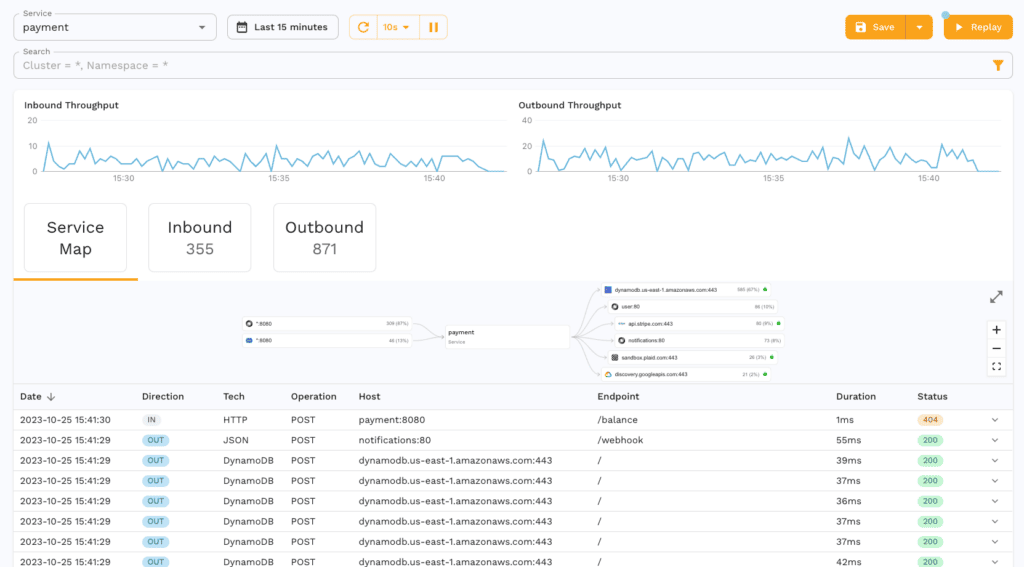
5. Now you should be able to see an overview of the traffic that was just generated
Generate snapshot
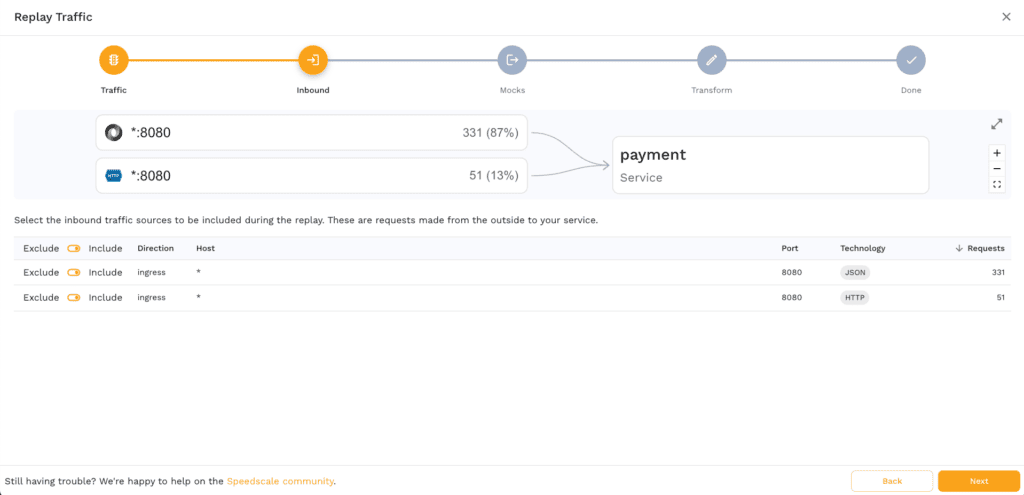
- From the service page, click “Save” in the upper-right corner

2. By default, this will choose the traffic from the past 15 minutes. Click “Next” to continue

3. Click “Next” again to choose all the incoming traffic
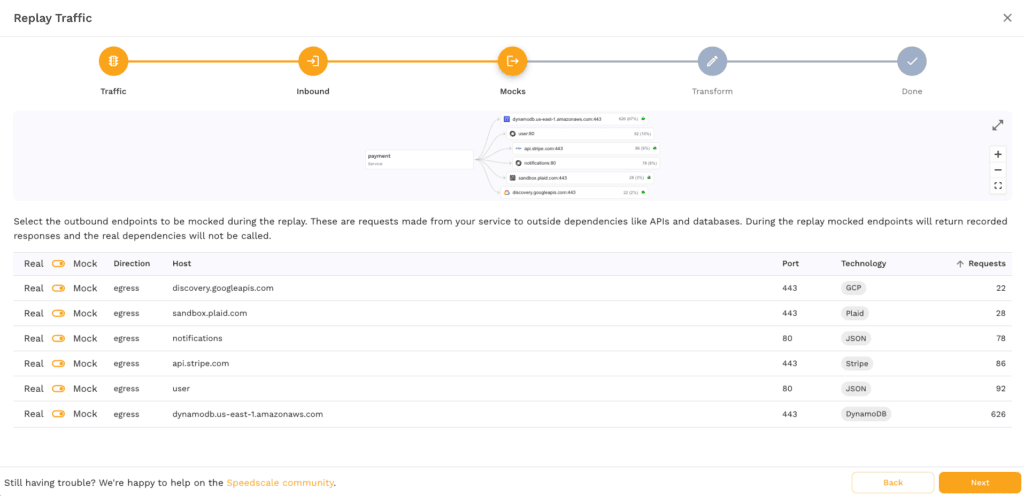
4. Click “Next” again to tell Speedscale that all outgoing traffic should be mocked
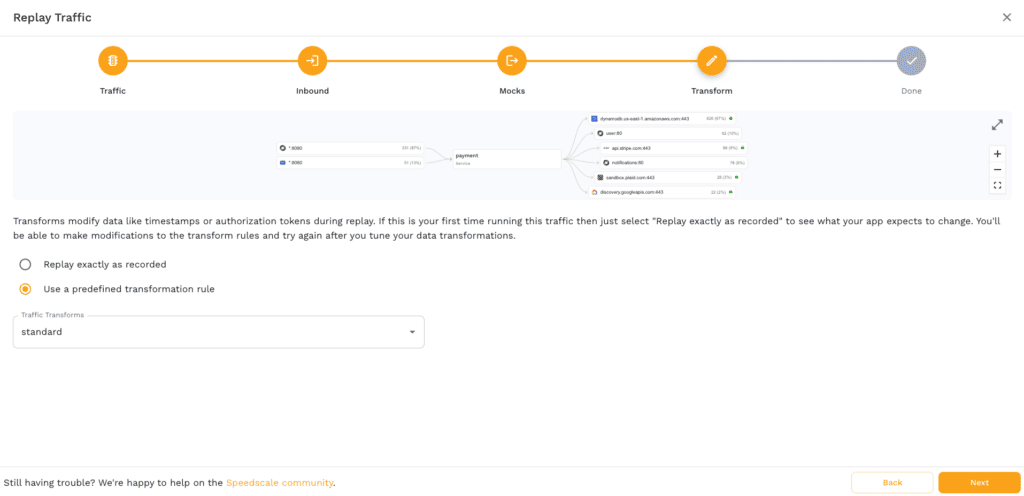
5. Select “Use a predefined transformation rule” and pick “standard’ from the traffic transformations. Then click “Next”.
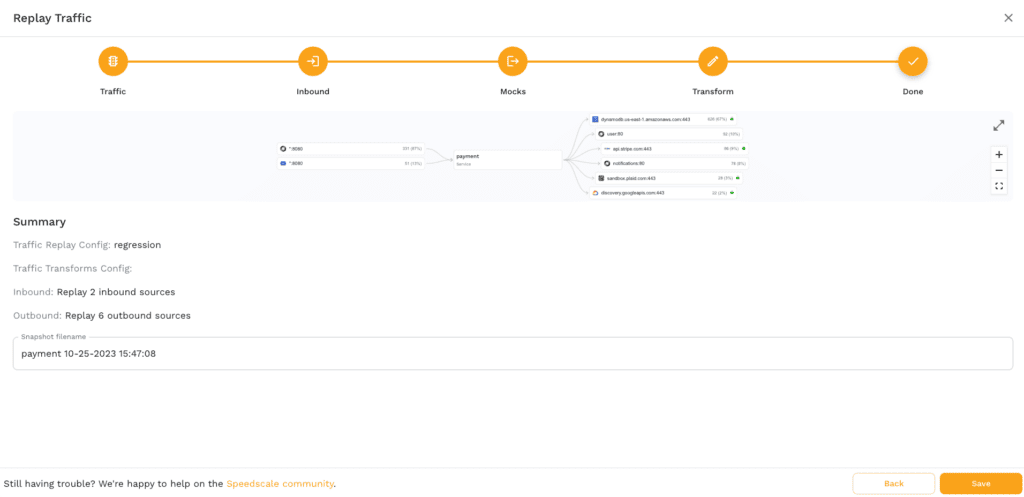
6. Click “Save” to finally save the snapshot
A developer’s guide to continuous performance testing
Set up k6
Before you export your performance test script from Speedscale, you need to install the k6 tool to run test execution. If you’re running Debian/Ubuntu, run the commands below to install k6. If you’re on another operating system k6’s website has official installation instructions for your OS’s package manager.
sudo gpg -k
sudo gpg –no-default-keyring –keyring /usr/share/keyrings/k6-archive-keyring.gpg –keyserver hkp://keyserver.ubuntu.com:80 –recv-keys C5AD17C747E3415A3642D57D77C6C491D6AC1D69
echo “deb [signed-by=/usr/share/keyrings/k6-archive-keyring.gpg] https://dl.k6.io/deb stable main” | sudo tee /etc/apt/sources.list.d/k6.list
sudo apt-get update
sudo apt-get install k6
If you’re using Docker, there is an official docker image for the k6 tool as well. The official docker image can help streamline your Docker deployments.
Note that the k6 CLI runs your k6 script, not Node.js, despite k6 tests being written in JavaScript or TypeScript.
Export and run a load test to k6
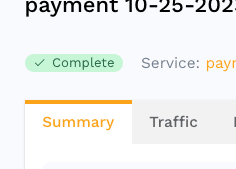
- Wait for the snapshot generation to complete. This can be verified in the upper-left corner
2. Note the snapshot ID in the lower-right corner
3. Use the snapshot ID to export the load test to a k6 file:$ speedctl export k6 <snapshot-id> ./k6-test.js
Your ./k6-test.js file should have an http.request for every route in the virtual user code
import http from “k6/http”;
import { URL } from ‘https://jslib.k6.io/url/1.0.0/index.js’;
export default function () {
{
let params = {
headers: { ‘Accept’:’*/*’, ‘Authorization’:’Bearer …’, ‘User-Agent’:’curl/8.3.0′ },
};
let method = ‘GET’;
let body = ”;
let url = new URL(‘http://java-server/spacex/launches’);
http.request(method, url.toString(), body, params);
}
// …
}
4. Run the k6 test
- Set up a tunnel to the payment service$ kubectl port-forward svc/payment 8080:80
- Change the k6 test file to use the tunnel instead of the Pod’s hostname$ sed -i ” ‘s/payment/localhost:8080/g’ k6-test.js
- Run the k6 test$ k6 run k6-test.js
- /\ |‾‾| /‾‾/ /‾‾/
- /\ / \ | |/ / / /
- / \/ \ | ( / ‾‾\
- / \ | |\ \ | (‾) |
- / __________ \ |__| \__\ \_____/ .io
- WARN[0000] The source for `file:///Users/jwstanly/speedscale/demo/nginx/k6-test.js` needs to go through babel but is over 256000 bytes. For performance reasons source map support will be disabled for this particular file.
- execution: local
- script: k6-test.js
- output: –
- scenarios: (100.00%) 1 scenario, 1 max VUs, 10m30s max duration (incl. graceful stop):
- * default: 1 iterations for each of 1 VUs (maxDuration: 10m0s, gracefulStop: 30s)
- ………….: 124 kB 1.9 kB/s
- ……………..: 907 kB 14 kB/s
- ……….: avg=431.23µs min=277µs med=376µs max=2.64ms p(90)=513.4µs p(95)=575.39µs
- …….: avg=266.19µs min=171µs med=248µs max=1.23ms p(90)=328.4µs p(95)=356.39µs
- ………: avg=234.33ms min=77.37ms med=187.19ms max=960.88ms p(90)=413.5ms p(95)=586.4ms
- ………..: 100.00% ✓ 273 ✗ 0
- ……..: avg=173.67µs min=88µs med=136µs max=3.83ms p(90)=207.4µs p(95)=250.99µs
- ……….: avg=168.07µs min=74µs med=116µs max=4.27ms p(90)=251.4µs p(95)=369.59µs
- ..: avg=0s min=0s med=0s max=0s p(90)=0s p(95)=0s
- ……….: avg=233.99ms min=77.14ms med=186.91ms max=960.63ms p(90)=413.23ms p(95)=585.79ms
- ……………..: 273 4.235477/s
- ……..: avg=1m4s min=1m4s med=1m4s max=1m4s p(90)=1m4s p(95)=1m4s
- …………….: 1 0.015515/s
- …………………..: 1 min=1 max=1
- ……………….: 1 min=1 max=1
- running (01m04.5s), 0/1 VUs, 1 complete and 0 interrupted iterations
- default ✓ [======================================] 1 VUs 5s/10m0s 1/1 iters, 1 per VU
Optional: Run on k6 Cloud
k6 Cloud is k6’s premium commercial SaaS offering for managing k6 tests and optimizing performance engineering. To deploy a k6 test script to k6 Cloud, start by signing up for an account on the k6 Cloud platform. Once registered, you can upload your exported k6 test script and configure things like the total number of virtual users and VU code. k6 Cloud provides real-time insights and performance metrics like response times, making it easier to identify bottlenecks and optimize your performance engineering.