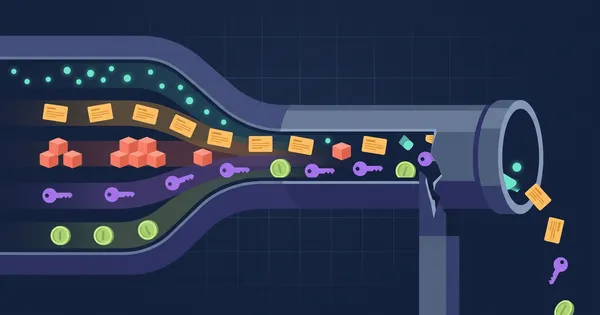
Five Ways to Use OpenTelemetry Beyond Observability
Teams run inventory, security logs, request routing and billing through OpenTelemetry. Five non-observability uses, and the failure mode of each.
Co-founder and CTO of Speedscale, expert in Agentic AI and cloud data warehousing. • 9 posts published
Teams run inventory, security logs, request routing and billing through OpenTelemetry. Five non-observability uses, and the failure mode of each.

Part 10 of Getting Started with Mocks: use proxymock to record real API traffic, inject failures, verify side effects, and expose contract drift.

Security controls rarely break a banking platform alone. Their cumulative divergence from Kubernetes standards creates a compounding maintenance tax.

See why reliability engineering must span code, testing, telemetry, and incidents as AI agents erase the boundary between pre-production and production.
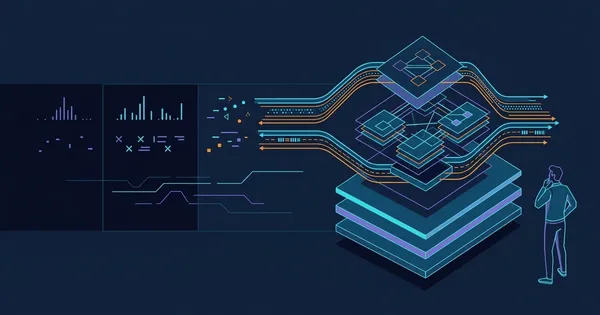
Compare eBPF, sidecars, telemetry agents, OpenTelemetry, APM, and proxies through an evolving ladder of production visibility.
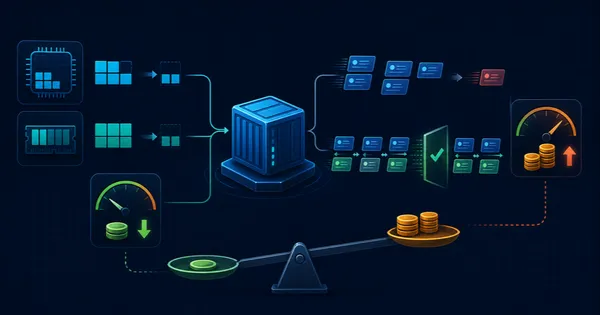
Use OpenCost and proxymock to prove Kubernetes rightsizing lowers cost per successful request without hiding behavior or throughput regressions in testing.
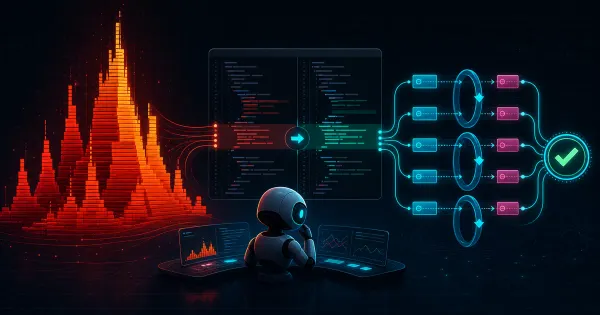
Use Grafana Pyroscope and proxymock with an AI coding agent to find a Go CPU hotspot, preserve API behavior, and verify the performance fix.

The best model isn't the smartest — it's whichever should get the next unit of work. Notes from NVIDIA on routing, local models, and the AI factory.
The trace was sampled out. I found the bug anyway — by filtering recorded traffic on the customer's email instead of a trace ID. Here's how to follow one request across four services with no trace IDs and no OpenTelemetry.
Choose the desktop proxymock or the hosted cloud trial to get started.