
At some point, your development team may be considering implementing load testing (also known as stress testing) as part of your software testing process. Load testing validates that your web app is able to withstand a large number of simultaneous users, decreasing the chance that any traffic spikes will bring down your services once deployed.
These stress tests can be highly granular, giving you the opportunity to test run virtually unlimited strategies before they are set into the wild. For example, you might want to test how your autoscaling feature or throttling works against a variety of traffic scenarios – load testing can do that for you.
Today, there are a wide range of tools that are designed specifically to load test Kubernetes applications. These tools can help validate that everything inside your Kubernetes cluster is interacting as you expect.
In this article, you’ll be introduced to two popular load testing tools, Speedscale and Apache JMeter. Speedscale is a production traffic replication platform designed to help developers cost-effectively test and deliver cloud-native software applications, while JMeter load testing is an open source tool developed by the Apache Software Foundation.
This post is the ultimate Speedscale and JMeter Kubernetes starter kit. We will compare their ease of setup, the development experience, their integration into CI/CD, and how well their documentation is structured.
Ease of setup
First, we’ll take a look at how easy each tool is in terms of getting it set up.
Setting up Speedscale

To get started with Speedscale, simply sign up for an account. With their 30 day free trial, you have access to the entire Speedscale platform. Once you’ve signed up, you will be presented with a Quick-Start guide that explains the installation process while introducing key features of the tool.
The installation itself can be accomplished in one of two ways:
The first approach uses Helm. The Quick-Start guide will show you what values need to be set, and define the values themselves. This will allow you to copy a simple helm command, so that you can set up Speedscale in just a few minutes.
The second approach is just as easy: Simply download the speedctl CLI tool. Once downloaded, run speedctl install, which will ask you a few questions. Within a few minutes, you will have the Speedscale operator installed.
Setting up JMeter

To get Apache JMeter set up, you first have to download the release file. A prerequisite to running the Apache JMeter testing framework is having Java 8+ installed on your system.
Depending on the OS you’re running, clicking on either one of these files will open up the JMeter GUI. JMeter is not actually installed on your system: rather, it’s a script for you to use. To use JMeter from the terminal or from Powershell, you will have to manually add it to your PATH. One consideration to be aware of is the scalability of the installation procedure as JMeter is typically used to run local load tests.
JMeter is a relatively old application, with the first version launched in 1998. While they’ve done a great job to maintain the tool and ensure it works on any system, it’s clear that not much has been done to meet modern engineering standards.
Running a scalable Apache JMeter test integrated with Kubernetes involves a complex JMeter server setup with a JMeter backend listener and some sort of purpose-built database solution like InfluxDB instance. To run a distributed test, you’ll need to configure your JMeter injectors, containerize your JMeter instances into a docker image, and then set up a JMeter master pod which can then talk to the Jmeter slave pods that run your JMeter scenario folder or JMeter testing plan.
You will need to host this alongside your Kubernetes workload yourself using one of several cloud providers, such as Microsoft’s Azure Kubernetes Service (AKS), Google Cloud Platform’s Google Kubernetes Engine (GKE), or Amazon’s Elastic Kubernetes Service (EKS). JMeter modules don’t always play nice with these systems, and the various JMeter properties you need to configure sometimes can create more complex setups than you might expect.
Speedscale, on the other hand, integrates directly into your Kubernetes environment with a Kubernetes operator, thereby allowing for deeper and more advanced test cases with less effort. There is no JMeter helm chart or yaml file provided by the first party. JMeter also requires manual integrations into other tools, such as a Grafana dashboard.
Developer experience
Next, it’s important to choose a tool that provides an efficient and well-considered developer experience.
Speedscale load testing: developer experience
As with any tool, Speedscale has some specific terms you will have to get familiar with. You will have to learn what a test config is and what it can do, as well as learning what a Speedscale report is. However, this shouldn’t take long, and in a few hours you’ll be ready to start using Speedscale in your infrastructure.
As part of the speedctl install procedure, your applications are instrumented with the Speedscale sidecar. This sidecar will act as a proxy for your service, and record all the traffic going in and out of your web app.
When you then want to create a test, you create a snapshot based on this recorded traffic. This means that you will be getting tests based on actual traffic that’s gone through your cluster, rather than manually creating your tests.
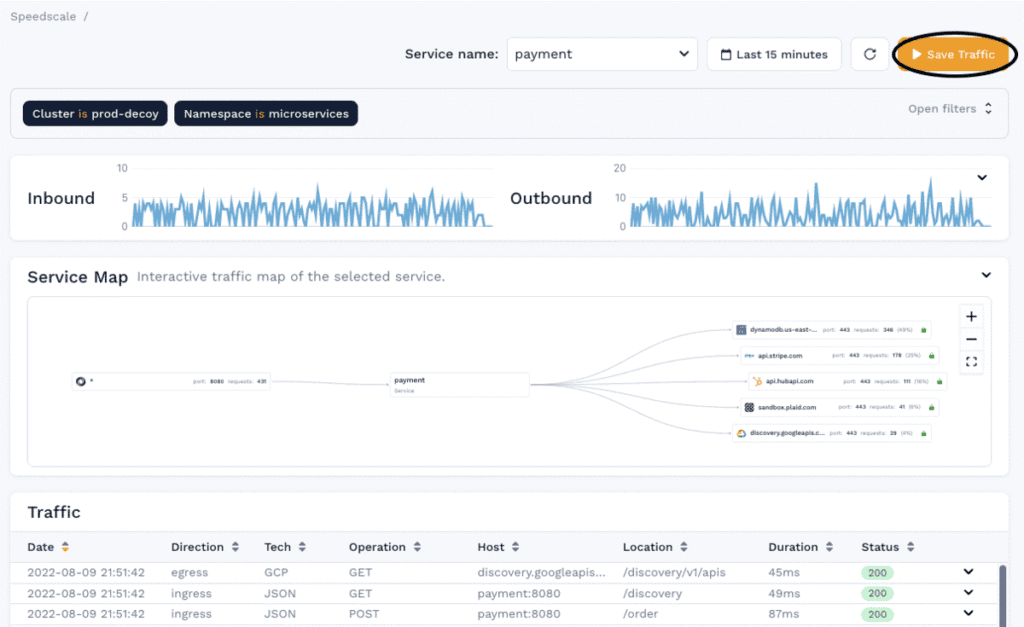
Creating a test in Speedscale is done by using the “Save Traffic” button in the web UI or adding annotations to your Deployment in Kubernetes. It’s up to you whether to use a Deployment that already exists in your Kubernetes cluster or a new Deployment you’ve made. Adding annotations to an existing Deployment makes sense if you want to perform a quick Kubernetes load test, whereas deploying a new Deployment with the given annotations is likely something you will do in a CI/CD pipeline.
All of this adds up to an offering that generates easier reporting, better test results, and an easier to integrate test plan.
JMeter load testing: developer experience
JMeter’s developer experience will heavily depend on your background and what kind of tool you’re looking to use. The tool itself is good and liked by many, for good reason. JMeter load testing has a lot of options you can configure, like the desired number of virtual users, parameters, and much more. However, if you are looking for a tool that’s modern and sleek, and matches the kind of modern principles that you find in Kubernetes, JMeter is unlikely to be your tool of choice.
There are two major reasons for this: JMeter is based on Java, and it relies heavily on a GUI. Both of these are characteristics that don’t fit into a modern DevOps-focused organization. While JMeter does have a CLI tool, most of the documentation you’ll find focuses on creating and configuring tests with the GUI, and then using the CLI tool to run the tests.
With Speedscale, you can either use the Speedscale WebUI, or you can use the speedctl CLI tool. Either option is as good as the other, and the one to use will depend purely on your preference.
Although JMeter supports report generation and generating report dashboards itself, oftentimes users will integrate JMeter into a Grafana dashboard. To integrate into a Grafana dashboard, you’ll need to download the JMeter-InfluxBD-Writer plugin so JMeter can talk to a Grafana dashboard.
Integrating into CI/CD
More and more developers are wanting to shift left, and catch as many performance issues as possible during the development phase, rather than waiting until the application is in production. One of the best ways to do this is integrating performance testing into your CI/CD pipelines. Both JMeter and Speedscale follow the same principles when it comes to CI/CD. To integrate with any CI/CD tool, you will have to run the CLI tool through a shell in your pipeline.
How easily both Speedscale and JMeter handle this, however, differs greatly.
CI/CD integration: Speedscale
With Speedscale, you will find clear instructions on implementing CI/CD for a number of providers. Even if your provider isn’t found in the documentation, it is fairly easy to determine which shell commands need to be run by looking at the documentation for other providers, and thereby getting started with your own.
CI/CD integration: JMeter
There’s no official documentation on how to integrate JMeter with any CI/CD provider. You will be able to find information on how to integrate with Jenkins, however when looking at the documentation, you’ll see that it partially relies on a Jenkins plugin. Because of this, it’s not as easy to transfer the integration instructions to another system.
Documentation
Last but not least, it’s important that proper documentation exists, so you don’t end up with no way of moving forward, should things ever go wrong.
Speedscale load testing documentation
The Speedscale documentation is well organized, clear, and concise so you should be able to find answers to most of the questions you may have.
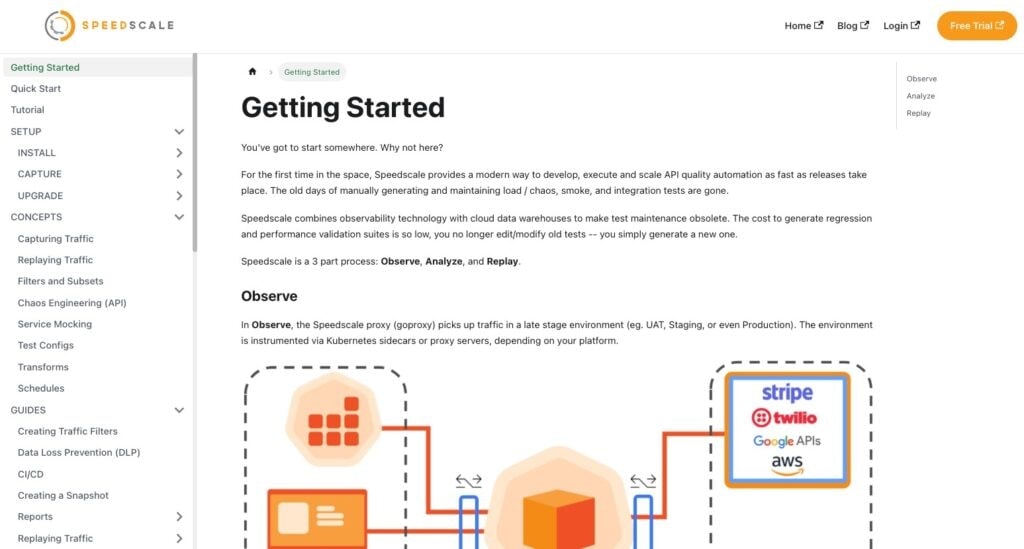
You will quickly see the structure of the documentation, which makes everything easy to find. However, if you don’t want to click through menus to find relevant information, there’s a helpful search button, in addition to a closely monitored Slack Community.
JMeter Load Testing Documentation
The Jmeter documentation is called the “User’s Manual.” The documentation isn’t presented as a Q&A, as you’d find on many other sites. Rather, the JMeter documentation is divided into what are essentially chapters, and you need to read through all the documentation like you would read through a book.
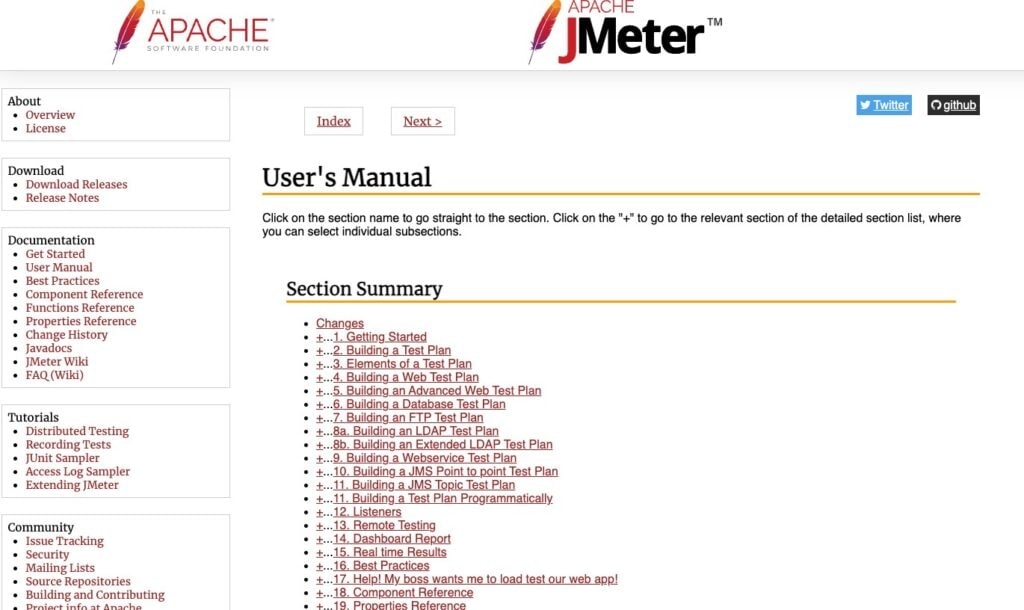
Neither of these approaches is better than the other, but Speedscale’s documentation is definitely more modern, where JMeter gives the impression of a 20-year-old tool that focuses on being solid rather than modern.
What are the Best Tools for Kubernetes Load Testing?
If you’ve set up your infrastructure and want to add load tests, choosing a load testing framework can be tricky. Both Speedscale and JMeter are great options, but Speedscale is one of the best tools for Kubernetes load testing, as it was specifically built for this purpose.
Speedscale is a more modern tool than JMeter, and it works with the same principles as cloud and Kubernetes. Speedscale also integrates more deeply into your infrastructure as a whole, unlike JMeter, which operates on the side. This makes it easier to build, to manage a your repository, to enable report generation with contextual and valuable information, and to ultimately deploy more effectively.
When choosing the best tool for Kubernetes load testing, see how Speedscale compares to k6, Gatling, Locust, and GoReplay: