


Deep capture and inspection
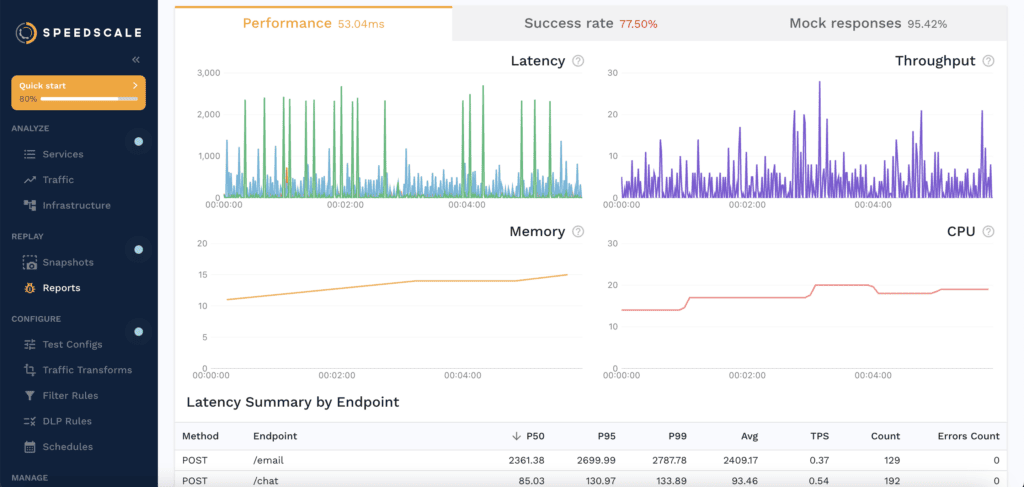
Capture Traffic Context from production workloads and inspect failures at payload-level detail.
Validate AI-generated code with real production traffic before merge.
Speedscale turns observability data into action: deep capture, portable traffic context, AI-assisted debugging, deterministic reproduction, and fix validation before merge.
No credit card required • 5-minute setup • 30-day free trial
FLYR, Sephora, IHG, and platform teams worldwide use Speedscale to validate AI-generated changes against real production behavior before merging.


Observability that ships
This challenger focuses on five core observability capabilities: deep capture and inspection, data portability, AI integration, deterministic reproduction, and fix validation.
Compare monitoring-only workflows with replay-driven validation workflows.
| Capability | Legacy APM | Static analysis | Speedscale |
|---|---|---|---|
| Catches behavioral regressions from AI code | After deploy. Customers see the failure first. | Syntax only. Misses all runtime failures. | Before merge. Replays real production traffic in CI. |
| Shortens the defect feedback loop | Hours to days: alert, triage, reproduce, fix. | Seconds, but misses most AI-introduced bugs. | Fast feedback. Full payload replay catches what static tools miss. |
| Scales with AI-generated PR volume | Dashboards don't review code. | Overwhelmed by AI change set size and complexity. | Automated replay can run on each change in your configured branches. |
| Gives AI agents context to self-correct | No integration with coding workflows. | No production signal. | MCP-native context for Claude Code, Cursor, and Codex. |
Record traffic once from Kubernetes, ECS, desktop, or agent surfaces. Replay it against every branch, every change, automatically.
Find the exact request an AI-generated change broke before it reaches staging or your customers.
Your AI coding agent gets the actual production request that exercises the change. Not a static schema. Not a synthetic stub.
Every pull request gets before/after behavioral diffs so reviewers ship with data, not hope.
Validate AI-generated code against real production traffic. Ship faster and catch failures faster.
Capture Traffic Context from production workloads and inspect failures at payload-level detail.
Move captured traffic between environments, CI pipelines, and teams so observability data can be reused instead of recreated.
Expose Traffic Context to Claude Code, Cursor, and Codex so agents can debug with real production data.
Replay the exact failing production conversation in a controlled sandbox to reproduce bugs deterministically.
Run before/after comparisons on replayed traffic and confirm that each fix resolves the real regression before merge.
AI-authored pull requests can include before/after payload comparisons, latency diffs, and severity scores. Reviewers ship with evidence, not optimism.
Production traffic replay and behavioral diffs, built into your Kubernetes pipeline.
The first deterministic QA Companion for the dynamic nature of production.
AI coding agents fail because they are forced to guess how your APIs behave in a dynamic environment. Speedscale injects real, evolving production traffic directly into your agent's context window.
No credit card required • 5-minute setup • 30-day free trial
From platform engineering to core product teams, Speedscale grounds AI agents in the dynamic reality of production traffic.
The dynamic context gap
Production isn't a document; it's a live, shifting environment. Static context files like CLAUDE.md are obsolete the moment you commit them. Speedscale provides a continuous, dynamic signal from your production environment directly to your AI's inner loop.
Compare how different approaches handle the constantly evolving nature of production context.
| Capability | Legacy APM | Static analysis | Speedscale |
|---|---|---|---|
| Context Freshness | Passive & Retrospective. | Static & Outdated. | Dynamic: A live feed of production reality. |
| Grounding for AI Agents | Sampling only. No bodies. | No runtime behavior. | Grounded: Real-world payloads for every request. |
| Verification Accuracy | Post-deploy detection. | Syntax/Types only. | Deterministic: Replays reality against your change. |
| Stability Impact | Reacts to outages. | Misses runtime edge cases. | Proactive: Fixes the 7.2% DORA 'stability gap'. |
Deep API Inspection: The literal, varied payloads currently flowing through your system, not just an idealized schema.
Grounded Coding: Force your agent to handle real-world edge cases and malformed inputs it would otherwise hallucinate.
Break the stability gap: Close the 7.2% DORA stability gap by validating against reality before every merge.
Shippable Evidence: Attach a passed traffic replay trace to every PR as cryptographic-like proof of quality, closing the 29% trust gap.
Deterministic validation for the age of autonomous agents.
Production is constantly shifting. Speedscale gives your AI agent the literal, varied, and dynamic data combinations currently flowing through your system.
Stop 'Hot Potato' reasoning loops. Binary, deterministic feedback from traffic replay halts hallucinations and saves your API budget.
While RAG merely feeds an agent static documentation, Speedscale feeds it reality. No more 'vibe coding' against outdated Swagger files.
Make your AI prove its work. Every PR includes evidence of passing against 10,000 real production requests, closing the 29% trust gap.
Claude Code, Cursor, and Copilot connect directly to your production reality. They see what actually happens, not just what you *think* happens.
Join the elite teams shipping 126% more projects. Move validation left into the inner loop, directly where your agent lives.
Inject dynamic production context into your AI's context window and validate every change against live reality.