
As developers, one of the most important things we can consider when designing and building applications is the ability to know if our application is running in an ideal operating condition, or said another way: the ability to know whether or not your application is healthy. This is particularly important when deploying your application to Kubernetes. Kubernetes has the concept of container probes that, when used, can help ensure the health and availability of your application. In this post, we’ll explain what container probes are, when and why you should use them, and discuss TCP probes and why you should consider not using them to improve the quality of your application, focusing on the importance of Kubernetes liveness.
What Are Container Probes?
Container probes are diagnostic checks that run periodically against containers within a pod. The outcome of these checks allows Kubernetes to control aspects of a pod’s lifecycle, with kubernetes liveness probes being crucial for maintaining application health. In other words, they can help Kubernetes if a pod is in a usable state and if not, what actions it should take (e.g. should the pod be restarted or not).
Kubernetes provides three types of container probes.
Startup Probes
Startup probes are checks that tell Kubernetes whether or not your application has started. These probes are gating mechanisms for other probes, meaning that Kubernetes will not run other types of probes until these succeed. If a startup probe fails, Kubernetes will attempt to restart it depending on what you have configured as your pod’s restart policy.
You should consider using a startup probe if your application is particularly slow to start or would require a long initial delay or long intervals for a liveness check to succeed. The Kubernetes documentation recommends that if your application takes more than initialDelaySeconds + failureThreshold * periodSeconds to start, then you should use a startup probe.
Readiness Probes
Readiness probes are checks that indicate whether or not your application is in a state in which it can begin receiving requests, working in conjunction with liveness probes to ensure overall application health. Unlike startup and liveness probes, a readiness probe failure doesn’t subject a pod to its restart policy. Instead, failures result in the pod’s IP address being removed from any Kubernetes service to which it belongs.
Without a readiness probe defined, Kubernetes will assume that it can immediately begin sending the pod requests. This behavior may be sub-optimal if your application has started but might not have performed all of the actions it requires to respond correctly. For example, it might be the case that your application needs to operate strictly in a maintenance mode or needs coordinate first with an external service with needs to communicate with an external service first before it can respond.
Using readiness probes in this case can be an extremely useful tool: ensuring that your application receives requests only when it can respond to them can help you deploy and experience zero or little downtime.
Liveness Probes
Liveness probes are periodic checks that determine the ongoing health of your application and tell Kubernetes if a pod is in a usable state or not. Like startup probes, liveness probe failures mean that Kubernetes will terminate a pod and, based on the pod’s restart policy, restart it if a liveness probe fails.
Liveness probes are treated like readiness probes in the sense that if you do not define one, Kubernetes assumes that your application is operating correctly and can continue to receive service requests. You should specify a liveness probe for your container if you would like Kubernetes to automatically remove the pod from service on your behalf.
There are many cases in which this may be preferred, some of which could include your application losing access or a connection to an external service it requires to operate, experiencing an internal error that may not be fatal but increases risk of failure, or becoming unacceptably sluggish when responding to requests. Using liveness probes in these types of instances, like readiness probes, is another tool in helping to ensure zero or little downtime for application.
How Should I Configure Container Probes?
Container probes, including liveness probe configuration, are defined as a part of your application’s pod spec with several options available, most importantly being the mechanism by which they are executed. Kubernetes provides four mechanisms that can be used:
- exec: probes of this type will execute a command within the container itself, failing if the
command returns a non-zero exit code. - gRPC: probes of this type will perform a gRPC health
check request against the container, resulting in a failure if its status is notSERVING. - httpGet: probes of this type will issue an HTTP
GETrequest to a specific location (e.g. port and
path) and will report a failure for any response status code that is not 2XX or 3XX. - tcpSocket: probes of this type will check if a connection can be made to a specified port,
failing if a connection cannot be made.
Each of these mechanisms present their own sets of benefits or drawbacks, and selecting one is entirely subjective based on your application and/or its requirements. However, for the majority of applications, tcpSocket probes provide the least benefit compared to the other mechanisms.
The Problem With TCP Probes
Outside of startup checks, TCP probes provide little if any benefit to assess the ability of your application to respond successfully to new requests or its ongoing health and stability.
Why is that?
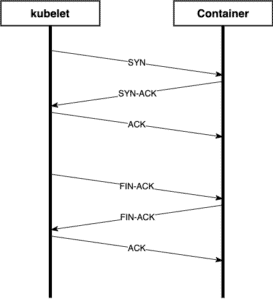
A TCP probe 3-way handshake followed by the connection being closed
As seen above, TCP checks are extraordinarily simple mechanisms for container probes. The Kubernetes kubelet will make the determination that the check will pass if all it can do is open and close a TCP connection. It won’t send any data or expect any in return. This might be a reasonable approach for a startup probe if the application performs long internal tasks before accepting connections, but it fails as a useful check for application health. To see why, let’s look at an example:
Consider a simple HTTP service that listens on port 8080. For the sake of demonstration, assume that this service accepts a request and returns a response after querying an external database, but it is currently experiencing a connection failure.
package main

import (
    "fmt"
    "log"
    "net/http"
)

func main() {
    // perform a health check for application state
    http.HandleFunc("/healthz", func(w http.ResponseWriter, r *http.Request) {
        w.WriteHeader(500)
        fmt.Fprintf(w, "cannot connect to required service")
    })

    log.Println("starting http server")
    log.Fatal(http.ListenAndServe(":8080", nil))
}Note: this is a very trivial example intended only for demonstration. In an actual application such as this it might be reasonable to expect that the app would simply crash on its own and automatically restarted.
TCP Probes Lie
TCP probes cannot take into account any status internally known to the application, making the correct configuration of liveness probe parameters crucial.. In our example, the required database connection cannot be established and despite running, would surface as an outage to users. To demonstrate why this matters, consider the following two programs intended to simulate a TCP probe and an HTTP probe.
First, the TCP probe:
package main

import (
    "log"
    "net"
)

func main() {
    log.Println("checking server via tcp")

    conn, err := net.Dial("tcp", "localhost:8080")
    if err != nil {
        log.Fatalf("service unhealthy: %v", err)
    }
    defer conn.Close()

    log.Println("service healthy")
}
If we run this check, we would get the indication that the service is operational, when in fact it is not:
$ go run probe.go
2022/08/16 16:17:45 checking server via tcp
2022/08/16 16:17:45 service healthy
Liar, liar, pants on fire.
On the other hand, using an HTTP probe:
package main

import (
    "io"
    "log"
    "net/http"
)

func main() {
    resp, err := http.Get("http://localhost:8080/healthz")
    if err != nil {
        log.Fatalf("service unhealthy: %v", err)
    }
    defer resp.Body.Close()

    if resp.StatusCode != 200 {
        body, err := io.ReadAll(resp.Body)
        if err != nil {
            log.Fatalf("unexpected error: %v", err)
        }

        log.Fatalf("service unhealthy, code:%d reason:%s", resp.StatusCode, string(body))
    }

    log.Println("service healthy")
}
We get a clear indication that our service is unhealthy. Kubernetes would automatically terminate the pod and restart it based on our configured restart policy:
$ go run client.go
2022/08/16 16:17:37 service unhealthy, status code: 500
exit status 1
TCP Probes Are Invisible
TCP probes add difficulty to monitoring, due largely in part by the nature of how they work. If you consider our server example above, because our application is using a language-provided HTTP server implementation (as most languages do), we are unable to observe TCP probes and cannot report any data or take any actions based on them, highlighting the importance of pod metadata in managing and monitoring pods.
Most developers are exceedingly familiar with the vast landscape of telemetry/log reporting, visualization, and monitoring tools available today. It is commonplace to report a wide variety of metrics while an application is running, and then use this data to alert on potentially problematic situations.
This becomes particularly important in the event of a production outage or post-mortem, when being able to correlate data and events is absolutely necessary. In our example, it could be very useful to visually see that all of my liveness probes were passing up to and while users experienced service outages. Armed with that information, I could take the necessary steps to ensure that an outage doesn’t repeat itself in the future.
We could of course modify our application in a way that lets us resort to more obtuse metrics like reporting the number or active TCP connections at any point in time. Or worse yet, running rotating packet captures using tcpdump:
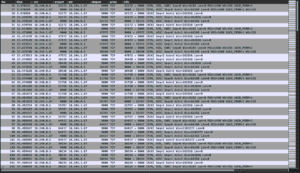
A packet capture of TCP liveness probes
It’s no secret that I’m a fan of pcaps and using them to find problems, but this is a toolset that is just too blunt to provide any meaningful utility in this context. Even for me. You’re better off spending time on more robust tooling that gives the contextual clarity that is necessary in incident triage and post-mortems.
Alternatives to TCP Probes
While TCP probes have their limitations, there are alternative approaches to monitoring container health in Kubernetes. Two popular alternatives are HTTP probes and gRPC probes. These methods offer more detailed insights into the health of your application, allowing for more precise and reliable monitoring.
HTTP Probes for Web Applications
HTTP probes are a popular choice for web applications, as they can be used to check the health of a web server or a specific endpoint. HTTP probes work by sending an HTTP request to a specified URL and checking the response code. If the response code is within a specified range (e.g., 200-399), the probe is considered successful.
HTTP probes offer several advantages over TCP probes, including:
Ability to check the health of a specific endpoint or URL
Support for HTTPS and HTTP/2
Ability to specify a timeout and retry policy
To configure an HTTP probe in Kubernetes, you can use the httpGet field in the livenessProbe or readinessProbe section of your pod spec. For example: livenessProbe: httpGet: path: /health port: 8080 scheme: HTTPS By using HTTP probes, you can gain more granular control over your application’s health checks, ensuring that your web server or specific endpoints are functioning correctly.
gRPC Probes for Microservices
gRPC probes are a popular choice for microservices, as they can be used to check the health of a gRPC service. gRPC probes work by sending a gRPC request to a specified service and checking the response.
gRPC probes offer several advantages over TCP probes, including:
Ability to check the health of a specific gRPC service
Support for gRPC protocol buffers
Ability to specify a timeout and retry policy
To configure a gRPC probe in Kubernetes, you can use the grpc field in the livenessProbe or readinessProbe section of your pod spec. For example: livenessProbe: grpc: service: my-service port: 50051 Using gRPC probes allows you to monitor the health of your microservices more effectively, ensuring that each service is operating as expected.
Best Practices for Container Probes
When using container probes in Kubernetes, there are several best practices to keep in mind to ensure optimal performance and reliability:
Use a combination of liveness and readiness probes: This ensures that your application is both healthy and ready to receive traffic. Liveness probes check the ongoing health of your application, while readiness probes ensure that your application is ready to handle requests.
Configure probe timeouts and retry policies: Properly configuring these parameters helps prevent unnecessary restarts and ensures that your application has enough time to recover from transient issues.
Use probe metrics to monitor health: Monitoring probe metrics can help you detect potential issues early and take corrective actions before they impact your users.
Test your probes thoroughly: Ensure that your probes are working correctly by testing them in different scenarios, such as during application startup, under load, and during failure conditions.
Monitoring Probe Metrics
Probe metrics can be used to monitor the health of your application and detect potential issues. Kubernetes provides several probe metrics, including:
probe_success: The number of successful probes
probe_failure: The number of failed probes
probe_latency: The latency of the probe
To monitor probe metrics, you can use a tool like Prometheus or Grafana. For example: apiVersion: monitoring.coreos.com/v1 kind: ServiceMonitor metadata: name: my-service-monitor spec: selector: matchLabels: app: my-app endpoints:
port: http path: /metrics interval: 10s This configuration creates a ServiceMonitor that scrapes the metrics from the my-app service every 10 seconds. You can then use Grafana to visualize the metrics and detect potential issues, providing you with valuable insights into the health and performance of your application.
Room for Improvement

At this point we’ve seen how Kubernetes container probes can be beneficial to ensuring the overall uptime and health of your application. But we’ve also learned of the dangers and drawbacks to relying only on TCP probes for performing application health checks.
There are many ways to improve upon the drawbacks from TCP probes. The simplest, and potentially fastest, way would be to consider moving your readiness or liveness health checks to one of the higher level protocols like HTTP or gRPC, especially considering the impact when a readiness probe fails. In doing so, you afford yourself the visibility and instrumentation opportunities that you might come to expect from handling any other request.
If you consider the previous example with our HTTP server having an endpoint called /healthz, we already expose the ability to check the health of the application, we just need to tell Kubernetes to use it. Let’s say we have YAML configuration for this app configured with TCP probes:
containers:
- name: my-app
  readinessProbe:
    tcpSocket:
      port: 8080
  livenessProbe:
    tcpSocket:
      port: 8080
All we need is a slight modification:
containers:
- name: my-app
  readinessProbe:
    httpGet:
      path: "/healthz"
      port: 8080
  livenessProbe:
    httpGet:
      path: "/healthz"
      port: 8080
Just changing eight lines of YAML uses our /healthz endpoint for both a readiness probe and a liveness probe and has dramatically increased the app’s robustness.
Second, consider whether or not your health checks are providing the right amount of signal necessary for your production monitoring needs. Did your health checks let you know something was wrong? Did they prevent an outage? Did they cause one?
The good news is observability and production simulation tools like Speedscale can help