Error handling is a critical aspect of software development yet that is often overlooked, particularly when it comes to test suites. When you validate error handling you help ensure the resilience of applications by effectively responding to errors and preventing the entire system from crashing.
This becomes even more complex and challenging when working with Kubernetes, due to its distributed nature. Network issues or overloaded nodes can cause services to fail. By incorporating error handling checks into your test suites, you can identify and address these issues before they impact production systems. Consider the 3-1 positivity ratio, and how every mishandled error exposed to the user, you’ll need 3 good user experiences just to even it out.
Unfortunately, testing often focuses solely on ideal scenarios, neglecting the potential errors that may occur in real-world situations. This approach can lead to unpleasant surprises when the application is deployed, such as unexpected crashes or faulty behaviors.
The Challenge of Error Handling Validation
Error handling validation is a crucial aspect of creating test suites, yet it is often overlooked. This validation is essential for verifying the robustness and resilience of your system to various error conditions.
Kubernetes, with its microservices-based architecture, amplifies the complexity of error handling. A flaw in one microservice can cascade and cause widespread disruptions in the system. This inherent complexity can make it difficult to identify the root cause of errors, making error handling validation a challenging yet crucial task.
To enhance the effectiveness of test suites, you can use production traffic replication (PTR) to provide an environment that closely simulates the complexities of a production scenario, automating the creation of mock servers, and eliminating the need for manual dependency handling.
These mock servers can mimic the behavior of third-party services or other components of the service-under-test, allowing you to focus solely on its error handling.
Understanding Production Traffic Replication
To understand how PTR can be useful, it’s important to understand its core components and their roles. Key aspects include traffic replication, data transformation and filtering, automatic creation of mocks, and easily manageable test configurations.
Data transformation is crucial for testing different combinations of user inputs and ensuring that your application accepts the replayed traffic. Data filtering allows you to focus your tests on specific traffic types or application features by replaying a subset of the recorded traffic. The automatic creation of mocks helps you simulate responses from dependent services, and manageable test configurations simplify the setup and execution of your tests.
When implemented properly, PTR can offer a realistic and comprehensive testing environment that helps uncover potential issues before they impact your production environment. Dive deeper into this topic and learn more about implementing PTR with these resources:
- Record in One Environment, Replay in Another
- Traffic Replay: Production Traffic Replication
- Reduce Risk with Production Traffic Replication
Remember, a well-structured testing approach is only as good as its implementation. Consider the specifics of your application and infrastructure before adopting PTR.
Validating Error Handling With Production Traffic Replication
In this guide, we’ll walk through the process of validating error handling in a simple node.js application using production traffic replication, specifically with Speedscale. This approach allows us to simulate real-world traffic patterns and observe how our application behaves under different conditions.
Note that the following steps are not comprehensive, only focusing on the most relevant steps. For a comprehensive tutorial on how to set up and use Speedscale, check out the complete traffic replay tutorial.
Setting Up a Simple Demo App
First, let’s create a simple node.js application that uses randomuser.me as a third-party dependency to return a list of customers. For the purpose of this guide, we’ll assume that our application currently lacks error handling. Create a new directory with an index.js file, and paste the following code:
The code for this post can be found in this GitHub repo
const express = require('express');
const axios = require('axios');
const app = express();
const port = 3000;

app.get('/customers', async (req, res) => {
  try {
    const response = await axios.get('https://randomuser.me/api/?results=10');
    res.send(response.data);
  } catch (error) {
    console.error(error);
  }
});

app.listen(port, () => {
  console.log(`App listening at http://localhost:${port}`);
});
To get the app working, make sure to install the dependencies:
$ npm install express axiosNow run the app by executing:
$ node index.js
App listening at http://localhost:3000
Open another terminal window (do not close the one with the service running) and test the service:
$ curl localhost:3000/customers
{"results":[{"gender":"male","name":{"title":...
If any errors occur, please check if you’ve copied the code exactly, and if you’ve installed the dependencies. When you get a successful response, the last step is to add the Dockerfile so the service can be deployed to Kubernetes:
FROM node:20

# Create app directory
WORKDIR /usr/src/app

# Install app dependencies
# A wildcard is used to ensure both package.json AND package-lock.json are copied
# where available (npm@5+)
COPY package*.json ./

RUN npm install
# If you are building your code for production
# RUN npm ci --omit=dev

# Bundle app source
COPY . .

EXPOSE 8080
CMD [ "node", "index.js" ]
Now you can build and test the container:
$ docker build -t /error-handling .
bash
$ docker run -p 3000:3000 –rm /error-handling
App listening at http://localhost:3000
Validate the service in another terminal:
$ curl localhost:3000/customers
{"results":[{"gender":"male","name":{"title":...
Then push the image to Docker Hub:
$ docker push /error-handling
Deploying the Demo App
Then, we’ll create a manifest.yaml file for our Deployment:
apiVersion: apps/v1
kind: Deployment
metadata:
  name: demo-app
spec:
  replicas: 1
  selector:
    matchLabels:
      app: demo-app
  template:
    metadata:
      labels:
        app: demo-app
    spec:
      containers:
      - name: demo-app
        image: /error-handling
        ports:
        - containerPort: 3000
Replace
$ kubectl apply -f manifest.yamlInstrumenting the Deployment with Speedscale
Once our application is deployed, we’ll instrument it with Speedscale, which involves adding annotations to the Kubernetes manifest file of our Deployment. Annotations are arbitrary non-identifying metadata we can use to store data helpful to tools and libraries. The Speedscale annotations tell the Operator to start capturing traffic. Here’s how our updated manifest.yaml file looks:
… name: demo-app annotations: sidecar.speedscale.com/inject: “true” sidecar.speedscale.com/tls-out: “true” spec: …
Apply the updated manifest with the following command:
$ kubectl apply -f manifest.yamlGenerating Traffic and Creating a Snapshot
With our application running and instrumented, we can now generate traffic towards it. This can be done using a simple curl command wrapped in an infinite while loop, but first, you need to forward the Deployment’s port to your local host:
$ k port-forward deployment/demo-app 3000:3000Now you can start generating traffic (in another terminal):
$ while true; do curl localhost:3000/customers; doneOnce we have sufficient traffic, we can create a snapshot of it in Speedscale, following the instructions from the traffic replay tutorial.
Validating the Expected Behavior
Now that we have a snapshot of our traffic, we can replay it using the Speedscale CLI. This allows us to validate the expected behavior of our application under the same traffic conditions. Doing this requires the snapshot-id, which can be found in the URL of the snapshot:

Run the following command to execute a traffic replay:
$ speedctl infra replay \
--test-config-id standard \
--cluster  \
--snapshot-id  \
demo-app
Replace
Introducing Chaos and Observing the Application’s Behavior
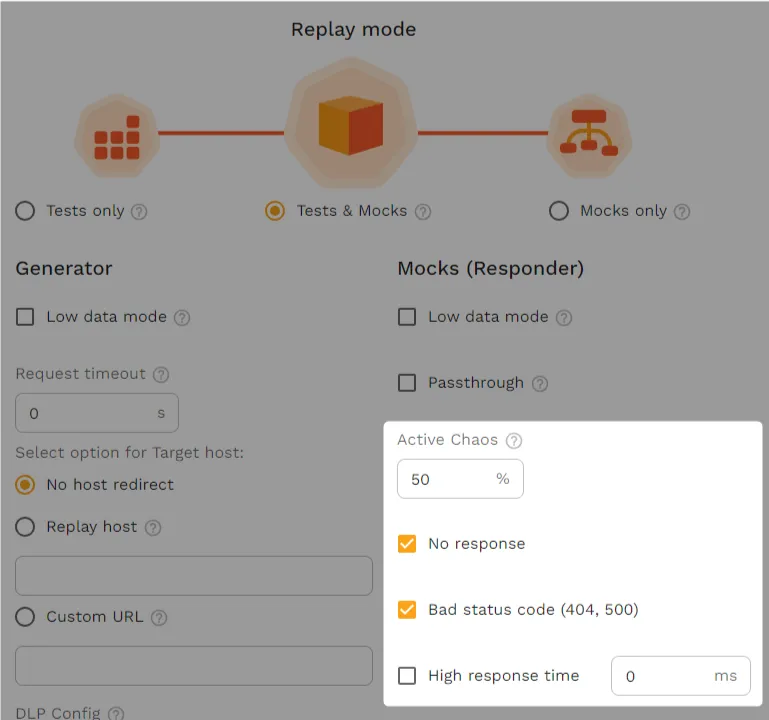
Next, we’ll modify the Speedscale test configuration to introduce chaos in the mock server. This could be in the form of high response times, bad status codes, or no responses at all. Create a new test config and set the mock server to introduce 50% chaos, with no responses and bad status codes.

When you run a traffic replay using this new test config, it’s to be expected that the goals and assertions will fail, as the chaos will cause errors to be thrown within the service, which will make the app crash. In case you’re reading through this without following the steps, you can view an example report in the interactive demo to see what a failed replay looks like.
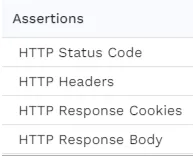
From here, you can start digging into the different error responses to determine where error handling needs to be implemented, which can then be validated by running the replay again. It’s important to mention that by default, a test config’s assertions will examine whether HTTP responses are the same as what was recorded.

Often this is exactly what you want, but it doesn’t work well when introducing chaos, as some requests will inevitably return error codes as opposed to the proper response. So, experiment with different assertions and goals to make the test config fit your use case. A simple config option could be to remove all assertions, only setting a goal for the response rate.

Continuously Validating Error Handling
As you navigate the complexities of error handling validation, remember that it’s an ongoing process, not a one-time event. It’s crucial to continuously validate your error handling mechanisms to ensure that your application remains resilient in the face of ever-evolving error conditions. With tools like Speedscale and the concept of production traffic replication (PTR), you can streamline this process and maintain high-quality software delivery.
It’s important to understand that production traffic replication doesn’t exclusively involve production traffic. In fact, the strength of PTR lies in its ability to record and replay real-life traffic patterns, irrespective of the environment. This allows you to identify and rectify missing error handling during the development phase itself, thereby reducing the chances of unexpected crashes in production.
Once your application is deployed and in use, you can leverage actual production traffic for testing. This ensures that your application is tested under real-world conditions as well as random chaos, thereby improving its robustness. Furthermore, you can create request/response pairs from scratch to validate specific error handling mechanisms, ensuring your application can handle a variety of scenarios.
Continuously validating your error handling mechanisms is a critical aspect of maintaining a resilient and robust application, and fits well with the overarching principle of continuous performance testing.