Every new signup posts a message to our Slack. The format is dull and reliable:
USER_EMAIL logged into TENANT_IDOvernight this week one arrived like this:
USER_EMAIL logged intoThat trailing nothing was the entire incident. No error logs, no alerts. A returning user had signed up, our signup service had attached them to a tenant we deprovisioned back in December, and the only symptom in the whole company was a Slack message that ran out of words.
Their company’s email domain still pointed at the dead tenant, so instead of a fresh workspace they landed in a corpse: domain mapping still live, cloud infrastructure long gone. I’m on call this week, so I pulled the thread. By then they’d spent four hours in a workspace that couldn’t work.
The fix took three tries, and the first two were confident and wrong. It’s the same loop every engineer runs after an incident. What finally worked was replaying the captured production request against a local build. The failures are the point, so I’ll walk through all of it.
Attempt one: fix the theory
The obvious diagnosis was “tenant deletion is buggy.” My first fix hardened the tenant delete code. Well reasoned, well tested, aimed at the wrong layer.
The actual shape: tenant infrastructure lives in Terraform, users and their tenant assignments live in a usr-mgmt database, and the two drift. Usually the drift self-corrects on the next signup or login. The exception is an email domain assigned to a specific tenant. That mapping lives only in the database, nothing reconciles it when the infrastructure goes away, and that exact path wasn’t well validated. That’s what this user hit.
That’s the trap of fixing from a theory. A symptom tells you something broke (mine was a Slack message missing its last word), not what production was doing when it broke. I measured this with AI agents earlier this year: given only the alert, the agent edits the wrong service 34% of the time. Turns out a human with a plausible theory isn’t much better.
Attempt two: trust the green checkmark
My second fix targeted the real mechanism, and it shipped with integration tests against a real Postgres. All green.
Then I replayed the captured production signup against a local build seeded to mirror production, and the fix never fired. My tests covered “domain row deleted” and “domain re-pointed.” Production was “domain row present, tenant soft-deleted.” The tests asserted my theory of the bug, and the theory was incomplete.
This is also why our staging environment missed this bug. The failing state took seven months of infrastructure teardown drifting away from a database to build up. Our staging data has synthetic users and clean referential integrity. The bug couldn’t exist there.
What the replay caught that nothing else did
The replayed request also found a second bug I wasn’t looking for. Our domain lookup chained two ORM calls, and the join ran through the wrong model:
// before: query anchored on Domain, then joined to tenants.
// GORM applies the soft-delete filter to the anchor model only,
// so deleted tenants still resolve.
db.First(d, "domains.name = ?", name).
    Joins("INNER JOIN tenants ON tenants.id = domains.tenant_id").
    First(t)

// after: anchor on Tenant so deleted_at IS NULL actually applies
db.Joins("INNER JOIN domains ON domains.tenant_id = tenants.id").
    Where("domains.name = ?", name).
    First(t)
The chained version reads fine and passed review, but the soft-delete filter applied to the wrong table. Once the dead tenants were cleaned up, signups from an affected domain wouldn’t quietly mis-attach anymore. They’d 500. A worse bug behind a passing suite, visible only because a real request took the real code path against real data.
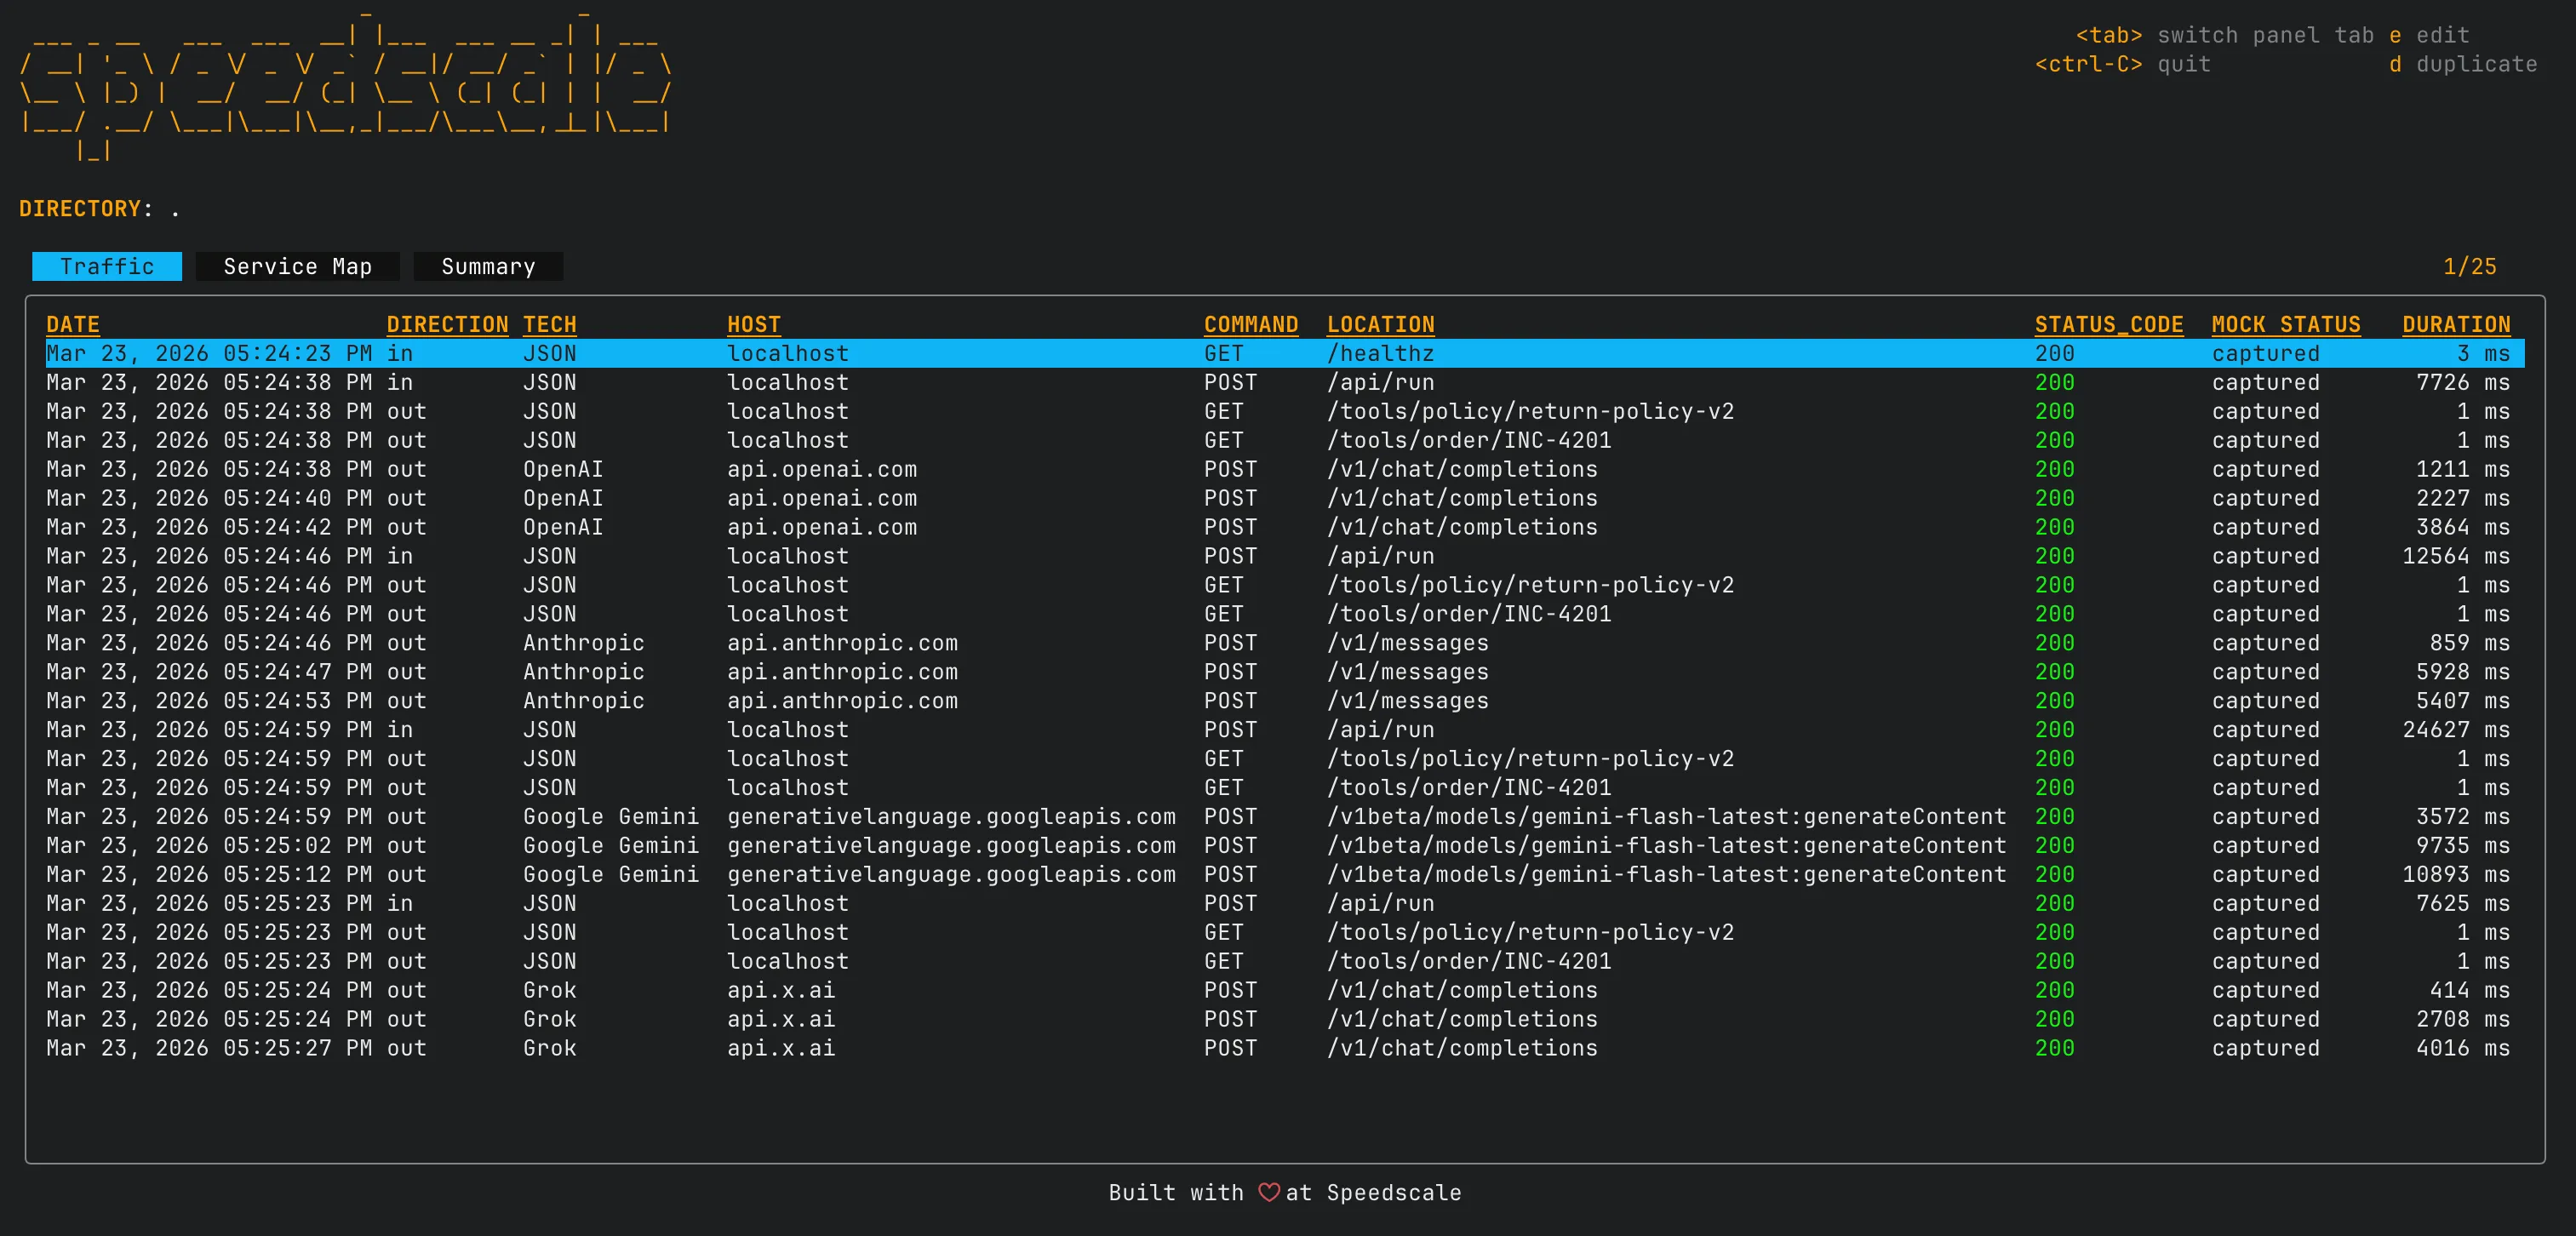
That’s the captured Postgres traffic behind the replay: wire-level responses down to the prepared statement. Nobody hand-wrote that fixture, which is why it disagreed with my assumptions.
Same request, four outcomes
The final validation was one captured signup request replayed four ways:
| code | data state | result |
|---|---|---|
| old | captured incident state | incident reproduced, byte-identical tenant id in the response |
| new | captured incident state | identical behavior, deploy day changes nothing |
| old | after cleanup | 500 on every signup from the mapped domain |
| new | after cleanup | user recovered into a fresh tenant, and a replayed colleague signup joined the same tenant |
Same request, deterministic answers to “did I reproduce it” and “did I fix it.” No deploy-and-pray in the middle.
Then it happened again, same week
Different service, same lesson. Our gateway got paged three nights running for the same panic. Each burst self-resolved in five minutes, so by morning there was nothing to look at except a yellow circle in Slack and an alert naming the exact line:
grpc server recovered from panic
  api-gateway/server/replay.go:516
I went and read the code, and this is where I got stuck. The line above the crash checks for errors. If the fetch failed, it bails out. It’s what I would have written, and what I’d have approved in review without slowing down.
meta, err := r.s3.HeadObject(ctx, ...)
if err != nil {
    return nil, fmt.Errorf("could not get snapshot action file size: %w", err)
}
req := math.Ceil(float64(meta.ContentLength) * 1.5) // line 516, crashes here
Reading never found this bug. What found it was replaying the crashing request from the captured traffic against the service on my laptop: it crashed on the same line, and I finally saw what review couldn’t show me. The fetch reported no error and still came back with nothing. Our storage helper treats a missing file as a normal result. No error, nothing returned, and any caller that only checks err sails past and uses the nothing. Whoever wrote that was being reasonable. A missing file isn’t really an error, is it. It’s the reasonable ones that get me.
The captured traffic also answered why nights only. The crashing request carried a snapshot ID, and that snapshot no longer existed. A nightly job was still scheduled against something somebody had deleted: it wakes up, asks for a file that’s gone, gets handed nothing, crashes, retries, gives up before anyone’s awake. Logs alone were never going to tell me which request did it.
And the tests were green the whole time, for the same reason as the signup bug. The storage stand-in always handed back a valid file, so the one answer real storage gives in this situation, nothing at all, never got tried. I wrote the regression test after watching how storage actually behaved instead of picturing it. Against the old handler it panics on the production line. Against the fix, a clean not-found naming the missing snapshot. And the helper is still out there telling every other caller that missing files are fine. I’d bet money we’re not the only shop where “not found” quietly became “no problem.”
Where the traffic came from
None of this involved instrumenting anything after the incident. The traffic was already being captured from the production pods with eBPF, TLS included, no code changes to the services. Getting the incident onto my laptop took one proxymock cloud pull snapshot. For the signup story I duplicated one captured request and edited the email, so I could validate “second user lands with their team” without a second real user.
The loop that works is short. Capture what production actually did, reproduce it locally, and let the same replay tell you when the fix is real. Every step I skipped, I paid for: a fix at the wrong layer, then a green test suite guarding a fix that couldn’t fire. If your validation plan is deploying and watching the error monitor, you’re testing in production with extra steps. To run this loop on your own service, proxymock records real requests and what your dependencies send back, then replays them on your laptop. Single binary, no cluster.