
Testing is crucial for ensuring the reliability and stability of your Kubernetes application in a containerized environment. Unlike traditional software testing, Kubernetes testing focuses on validating the behavior and performance of Kubernetes applications under different conditions. For instance, by implementing Kubernetes testing, you can check application availability and performance during high traffic spikes, validate Kubernetes ingress and gateway behavior under different load conditions, verify that autoscaling is working as expected, and troubleshoot issues across pods and microservices.
This tutorial demonstrates how easy it is to perform Kubernetes testing using Speedscale, a testing framework that autogenerates tests from traffic in your production environment.
Why Does Kubernetes Testing Make Business Sense?
There are several reasons why Kubernetes testing is important from a business perspective.
For starters, by performing extensive Kubernetes testing, organizations can ensure high availability of applications and thus minimize costly downtime. Kubernetes testing also allows DevOps teams to proactively identify bottlenecks and capacity limitations. This enables accurate resource provisioning for pods, which in turn helps reduce costs by preventing overprovisioning.
Furthermore, Kubernetes testing streamlines the process of detecting and troubleshooting issues early in the development cycle, which introduces additional business benefits, such as reduced mean time to repair (MTTR) and better compliance with service-level objectives (SLOs) and service-level agreements (SLAs). These help reduce the risk of customer dissatisfaction and potential revenue loss.
Kubernetes testing is still difficult
Nevertheless, despite the notable advantages of Kubernetes testing, some organizations hesitate to implement it due to concerns about the challenges involved, including the costs of a testing environment, a lack of experience in how to mock dependencies and traffic, simulating peak traffic conditions without affecting production, and more.
As you’ll learn in the following sections, a testing framework like Speedscale can help organizations easily implement and streamline their Kubernetes testing processes.
Tutorial Prerequisites
To continue with this tutorial, you’ll need the following:
- A functional Kubernetes cluster; it can be local or remote.
- The kubectl command line tool set up to access the Kubernetes cluster locally.
- A Speedscale account. You can sign up for free and install the Speedscale CLI on your local machine.
- The tutorial files cloned or downloaded to a location of your choice.
- The Java Development Kit (JDK) installed on your local machine. For macOS, you can install Java by running brew install openjdk, while to install Java on Ubuntu 22.02, you can follow this tutorial. Whatever your OS, make sure you set JAVA_HOME correctly.
Kubernetes Testing Using Speedscale
To demonstrate Kubernetes testing with Speedscale, you’ll use a tutorial Java Spring Boot app included in Speedscale’s open source GitHub repository.
Start by cloning said repository to a location of your choice:
shell git clone https://github.com/speedscale/demo
Next, navigate to the java folder:
shell cd demo/java
If you open the Makefile, you’ll see several targets, including kube-capture, which will be used during this tutorial:
Makefile … .PHONY: kube-capture kube-capture: kube @kubectl -n ${NAMESPACE} patch deployment/java-server —patch-file patch.yaml …
As you can see, kube-capture deploys the java-server app and then patches it using patch.yaml.
java-server is a demo app that makes requests to two public API endpoints: api.spacexdata.com and api.fiscaldata.treasury.gov. The general idea of this app is to generate incoming and outgoing traffic between java-server and these APIs. Speedscale will automatically capture this traffic for analysis.
Capturing Traffic with Speedscale
To do test orchestration with Speedscale, you just need to install the Speedscale Operator and route requests to and from your application through a Speedscale sidecar proxy, which will be in charge of capturing traffic from your application.
Start by running speedctl init to initialize Speedscale:
$ speedctl init
                         _               _
 ___ _ __   ___  ___  __| |___  ___ __ _| | ___
/ __| '_ \ / _ \/ _ \/ _` / __|/ __/ _` | |/ _ \
\__ \ |_) |  __/  __/ (_| \__ \ (_| (_| | |  __/
|___/ .__/ \___|\___|\__,_|___/\___\__,_|_|\___|
    |_|

Welcome to Speedscale! Preparing your installation...

Installing with the following configuration:

-   Installation location: /Users/damaso/.speedscale
-   Add environment variables to rcfile: /Users/damaso/.zshrc

✔ Performing authentication (press Ctrl-C to interrupt)

✔ Downloading Speedscale config.yaml file

✔ Updating shell rcfile

Success! Speedscale initialization complete!

For help getting started check out https://docs.speedscale.com

Also, don't forget to join the Speedscale Slack community. We'd love to connect with you!

[https://slack.speedscale.com](https://slack.speedscale.com)
Next, run speedctl install to install the Speedscale Operator.
The output will be similar to the following:
$ speedctl install
                         _               _
 ___ _ __   ___  ___  __| |___  ___ __ _| | ___
/ __| '_ \ / _ \/ _ \/ _` / __|/ __/ _` | |/ _ \
\__ \ |_) |  __/  __/ (_| \__ \ (_| (_| | |  __/
|___/ .__/ \___|\___|\__,_|___/\___\__,_|_|\___|
    |_|

This wizard will walk through adding your service to Speedscale. When we're done, requests going into

and out of your service will be sent to Speedscale.

Let's get started!

Choose one:

[1] Kubernetes

[2] Docker

[3] Traditional server / VM

[4] Other / I don't know

[q] Quit

▸ What kind of infrastructure is your service running on? [q]: 1

…
Finally, deploy the application by running the following:
make kube-captureNow all you have to do is open Speedscale in your browser and start analyzing the traffic generated by the demo app.
Analyzing Traffic
A few seconds after running make kube-capture, you should begin to see how the traffic dashboard begins to populate with detailed information related to incoming and outgoing requests to the java-server app:
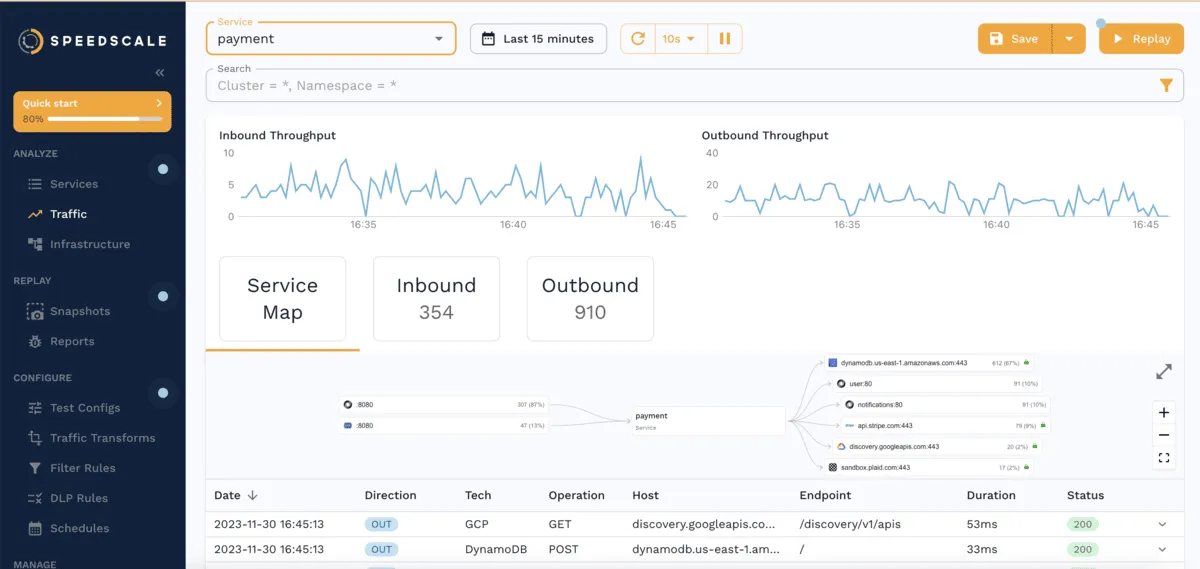
At the top, you can see graphs with inbound and outbound throughput. Below these, the dash displays a service map and a list with the most recent request-response pairs (RRPairs).
If you click any of these RRPairs, you’ll see more information about their body, headers, and more:
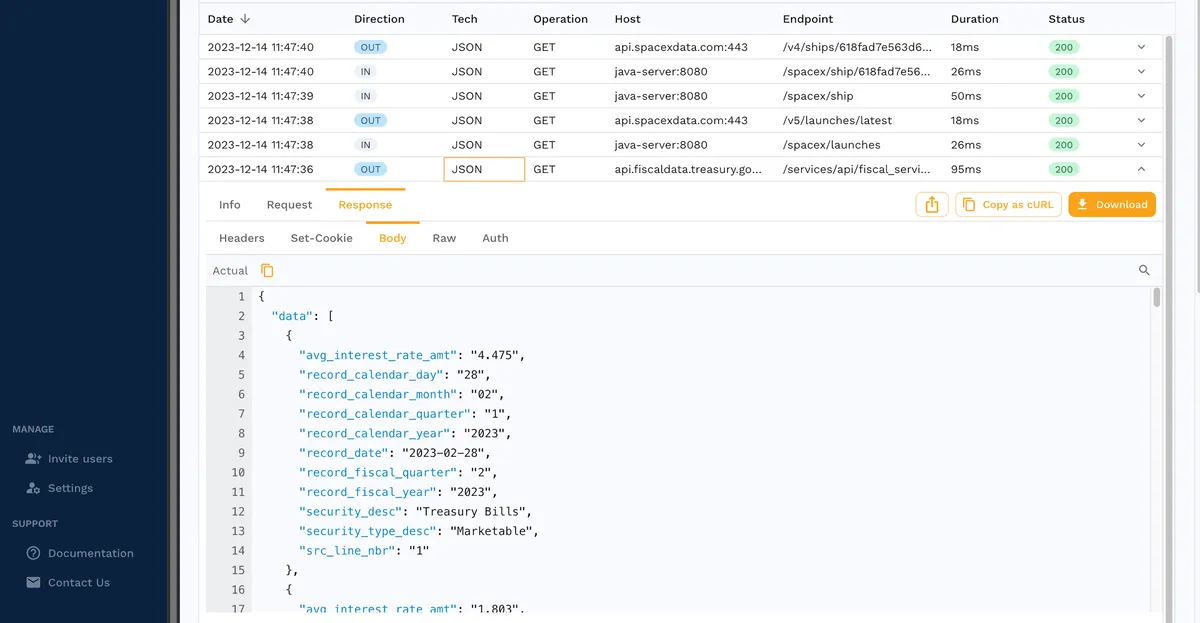
In short, with minimal effort on your part, Speedscale automatically provides you with a service map that makes it easy to view dependencies between different endpoints.
Furthermore, your team can also access detailed data about each request and response from the convenient Speedscale dashboard. This enables better analysis of the inbound and outbound traffic of your applications and services.
Taking a Traffic Snapshot
Live analysis of incoming and outgoing traffic is great for understanding the relationships between different endpoints and visualizing request-response data. However, you’ll have to go further if you want to ensure high availability, validate autoscaling, avoid under- and overprovisioning of resources, and catch issues early before they reach production.
Speedscale’s traffic capture and replay feature is invaluable since it allows you to mock your services and perform stress tests and traffic transformations from your actual traffic. This lets you analyze the behavior of your applications under different conditions without affecting production. No scripting or configuration file is needed, your test artifacts are recorded from real traffic.
The Definitive Guide to Traffic Replay
Traffic replay is quickly gaining traction as the best way to recreate production scenarios.
Let’s generate a snapshot. From the traffic dashboard, click the Replay button:
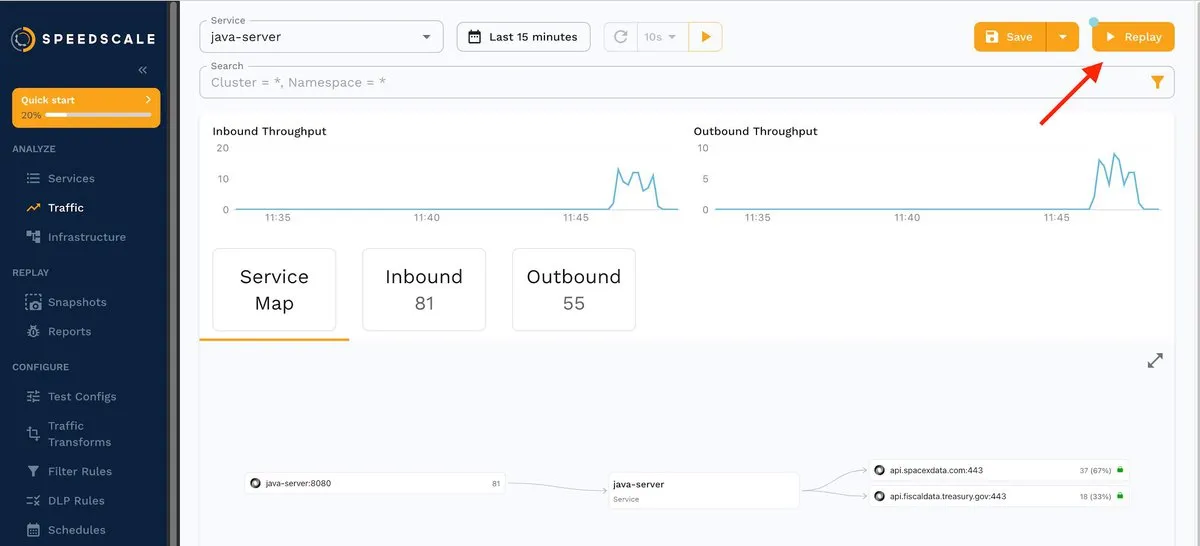
You’ll be presented with a wizard that gives you step-by-step instructions on how to replay traffic.
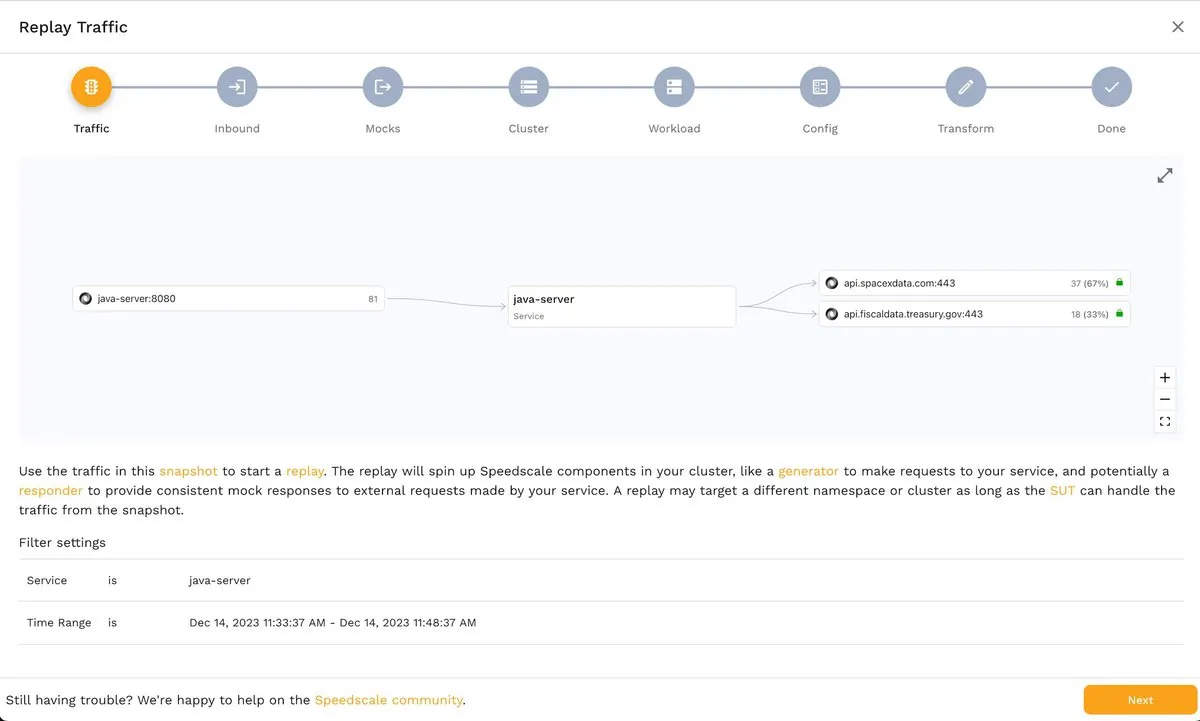
The first step, Traffic, shows you an overview of the traffic that will be recorded, the endpoints involved, and the time frame:
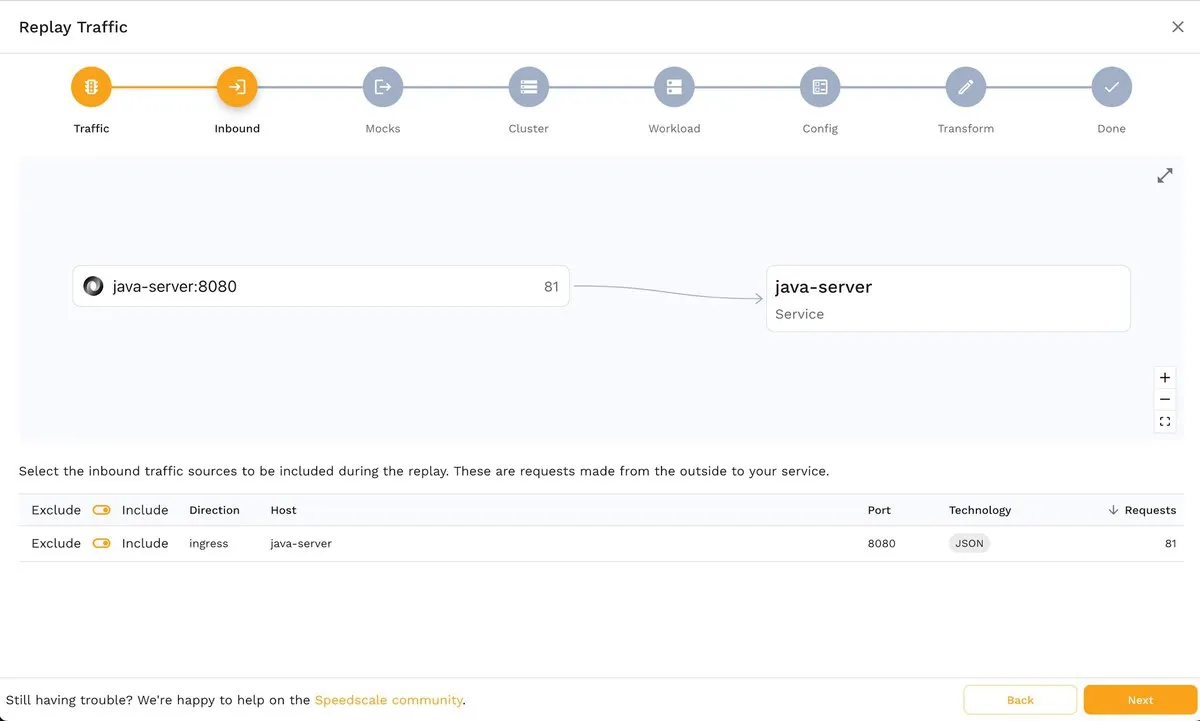
The second step, Inbound, allows you to choose the inbound traffic source(s). In this example, it’s java-server:
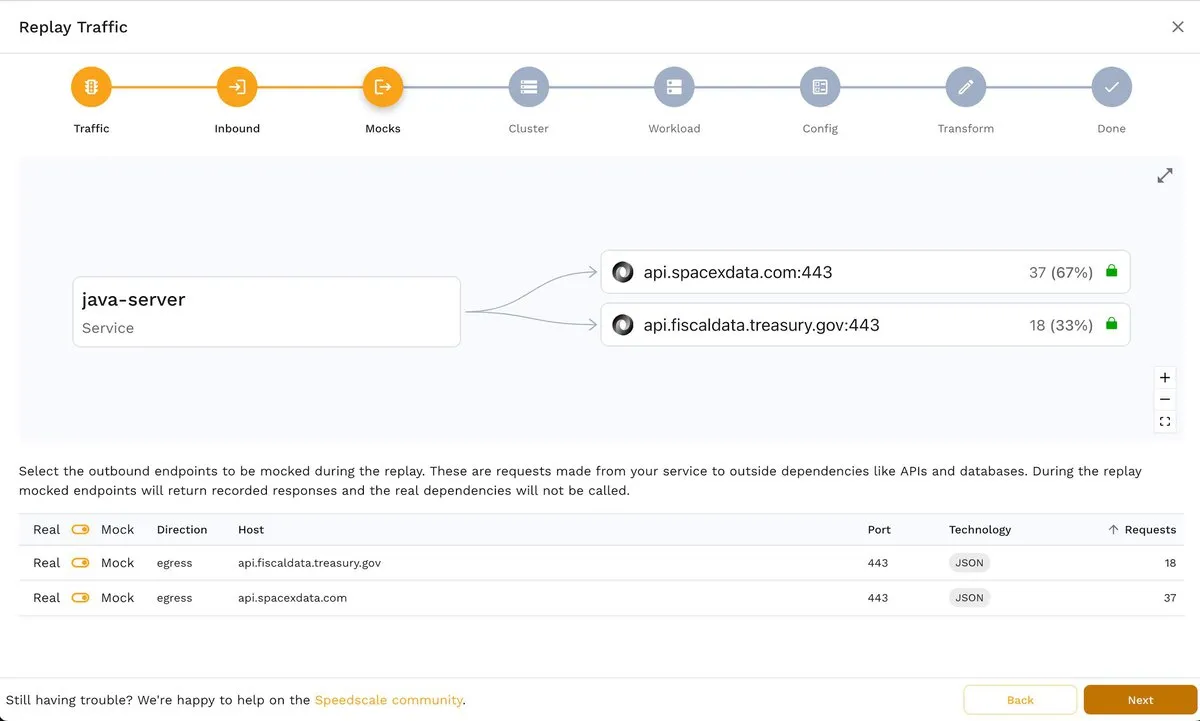
Similarly, in the next step, Mocks, you can choose the outbound traffic to be mocked:
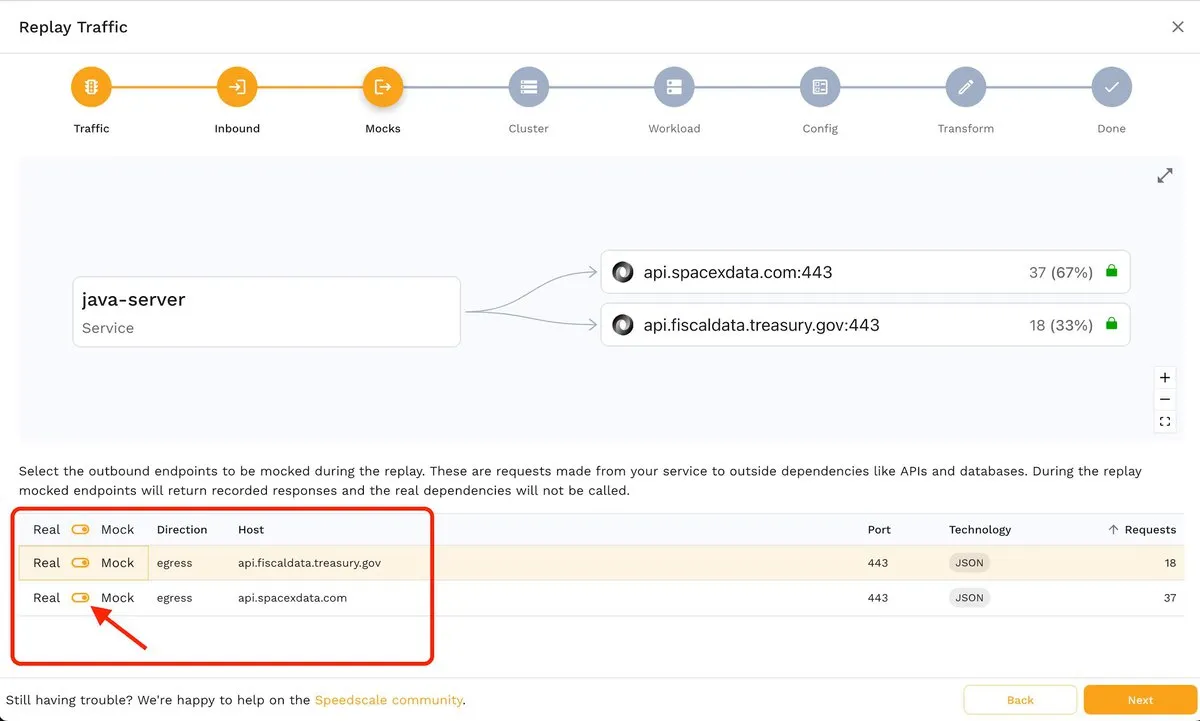
The image below shows how you can disable an endpoint using the corresponding toggle switch:
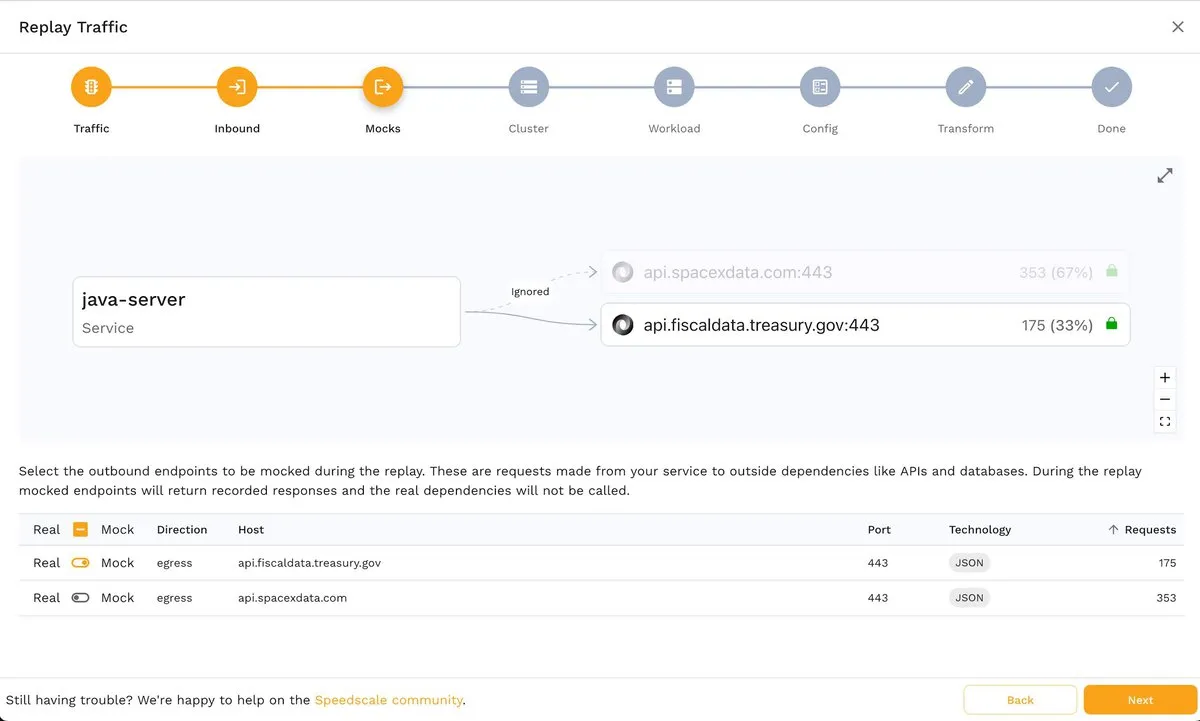
If you decide to disable an endpoint, it will simply be grayed out:
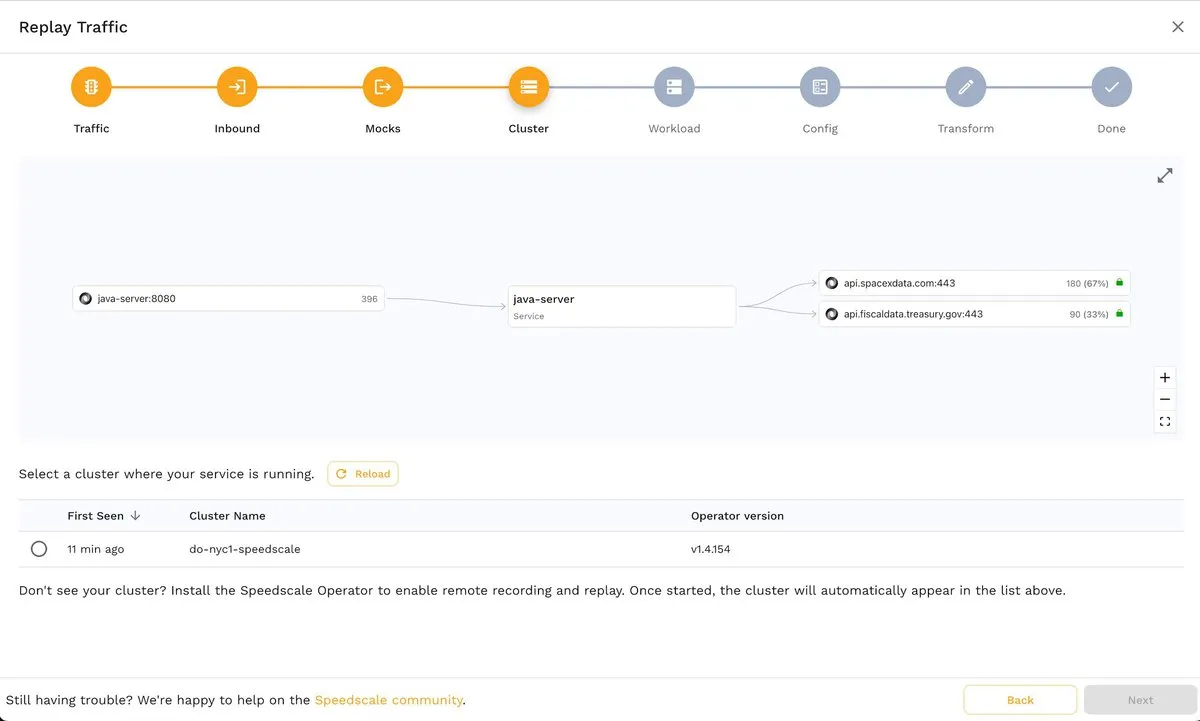
The next step, Cluster, allows you to choose a test cluster from your Kubernetes clusters. If you’ve followed this tutorial, you should see a screen similar to the one shown below, since you will only be able to choose the Kubernetes cluster where the demo app runs:
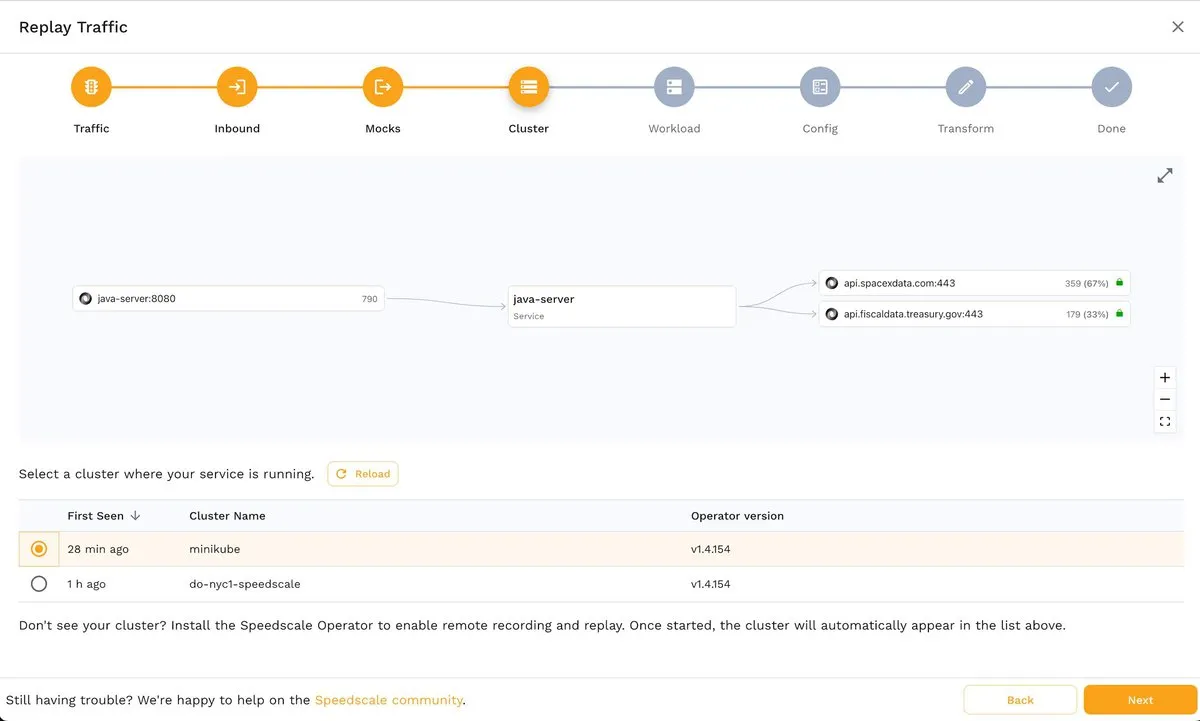
A huge advantage of Speedscale is that you can create snapshot test artifacts from different sources. For example, you can see two Kubernetes clusters in the following screenshot, one local (minikube) and one remote (do-nyc1-speedscale):
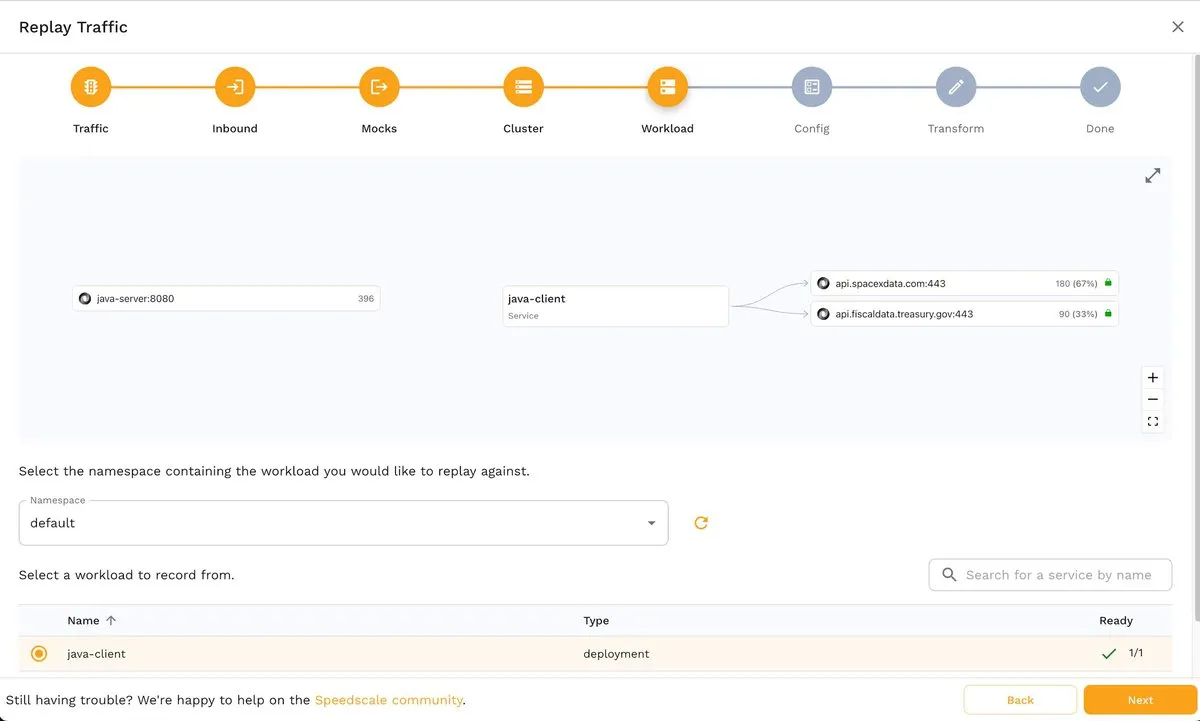
Back to the tutorial. After choosing a source cluster, you’ll see the Workload step, where you must select the namespace where the app runs and the name of the app whose traffic you want to capture:
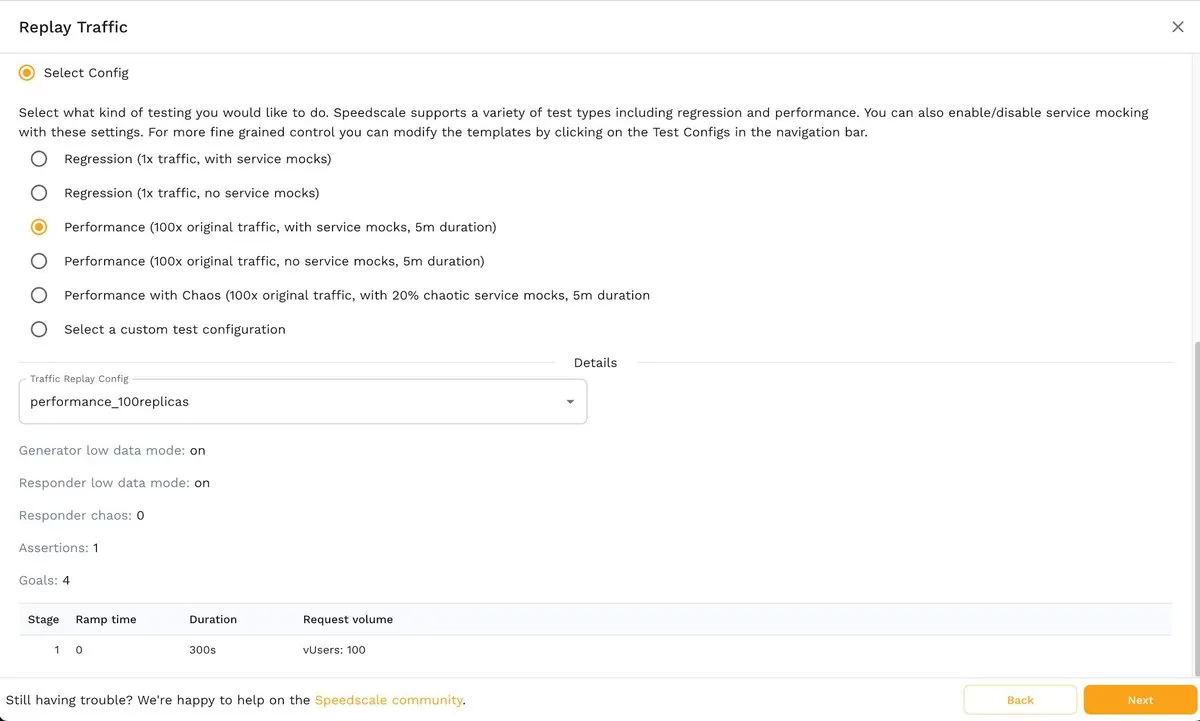
Next, in the Config step, you can select the type of test you want to perform:
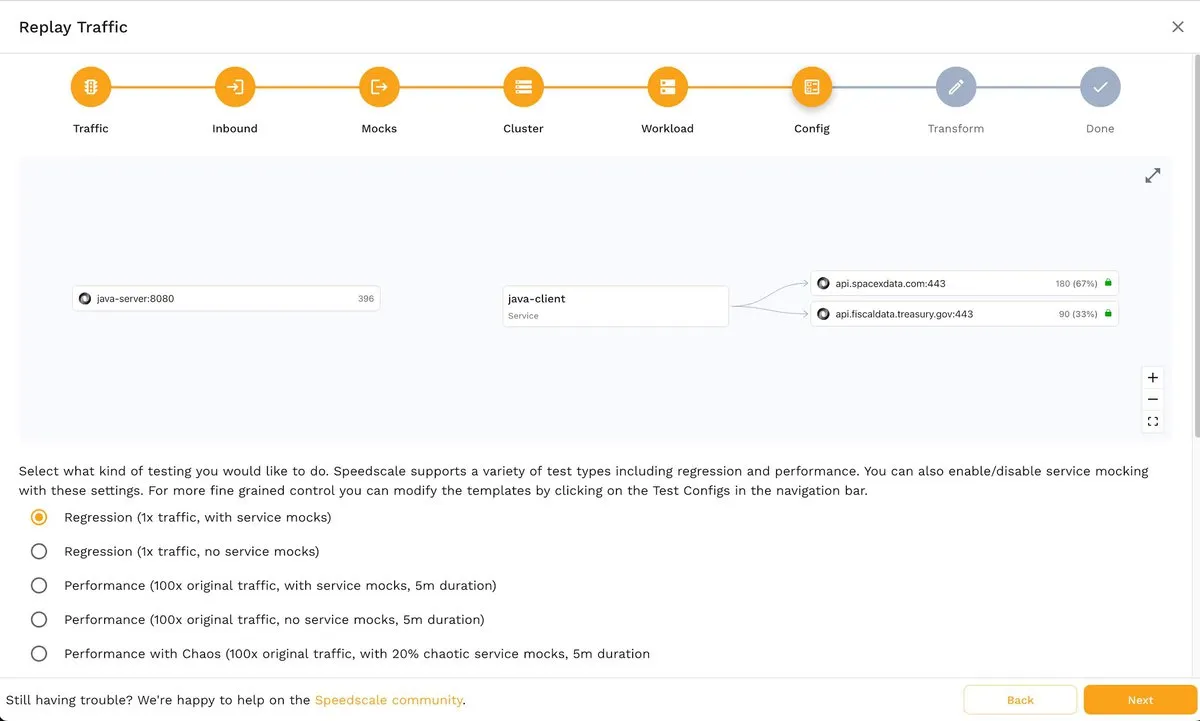
By default, from this screen, you can decide between regression or performance tests with or without service mocks, including performance tests with 100 times the original traffic and 20 percent chaotic service mocks. Chaos testing can also be implemented with various chaos testing parameters. However, Speedscale also allows you to customize test configs and create templates according to your specific requirements.
For this first example, accept the default values (regression test, 1x traffic with service mocks) and click the Next button to continue.
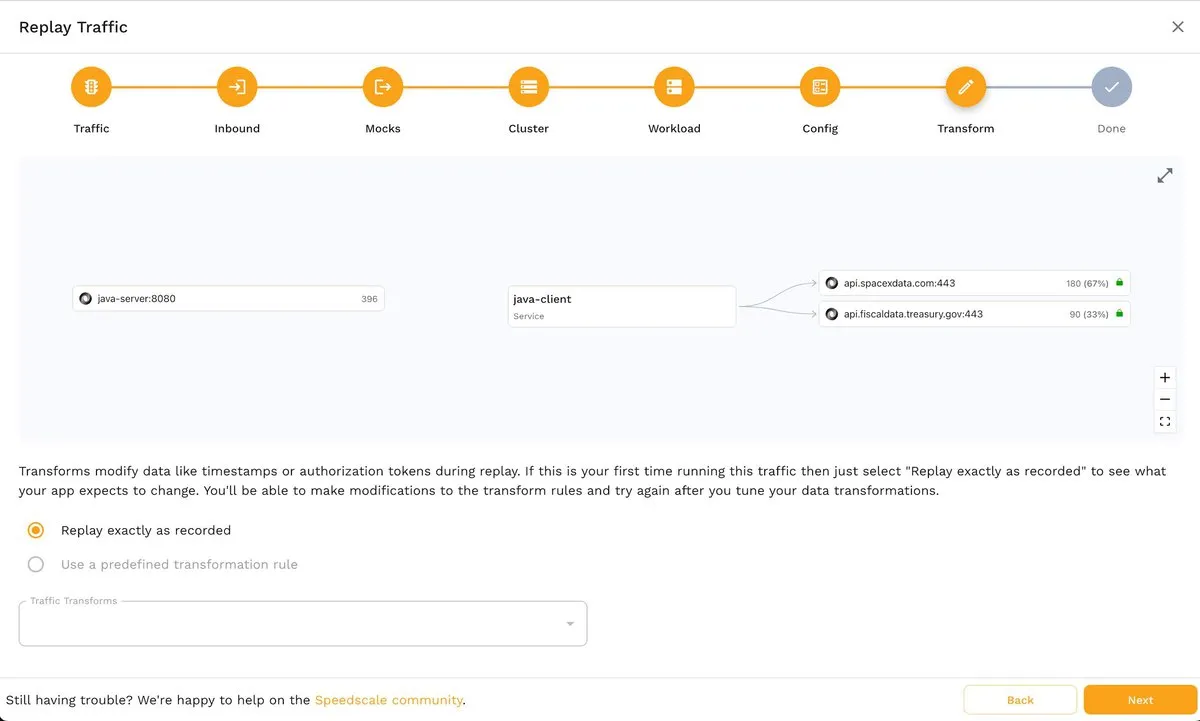
This will take you to the Transform step, where you can play the traffic as it was recorded or apply custom transformation rules:
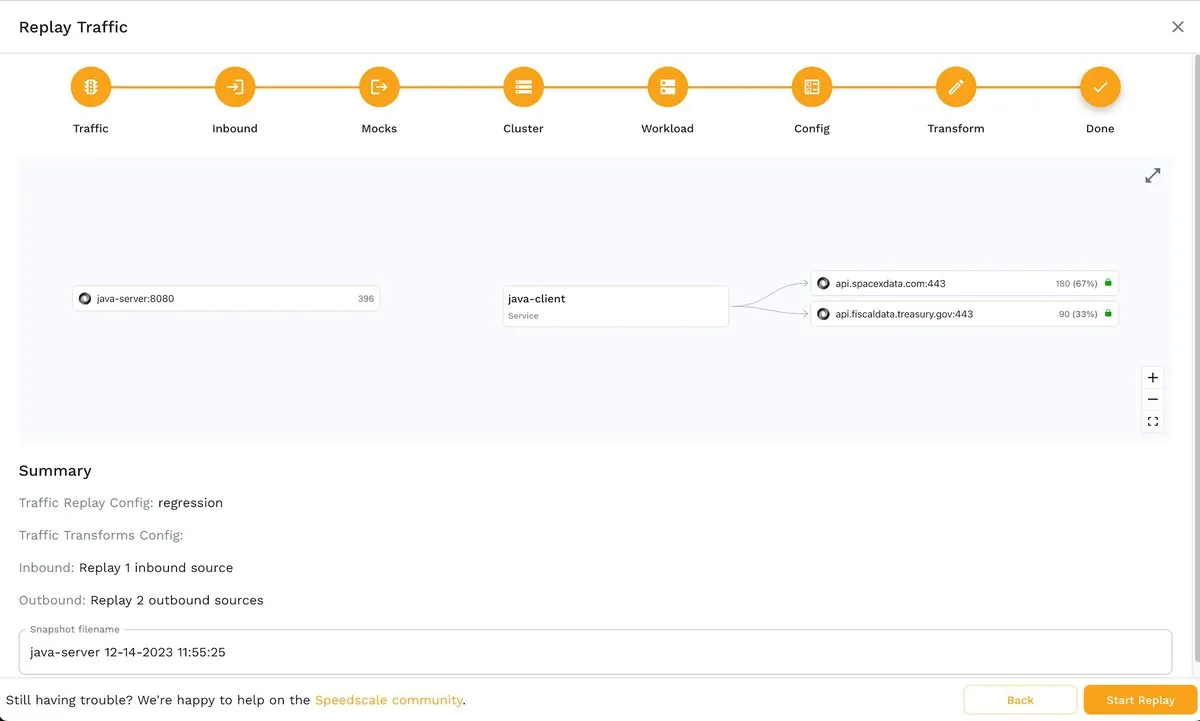
The last step, Done, presents you with a summary of the criteria that will be applied to take the snapshot. If you aren’t satisfied with some of the values, you can always press the Back button and adjust them according to your requirements.
Replaying Traffic
Once you take a snapshot, you can analyze the results from REPLAY > Reports in the side menu.
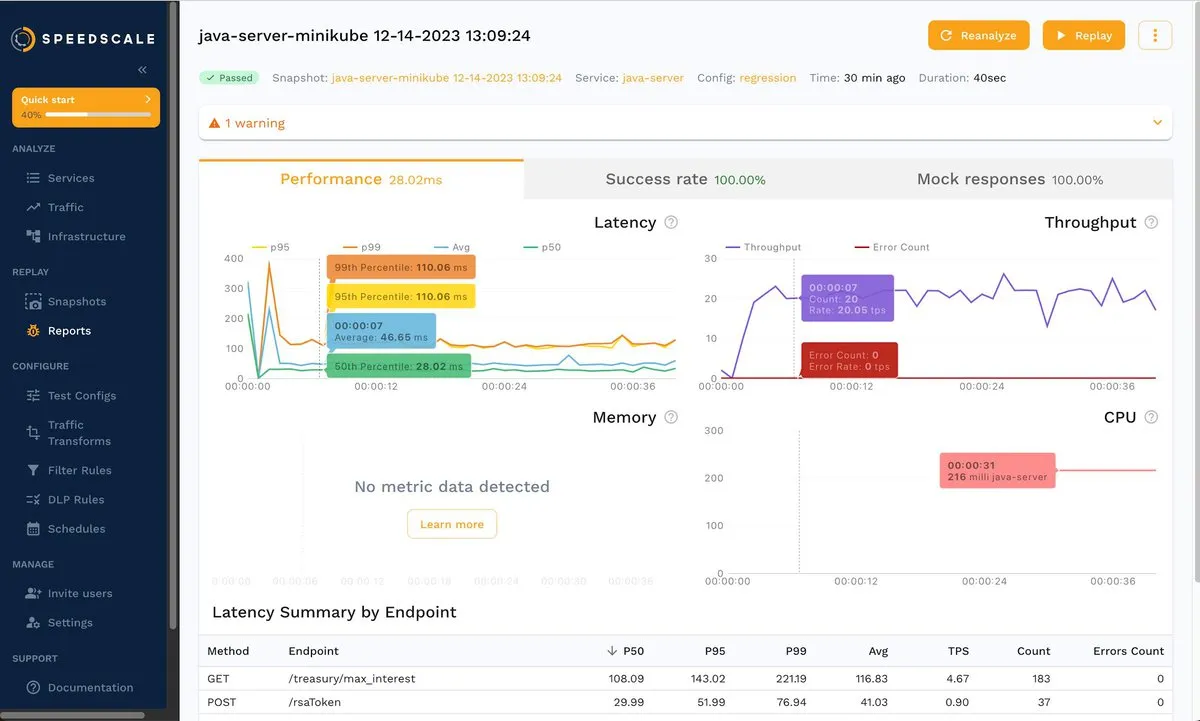
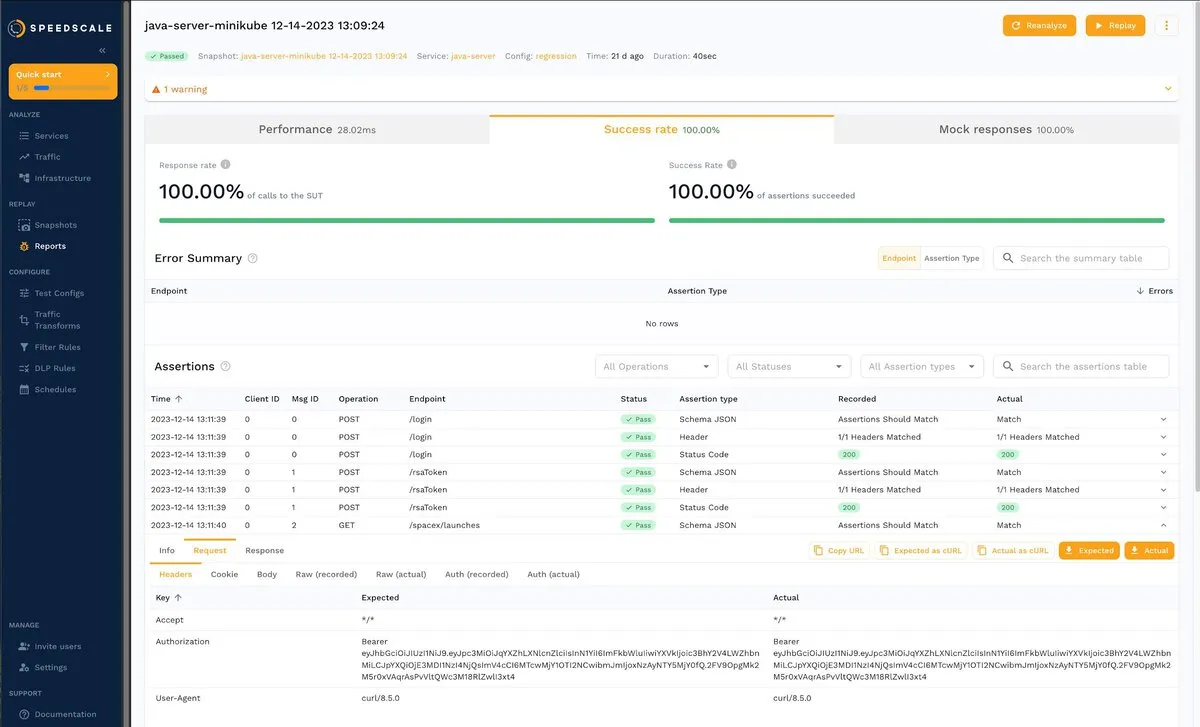
The following screenshot shows the test results for the java-server service, using a regression test with 1x traffic and service mocks:
For this example, you wouldn’t find anything unusual when inspecting the results or the request-response pairs. Fortunately Speedscale can be used as a load testing tool. Let’s check load testing with 100x traffic and see what happens.
To use Speedscale as a load testing tool, follow the procedure described in the previous section and choose 100x original traffic with service mocks and 5 m duration:
Wait for the load tests and analysis to finish. The result is shown below:
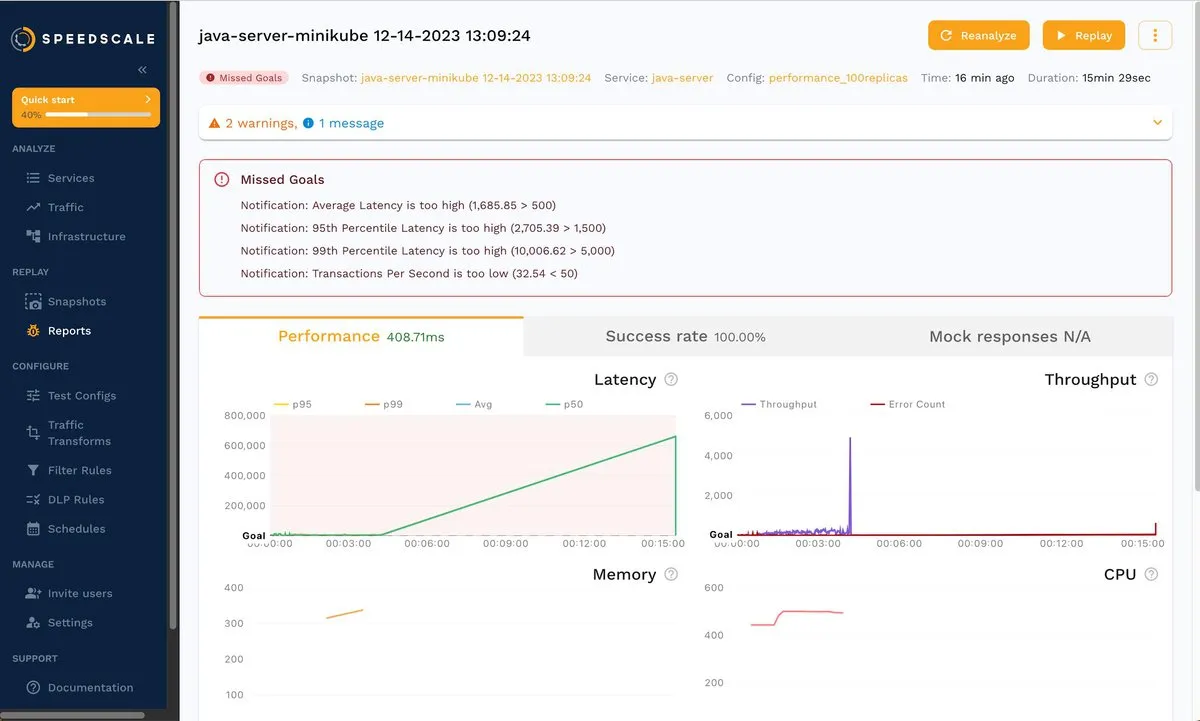
As you can see, even though the success rate is 100 percent, some goals were missed. Keep in mind that your results may vary a little, but the takeaway is the same: you just tested java-server with 100x traffic, and now you can dig in to find out what’s happening under these conditions.
See how Speedscale reveals actual usage under load
For example, you can click the Success rate tab and then /spacex/launches to dig deeper into that endpoint:
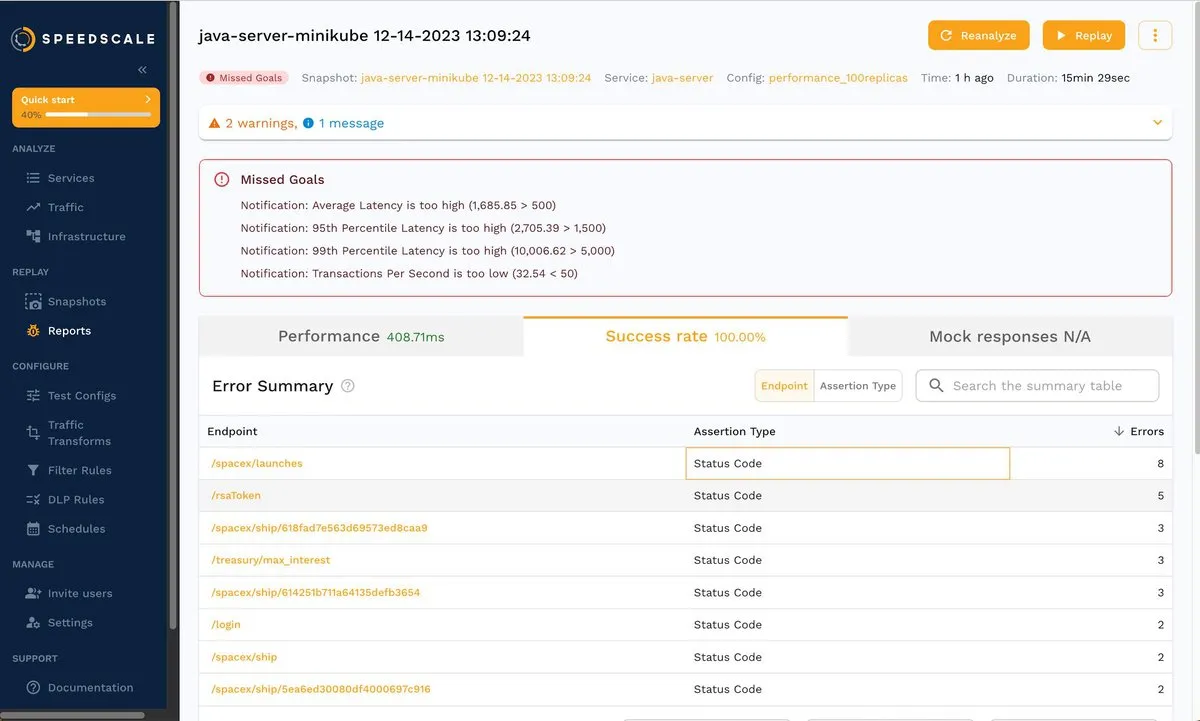
The corresponding errors are shown below:
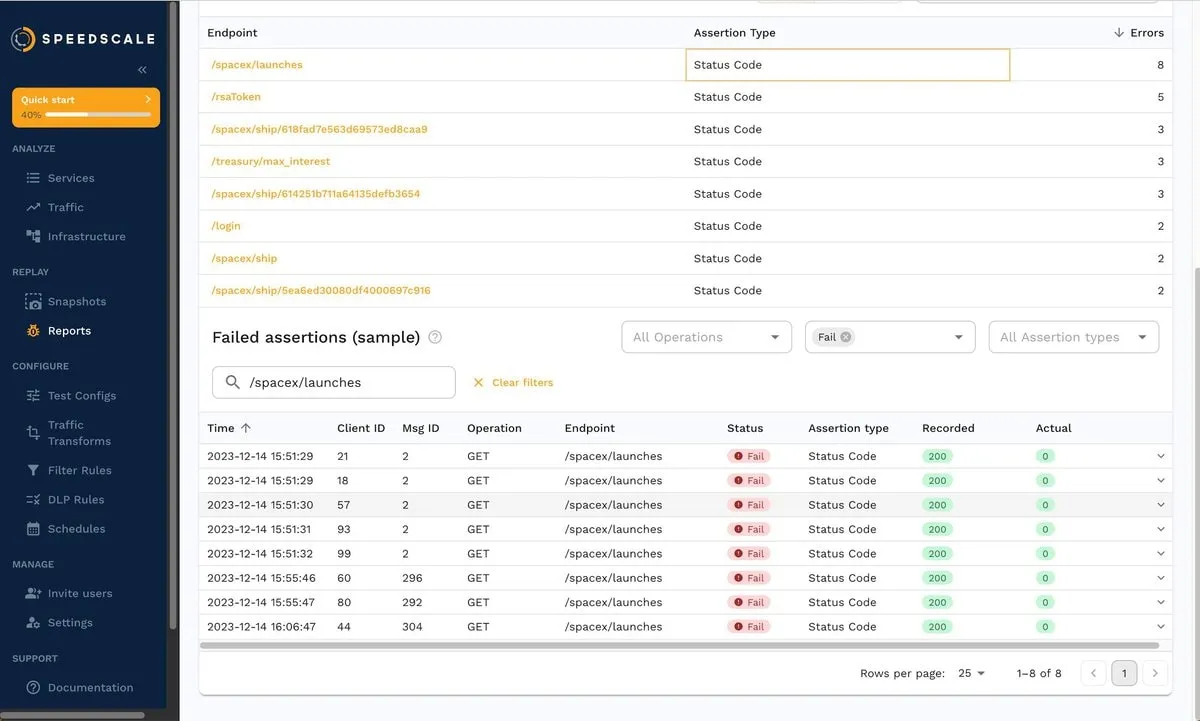
You can also click a response and analyze the body, as shown below:
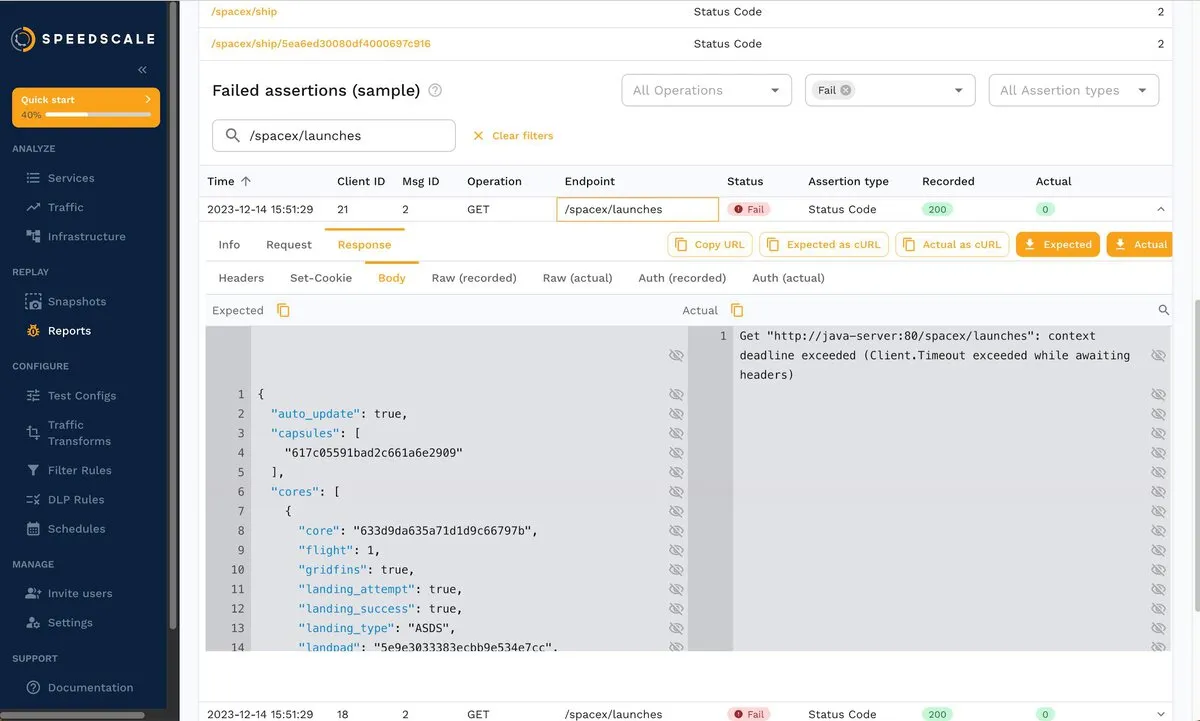
Overall, when you reproduce traffic from a snapshot, you can obtain valuable insights about your services and how they behave under different load conditions. You can filter by status response, endpoint, POST or GET operation, and more.
Transforming Traffic
There are scenarios where editing (or transforming) captured traffic comes in handy. An example is changing the password for replay to snapshots in a different environment, as shown in the documentation.
Try it now by changing a ship ID. To do this, go to REPLAY > Snapshots, choose a snapshot, and then click the Transforms tab. Next, choose a request-response pair from the /space/ship endpoint, as shown below:
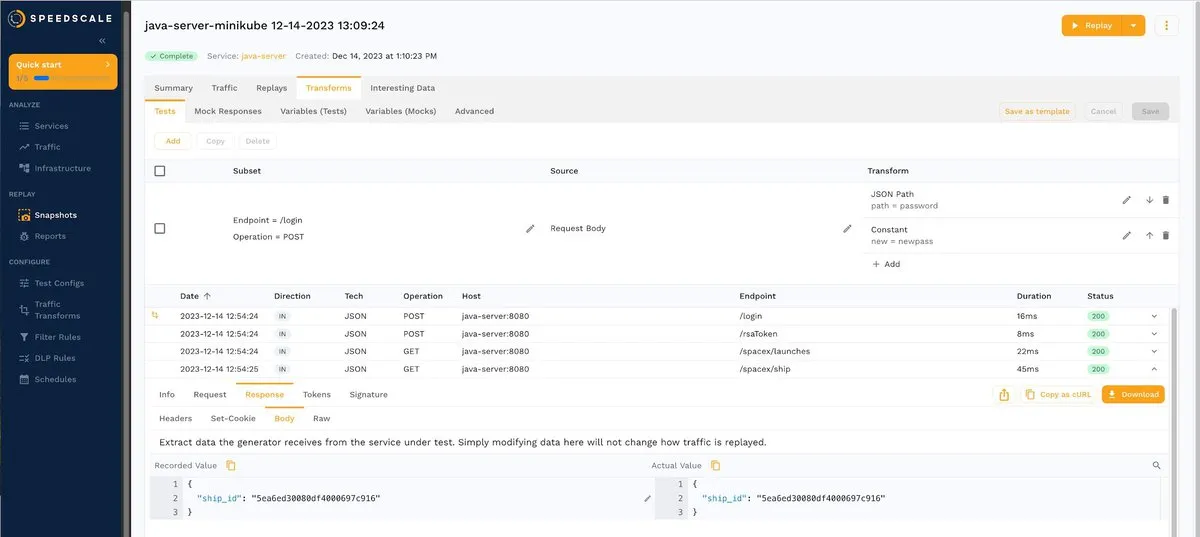
If you click the small pencil to the right of the ship ID, a pop-up window similar to the following will open:
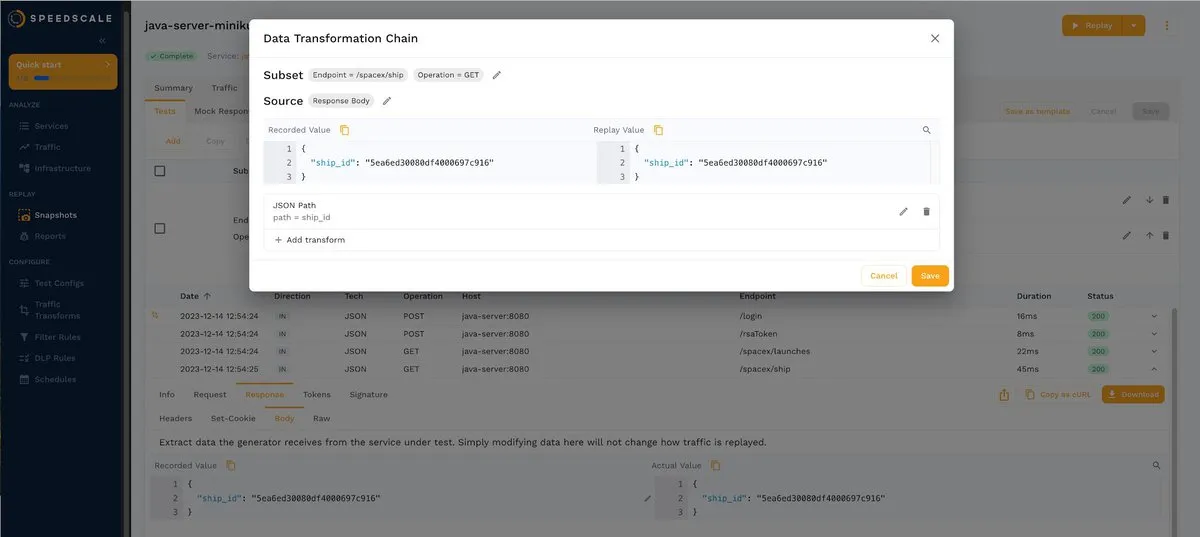
Now, you just have to click + Add transform, and another pop-up window will appear with the available options:
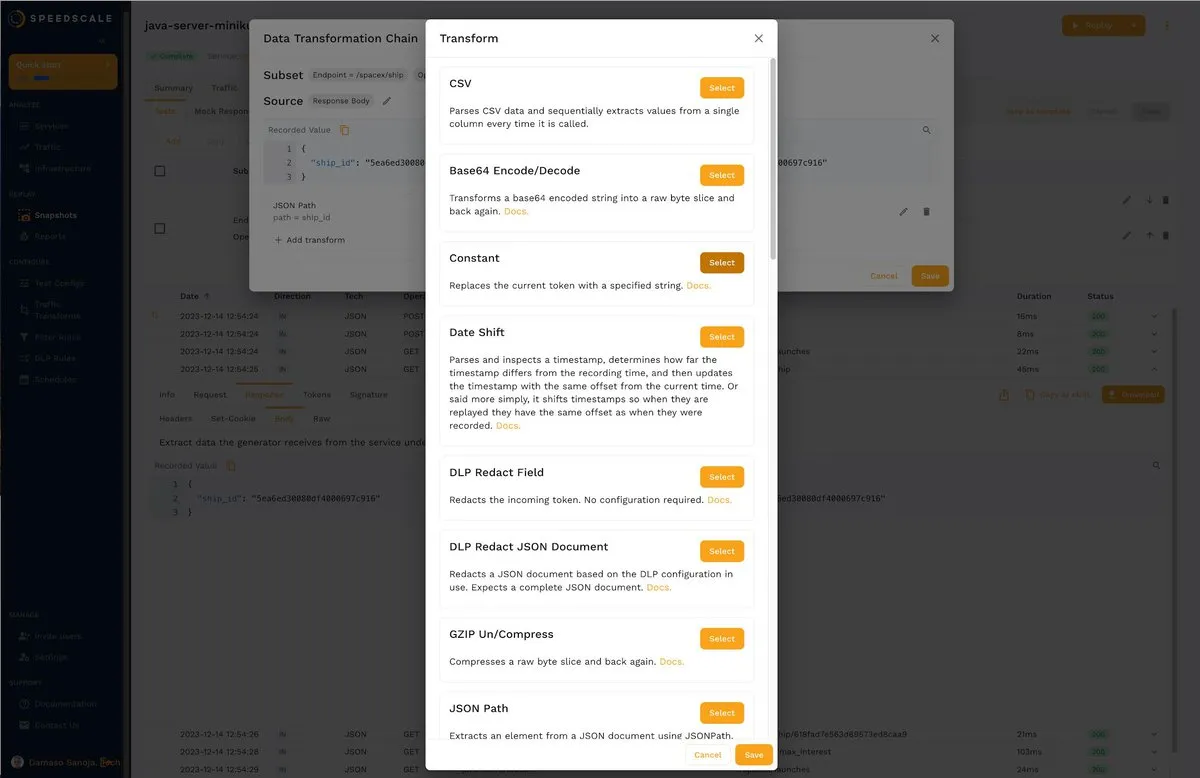
For this example, choose Constant and enter any value. Below is a sample. Once satisfied with the result, click Save to save the transformation.
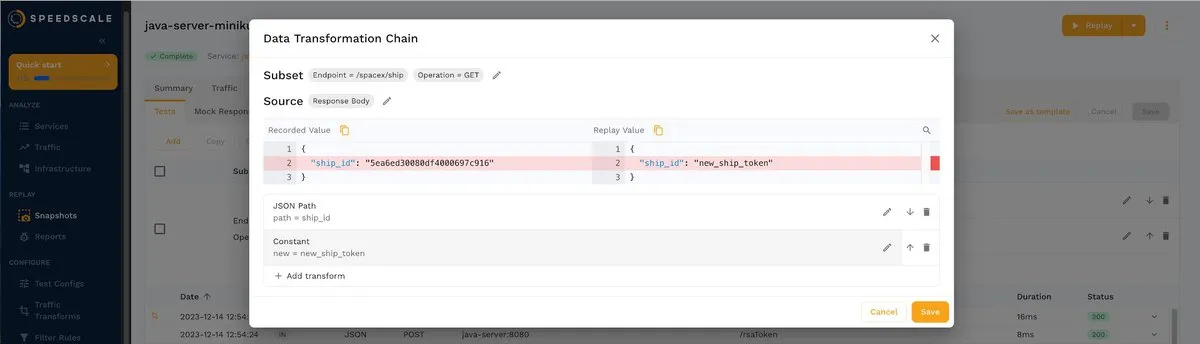
As you can see, transformations are useful for doing different tests on previously recorded data in isolation and without affecting the production environment.
Editing Goals
Sometimes, when performing Kubernetes testing, you may need to modify the test configuration. In the documentation, you can see an example where the test configuration is modified to ignore certain HTTP responses to obtain a better success rate. In this tutorial, the success rate is 100 percent, but some goals are missing. You can modify such goals according to the requirements of your use case.
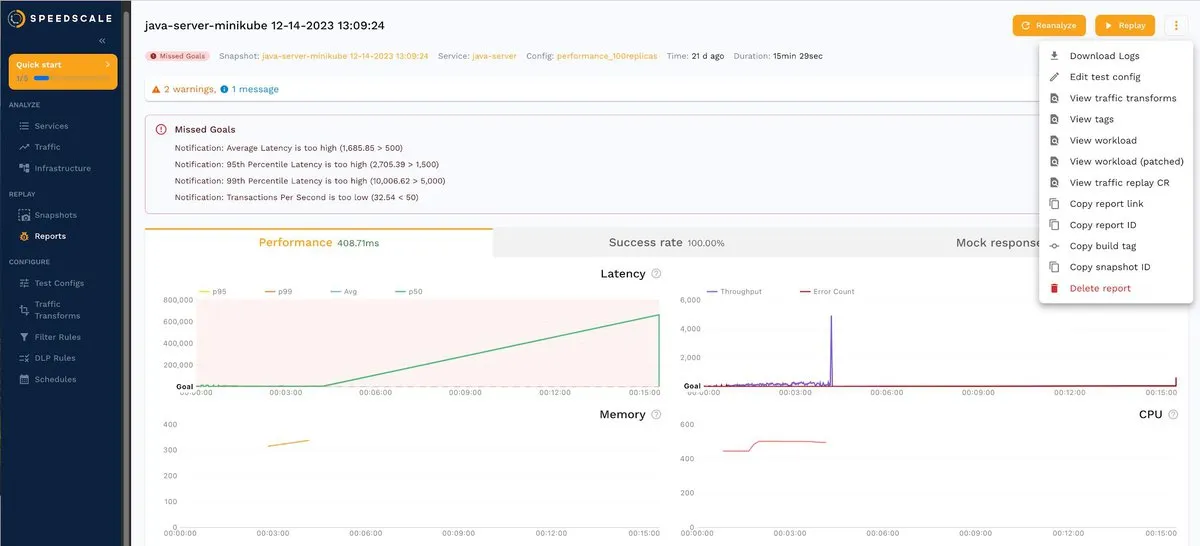
Go back to REPLAY > Reports and choose the snapshot with missing goals (100x traffic). Now click the hamburger menu located in the top right, as shown in the screenshot, and select Edit test config:
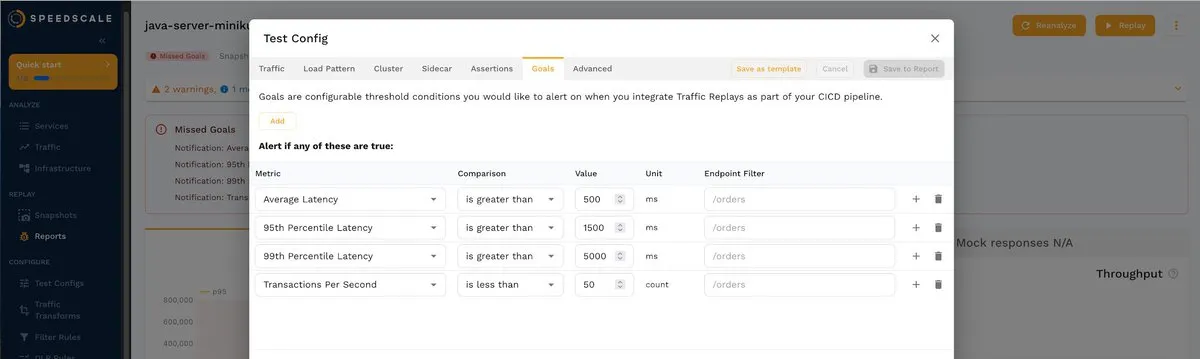
Next, select the Goals tab to see the default values:e
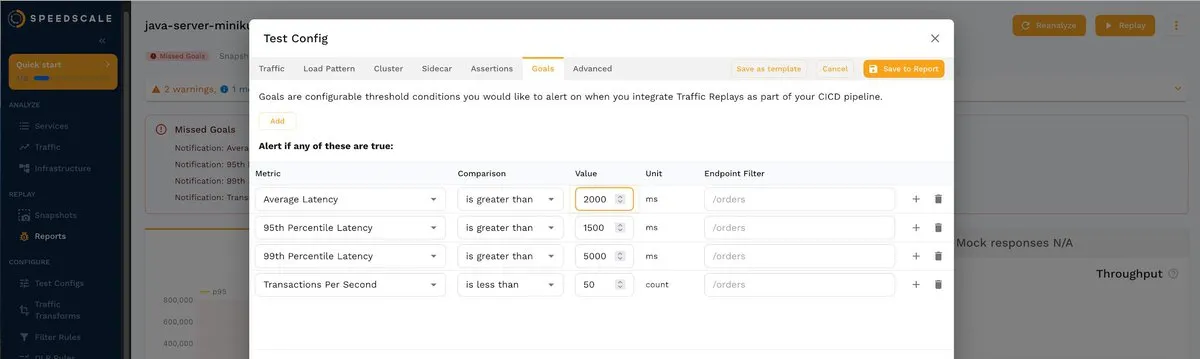
You can change these values according to your requirements. For example, you can change the average latency to 2000 ms:
Changing the value updates the alerts about missing goals:
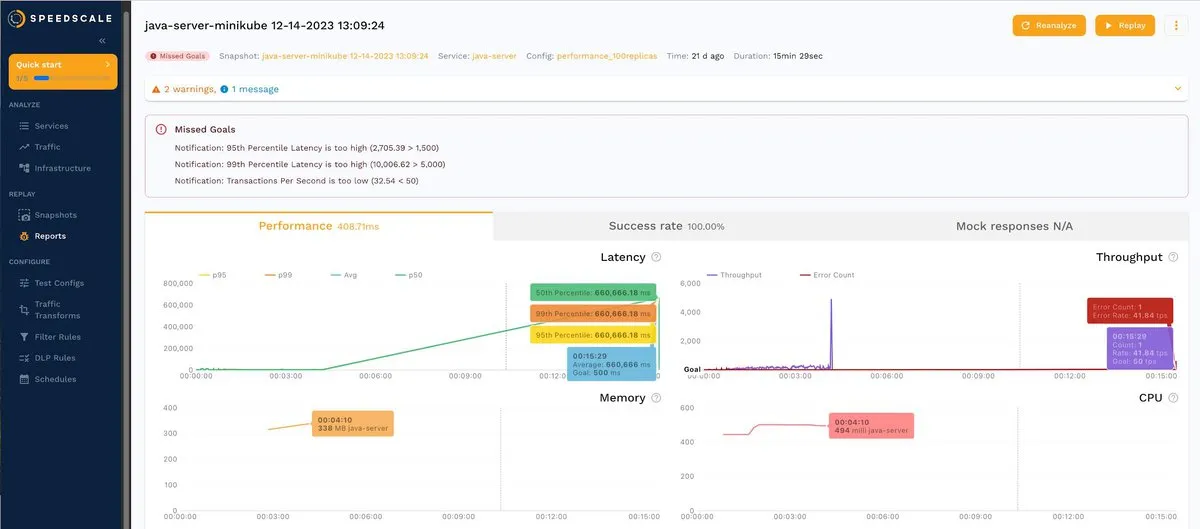
As you can see, Speedscale allows you to easily adjust your goals to quickly detect when the app does not meet your expectations.
Redacting Sensitive Fields (Data Loss Protection)
You also need to know how to protect sensitive data during Kubernetes testing. Consider the following RRPair, where the header exposes the bearer token:
If you click the Info tab, you’ll notice a field called DLP Redacted whose current value is false:
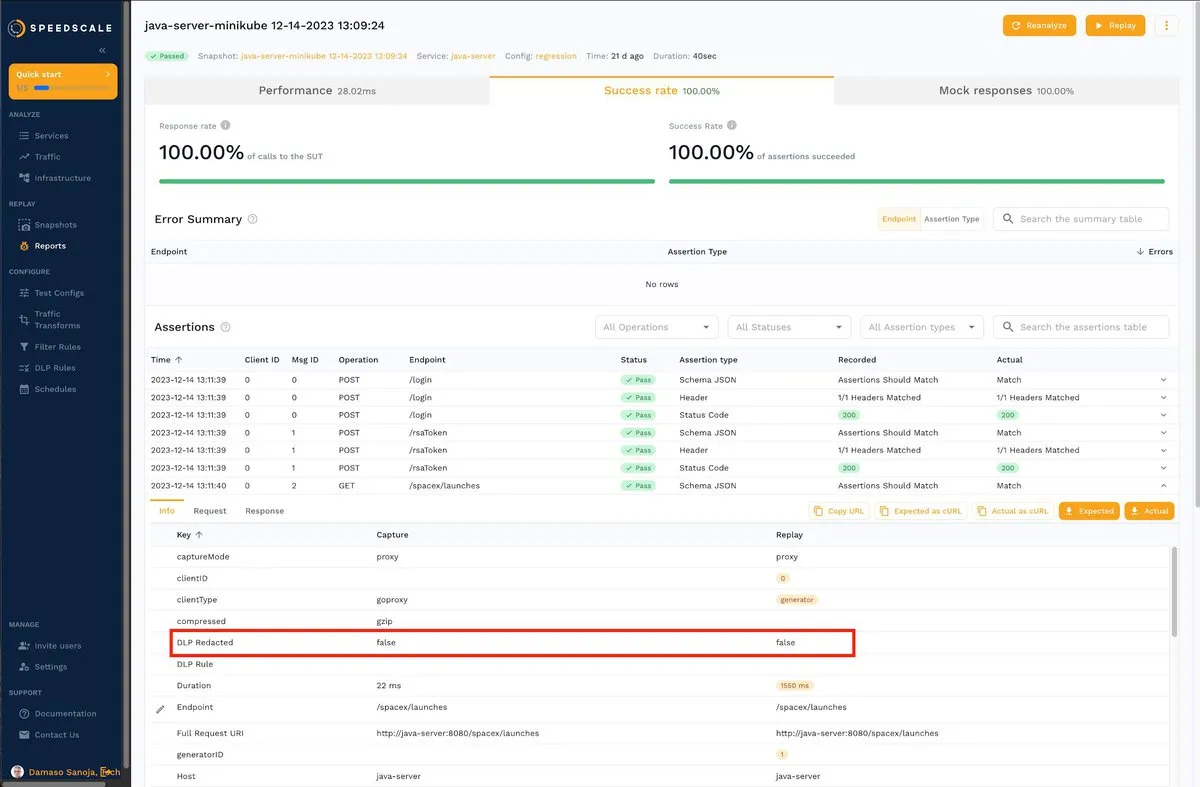
Speedscale comes equipped with a data loss protection (DLP) feature that allows you to write sensitive values like this.
To enable DLP, go to the console, run the command speedctl infra dlp enable, and follow the on-screen instructions:
$ speedctl infra dlp enable

‼ No inspector ID supplied, starting interactive mode

Choose one:

 [1] minikube-19d31516-72cf-40de-96d5-91aea7d1f1bc (cluster minikube)

 [q] Quit

▸ Select your installation [q]: 1

‼ No DLP config supplied, starting interactive mode

Choose one:

 [1] standard

 [q] Quit

▸ Select your DLP config [1]: 1

✔ DLP enabled
Once activated, sensitive values will be automatically redacted. You can find more information about DLP in the documentation.
Uninstalling the Demo App
When you’re ready to leave the tutorial, delete the Speedscale demo app by running the following command from the demo folder:
make kube-cleanThat’s it; you can now start performing Kubernetes testing using Speedscale!
Continuous Testing in CI/CD Pipelines
Your CI/CD pipeline can trigger tests to run in Speedscale. With the speedctl CLI, DevOps teams can arbitrarily run integration tests with Speedscale on any trigger in any execution environment like GitHub Actions, Semaphore, Travis, AppVeyor, CircleCI, and so forth.
Scheduling tasks in Speedscale
Speedscale also supports scheduling tasks such as creating a snapshot or running a replay with cron expressions. Schedules are supported first party, no third party testing tools or CI/CD pipeline is needed.
Conclusion
In this tutorial, you learned about the importance of Kubernetes testing and its relevance from a business perspective. Kubernetes testing ensures high availability, accurate resource provisioning, reduced mean time to resolution (MTTR), compliance with SLOs and SLAs, and early issue detection to minimize costs. Additionally, you explored how you can easily implement Kubernetes testing and streamline your testing processes by using Speedscale.
If you’re ready to take your Kubernetes testing to the next level, give Speedscale a try. Automatically generate load tests, environments, and data with sanitized user traffic—and reduce manual effort by 80 percent. Start your free thirty-day trial today.