The Observability Gap: Why Monitoring Data Should Drive Tests
Most teams already know a lot about production. They have dashboards. They have traces. They have alerts. They have enough telemetry to explain what happened after an incident and enough graphs to argue about it for the rest of the week.
Then they go to test a change and start from scratch.
The integration tests hit a hand-written mock that returns {"status": "ok"}. The load tests replay a CSV somebody exported months ago. Staging is close enough to production right up until it matters.
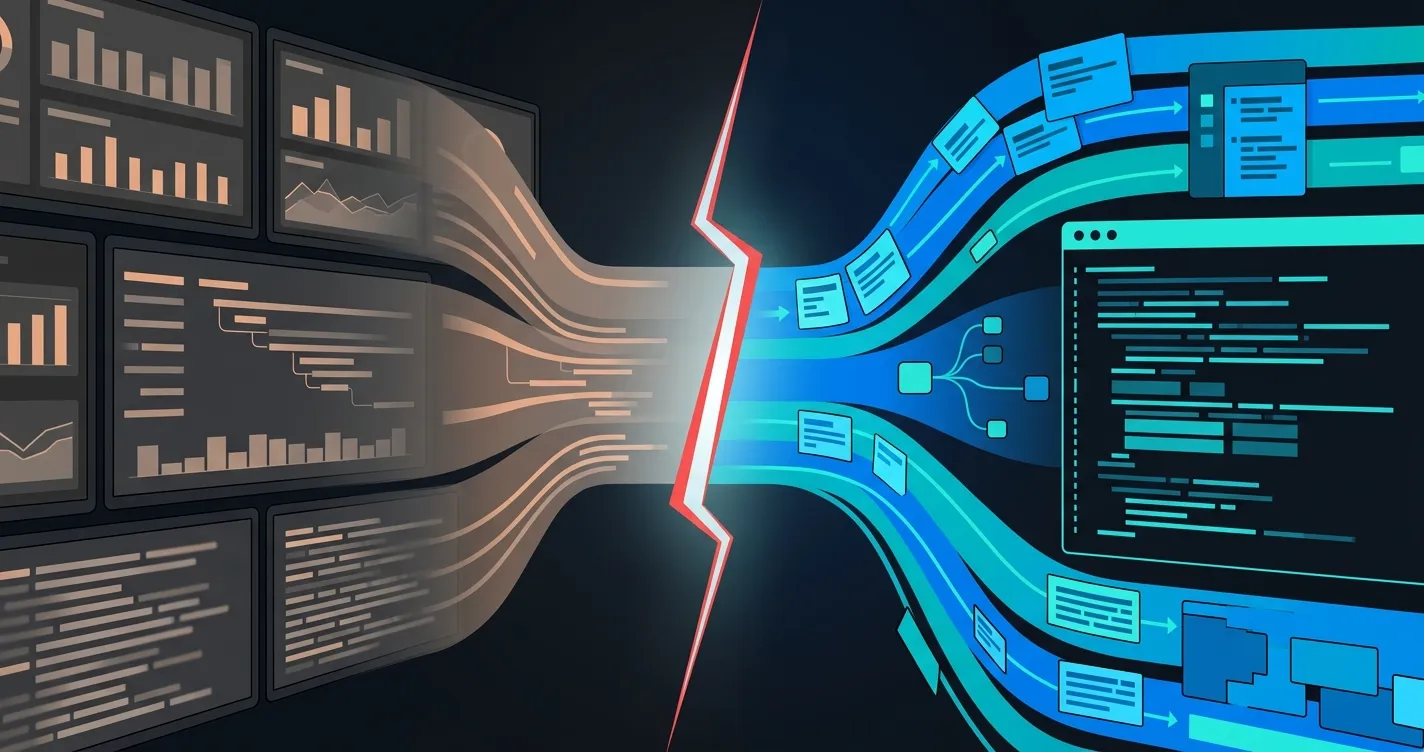
That disconnect is the observability gap. Production is telling you how the system actually behaves. Your tests are still asking the system to behave the way you hope it does.
The $500K blind spot
The average enterprise engineering team spends serious money on observability tooling. Between infrastructure monitoring, APM, log management, and the time required to instrument everything and maintain dashboards, the annual cost gets large fast.
That investment buys you incredible visibility. You can trace a single request through fifteen services. You can see latency distributions at p99. You can correlate error spikes with deployment events. After an incident, you can reconstruct exactly what happened, in what order, and why.
But all of that knowledge flows in one direction: into dashboards, not into tests.
That means your observability stack already knows things your test suite does not:
- What traffic patterns cause failures? Your APM recorded them.
- What dependency behaviors are brittle? Your distributed traces mapped them.
- What latency thresholds matter? Your SLO dashboards defined them.
- What payloads trigger edge cases? Your full-text search captured them.
You already paid to collect the data. You’re just not reusing it where it would prevent the next incident.
Three scenarios where the gap kills you
1. The traffic pattern nobody tested
A retail team runs load tests before Black Friday. The tests simulate 10x normal traffic with a uniform distribution of product page views and checkout flows. Production handles the load fine. Then at 6pm EST a flash sale drives 40x traffic to a single product category while checkout calls spike with coupon-stacking payloads the synthetic tests never generated.
The observability stack recorded this exact pattern from the previous year’s sale. The traffic data existed. Nobody piped it into the test suite.
2. The dependency that changed behavior
A payment service team upgrades their gateway integration. Unit tests pass. Integration tests pass because they mock the gateway with responses captured six months ago. In production, the gateway now returns a new field in its JSON response that breaks the team’s deserialization logic. The API contract technically didn’t change (the field is additive), so contract tests pass too.
The team’s observability platform captured the actual gateway responses, including the new field, weeks before the upgrade. That data was sitting in their traffic snapshots. They tested against a stale mock instead.
3. The SLO violation caught too late
A platform team defines a p99 latency SLO of 200ms for their user-facing API. Their monitoring detects violations within seconds and pages the on-call. But the violation was introduced in a deployment three hours earlier. The code passed all pre-release tests because those tests had no latency baseline derived from production. The performance assertions were arbitrary thresholds a developer guessed were “reasonable.”
Meanwhile, the observability stack had the actual p99 baseline: 142ms. If that number had been the test assertion, the deployment would have been blocked. The golden signals were available pre-release. Nobody connected them to the test pipeline.
Why this gap exists
This is not because engineers are careless. It is because observability and testing were built for different jobs.
Track 1: Observability tools (Datadog, Grafana, Dynatrace, Honeycomb) are optimized for production visibility. They ingest high-cardinality data, build service maps, correlate events, and render dashboards. They are good at answering “what is happening right now?” and “what happened during this incident?” They are mostly reactive. They help you inspect reality after the system has already done something.
Track 2: Testing tools (JUnit, pytest, k6, Postman) are optimized for developer workflows. They run locally or in CI, execute assertions against expected behavior, and report pass/fail. They answer “does this code work?” But the inputs are usually synthetic. The requests are invented. The dependency responses are stale. The thresholds are guesses. Developers assemble the test world from docs, examples, and intuition instead of from production behavior.
The gap is architectural. The data lives in a different system, in a different format, inside a different workflow. Nobody built the bridge between “we can see production” and “we can test against production behavior.”
flowchart TD
    subgraph PROD["Production Reality"]
        direction TB
        P1["Real traffic"]
        P2["Latency baselines"]
        P3["Dependency behavior"]
        P4["Error payloads and traces"]
    end

    G1["Observability gap<br/>Production knowledge never reaches pre-release tests"]

    subgraph TEST["Pre-Release Tests"]
        direction TB
        T1["Synthetic payloads"]
        T2["Guessed thresholds"]
        T3["Stale mocks"]
        T4["Arbitrary assertions"]
    end

    PROD --> G1 --> TEST
Closing the gap
The bridge between observability and testing is production traffic. Not hand-written mocks. Not synthetic payloads. The actual requests and responses your system processes every day.
flowchart TD
    A["1. Capture production traffic"]
    B["2. Transform and sanitize"]
    C["3. Replay as tests"]
    D["4. Assert against production baselines"]
    E["5. Run on every PR"]

    A --> B --> C --> D --> E
    E -. Re-capture periodically .-> A
Here’s the practical workflow:
1. Capture production traffic. Use eBPF-based collection to record real requests and responses flowing through your services at sub-millisecond overhead with no code changes. This gives you the same data your observability platform sees, but in a format you can replay.
2. Transform and sanitize. Production data contains PII, auth tokens, and timestamps that can’t be replayed raw. Strip sensitive fields, rewrite expiring tokens, and adjust time-dependent values automatically. This isn’t optional. It’s a compliance requirement for most enterprises.
3. Replay as tests. Take that captured traffic and replay it against your service before deployment. Now the tests use the same payload shapes production sees. The mocks return the same dependency responses production actually got. The load profile starts to resemble real traffic instead of a developer’s best guess.
4. Assert against production baselines. Instead of arbitrary pass/fail thresholds, use your actual golden signals as assertions. If production p99 is 142ms, your pre-release test should fail if the new code pushes it past 160ms. If your error rate in production is 0.1%, your test should fail at 0.5%. The baselines already exist in your observability platform — use them.
5. Run on every PR. Capture once. Replay on every pull request. Fail fast. Re-capture periodically to keep your test data fresh. The CI pipeline becomes the enforcement point: no deployment ships without passing a production-realistic validation.
This is not some exotic new testing methodology. It is just a more honest one. Your observability stack already captured the highest-fidelity test input you are ever going to get. The missing piece is taking that production behavior and feeding it back into validation before the next deploy.
What changes when the gap closes
When teams close this gap, three things happen pretty quickly:
Incidents drop because tests start catching production-shaped failures. The edge cases that only show up under real traffic patterns, real dependency behavior, and real latency distributions get caught earlier. You stop being surprised by behavior you already had evidence for.
Staging gets less precious. When tests use real traffic and real dependency responses, you do not need a staging environment that perfectly mirrors production for every change. The realism comes from the traffic. The environment just needs to execute the code.
Observability starts paying for prevention, not just diagnosis. The same traffic that populates dashboards now feeds tests. Instead of spending money purely to explain outages after the fact, you start using the same data to block regressions before they ship.
See the observability gap in action
If you want the short version, these Speedscale videos make the same argument from three different angles: why dashboards are not enough, how to search real traffic instead of guessing, and why protocol-level visibility matters once observability gets thin.
How Speedscale's Traffic Viewer Complements Your Production Monitoring System
Why metrics and traces tell you that something is wrong, but payload-level traffic tells you why.
Watch the video →Stop Guessing! Speedscale's Notebook Finds Anything in Your Traffic.
See how full-fidelity traffic search closes the gap between a vague symptom and the exact request that caused it.
Watch the video →Why gRPC Is a Debugging Nightmare
Binary payloads, HTTP/2 multiplexing, and missing wire data are exactly where traditional observability starts to fall short.
Watch the short →Getting started
You do not need to re-architect your testing stack to try this. Start with one service, ideally one that recently had a production issue your tests should have caught but did not.
- Capture a traffic snapshot from that service using
proxymock(open source, runs locally) or Speedscale’s eBPF collector for Kubernetes environments. - Replay the captured traffic as a regression test. See what your current code does with real production inputs.
- Add it to your CI pipeline so every future PR is validated against that snapshot.
- Set baseline assertions using your actual production metrics: latency, error rate, throughput.
You already paid to learn from production. Stop discarding that lesson when it is time to test.
Try proxymock for free | See Speedscale for Kubernetes | Schedule a demo
FAQ
What’s the difference between observability-driven testing and just using production data for tests?
“Using production data” typically means copying a database snapshot into staging. Observability-driven testing is more precise: it captures the actual API traffic (requests, responses, timing) flowing through your services and replays it as tests. You’re not just using production data. You’re using production behavior.
Does this replace unit tests or integration tests?
No. Unit tests validate logic. Integration tests validate contracts. Observability-driven testing validates that your system handles real production traffic correctly. They’re complementary layers. Think of it as the validation pyramid: unit tests at the base, integration tests in the middle, and production-traffic replay at the top.
How do you handle PII and sensitive data in captured traffic?
Production traffic must be sanitized before replay. This means stripping PII fields, redacting payment data, and rewriting auth tokens. Speedscale and proxymock handle this automatically via configurable DLP rules that scrub sensitive data before it leaves the capture pipeline. The sanitized traffic is safe for dev and CI environments.