
In software development, load testing plays a critical role in ensuring that applications perform optimally under any imaginable load condition. To do this, developers subject applications to several types of load tests, including scalability, spike, endurance, and stress testing. The ultimate goal of these performance tests is to pinpoint potential bottlenecks and ensure the reliability of the overall system where the software application runs before reaching production. Needless to say, choosing the best load testing tool is an important part of the process, as each project has its own unique requirements.
This article provides a comprehensive comparison of the top six load testing tools: Speedscale, JMeter, Locust, Gatling, Tricentis NeoLoad, and k6. The comparison will cover aspects like key features, user interface and experience, ease of use, pricing, integration capabilities, platform reliability, documentation and support, and overall maturity and adaptability. By the end of the article, you’ll be equipped to make an informed decision about the best performance testing tool for your specific project and requirements.
Speedscale
Speedscale is unique in this lineup as it’s the only purpose-built Kubernetes performance testing tool in the roundup that integrates user behavior and traffic into the mix.
Let’s see how much value it brings to load testing.
Features
The tools in this roundup seek to address two key challenges common to load testing: making the test creation process simple and having the ability to create realistic and thus reliable tests.
Locust and Gatling strip out all the bloat for simplicity, while JMeter/BlazeMeter, NeoLoad, and k6 focus their efforts on improving UI/UX to make the process more user-friendly. However, at their core, all of these tools create test scripts based on guesswork, not real traffic from production.
When dealing with modern applications running in environments as complex as Kubernetes, the ideal approach is to create accurate load tests based on actual traffic. That’s exactly what Speedscale does.
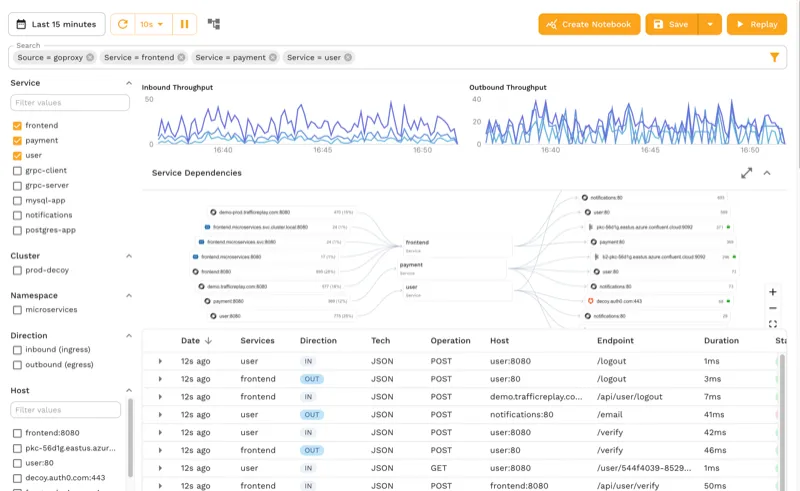
Speedscale captures your application’s actual traffic and measures key performance metrics like latency, throughput, saturation, error rate, and more. Once captured, you can replay traffic to simulate different load conditions. You can even mock internal and external dependencies through advanced service mocking and transform traffic before it’s replayed.
Simply put, with Speedscale, you can import a Postman collection or any other test file and either run your tests like other conventional tools or use its AI capabilities to train test models based on production traffic, mock all dependencies to mimic production-like test scenarios, and run accurate load tests. For local development, proxymock brings the same traffic capture and replay capabilities to your laptop without requiring a Kubernetes cluster.
UI/UX and Ease of Use
Interactions with Speedscale are done either through the speedctl CLI or the Speedscale dashboard. The CLI makes it easy to install Speedscale on Docker, a virtual machine, or Kubernetes, while the GUI provides a graphical environment from which developers can capture and replay production traffic, analyze or filter it according to different criteria, and transform it.
Additionally, Speedscale provides detailed test reports where you can review performance metrics, the success rate, and logs for each test.
Price
Speedscale offers three tiers: Startup, Pro, and Enterprise. The Startup tier provides up to 50 GB of transfer per month and includes community support at a cost of $100 per GB. For a full breakdown of what each tier includes, visit the pricing page.
Integration with Other Services
Speedscale provides integrations with popular Kubernetes distributions, observability tools, APIs, and CI/CD tools. Being Kubernetes-based, Speedscale integrates directly with other cloud-native tools such as Argo Rollouts.
Reliability
Speedscale has proven itself able to handle all types of workloads with ease. It was built from the ground up for cloud computing, Kubernetes, and AI. Companies like a national restaurant chain use Speedscale to ensure they can process over 300,000 requests per minute during peak meal times.
Documentation and Support
Similar to other enterprise-grade tools like NeoLoad or Grafana k6, Speedscale offers learning resources. There is the documentation, of course, but you also have white papers, case studies, comparisons with other load test tools, tutorials, webinars, a blog, and a vibrant Slack community.
Depending on the tier you select, support can be found via the community resources listed above (Startup), on business days via the contact form (Pro), or through a dedicated Slack channel (Enterprise).
Maturity and Adaptation
Speedscale, despite being the youngest tool in this roundup (it was launched in 2020), doesn’t lack maturity or adaptability. In fact, it holds a significant advantage over other tools by being purpose-built for load testing Kubernetes applications. As a result, Speedscale integrates with other cloud-native apps and services, offering strong scalability and reliable performance testing capabilities within Kubernetes environments.
Key Takeaways
Its innovative approach to mimicking real production traffic makes Speedscale an ideal tool for load testing complex microservices running in Kubernetes.
Apache JMeter with BlazeMeter Augmentation Layer
JMeter is widely regarded as the benchmark for load testing tools. For starters, it was developed by the Apache Software Foundation, one of the most recognized players in the open source ecosystem. Additionally, since its introduction in 1998, JMeter has shown a solid track record in terms of scalability, reliability, and flexibility.
This roundup reviews JMeter in conjunction with the BlazeMeter plugin, which acts as an augmentation layer and adds several additional features to JMeter.
Features
JMeter boasts many features, including the ability to perform diverse load tests on applications, databases, and servers using a multitude of protocols (such as HTTP, HTTPS, SMTP, SOAP/REST, and more). Additionally, its Test IDE can simulate and record user behavior from browsers and web applications. Moreover, JMeter uses a plugin architecture (more on this later) that makes it easy to add more features as needed. Proof of this extensibility is the BlazeMeter plugin, which enhances JMeter by providing additional features such as cloud-based load testing capabilities, scalability to thousands of concurrent users across global locations, end-to-end API testing and monitoring, mock services, and test data.
These are just some of the key features that BlazeMeter adds to JMeter; you can check out how to perform service virtualization, use private locations, run API monitoring, and more.
UI/UX and Ease of Use
JMeter comes natively with a basic GUI, from which you can build a web test plan, record tests, use the access log sampler, and more.
However, BlazeMeter provides a more intuitive and advanced GUI that enhances the user experience. From the BlazeMeter GUI, you can run functional testing and review test reports, create workspace alerts, manage personal and team settings, conduct performance testing, and much more.
Overall, this combination offers a strong and intuitive UI, simplifying the testing process and ensuring comprehensive software performance evaluation for web and application servers.
Price
JMeter is an open source performance testing tool and is free to use under the Apache License Version 2.0. For its part, BlazeMeter offers plans starting at $99/month for the Basic plan and going up to $499/month for the Pro plan. For more details on each plan, visit the BlazeMeter pricing page.
Integration with Other Services
Both JMeter and BlazeMeter offer several integrations. JMeter has over 100 custom plugins. Some notable mentions include the Jenkins plugin for advanced testing integration with your CI/CD pipelines and the Grafana plugin for enhanced observability of test results.
BlazeMeter also offers integrations for popular CI/CD platforms like Jenkins and GitHub Actions, APM platforms like New Relic and Datadog, as well as integrations for the Security Assertion Markup Language (SAML) 2.0 protocols supported by identity and access management platforms like Auth0 and Okta.
Reliability
JMeter is a time-tested load testing platform, while BlazeMeter is a solid SaaS solution that adds enhanced functionality, scalability, and ease of use to JMeter.
Documentation and Support
Combining JMeter with BlazeMeter offers a range of benefits. BlazeMeter provides comprehensive documentation as well as strong commercial support. On the other hand, JMeter offers detailed documentation, issue tracking, and a mailing list.
Maturity and Adaptation
More than twenty years in the market have consolidated JMeter as one of the most mature and reliable load testing tools today. As mentioned, its open architecture also makes it very flexible, which has allowed it to integrate with more modern tools such as BlazeMeter—a testament to its great adaptability.
Key Takeaways
Overall, using JMeter and BlazeMeter together allows you to combine JMeter’s robustness and BlazeMeter’s scalability. This combination enhances JMeter load testing capabilities by providing advanced reporting, better scalability, and ease of use.
Blog Post: Top 5 JMeter Alternatives
Locust
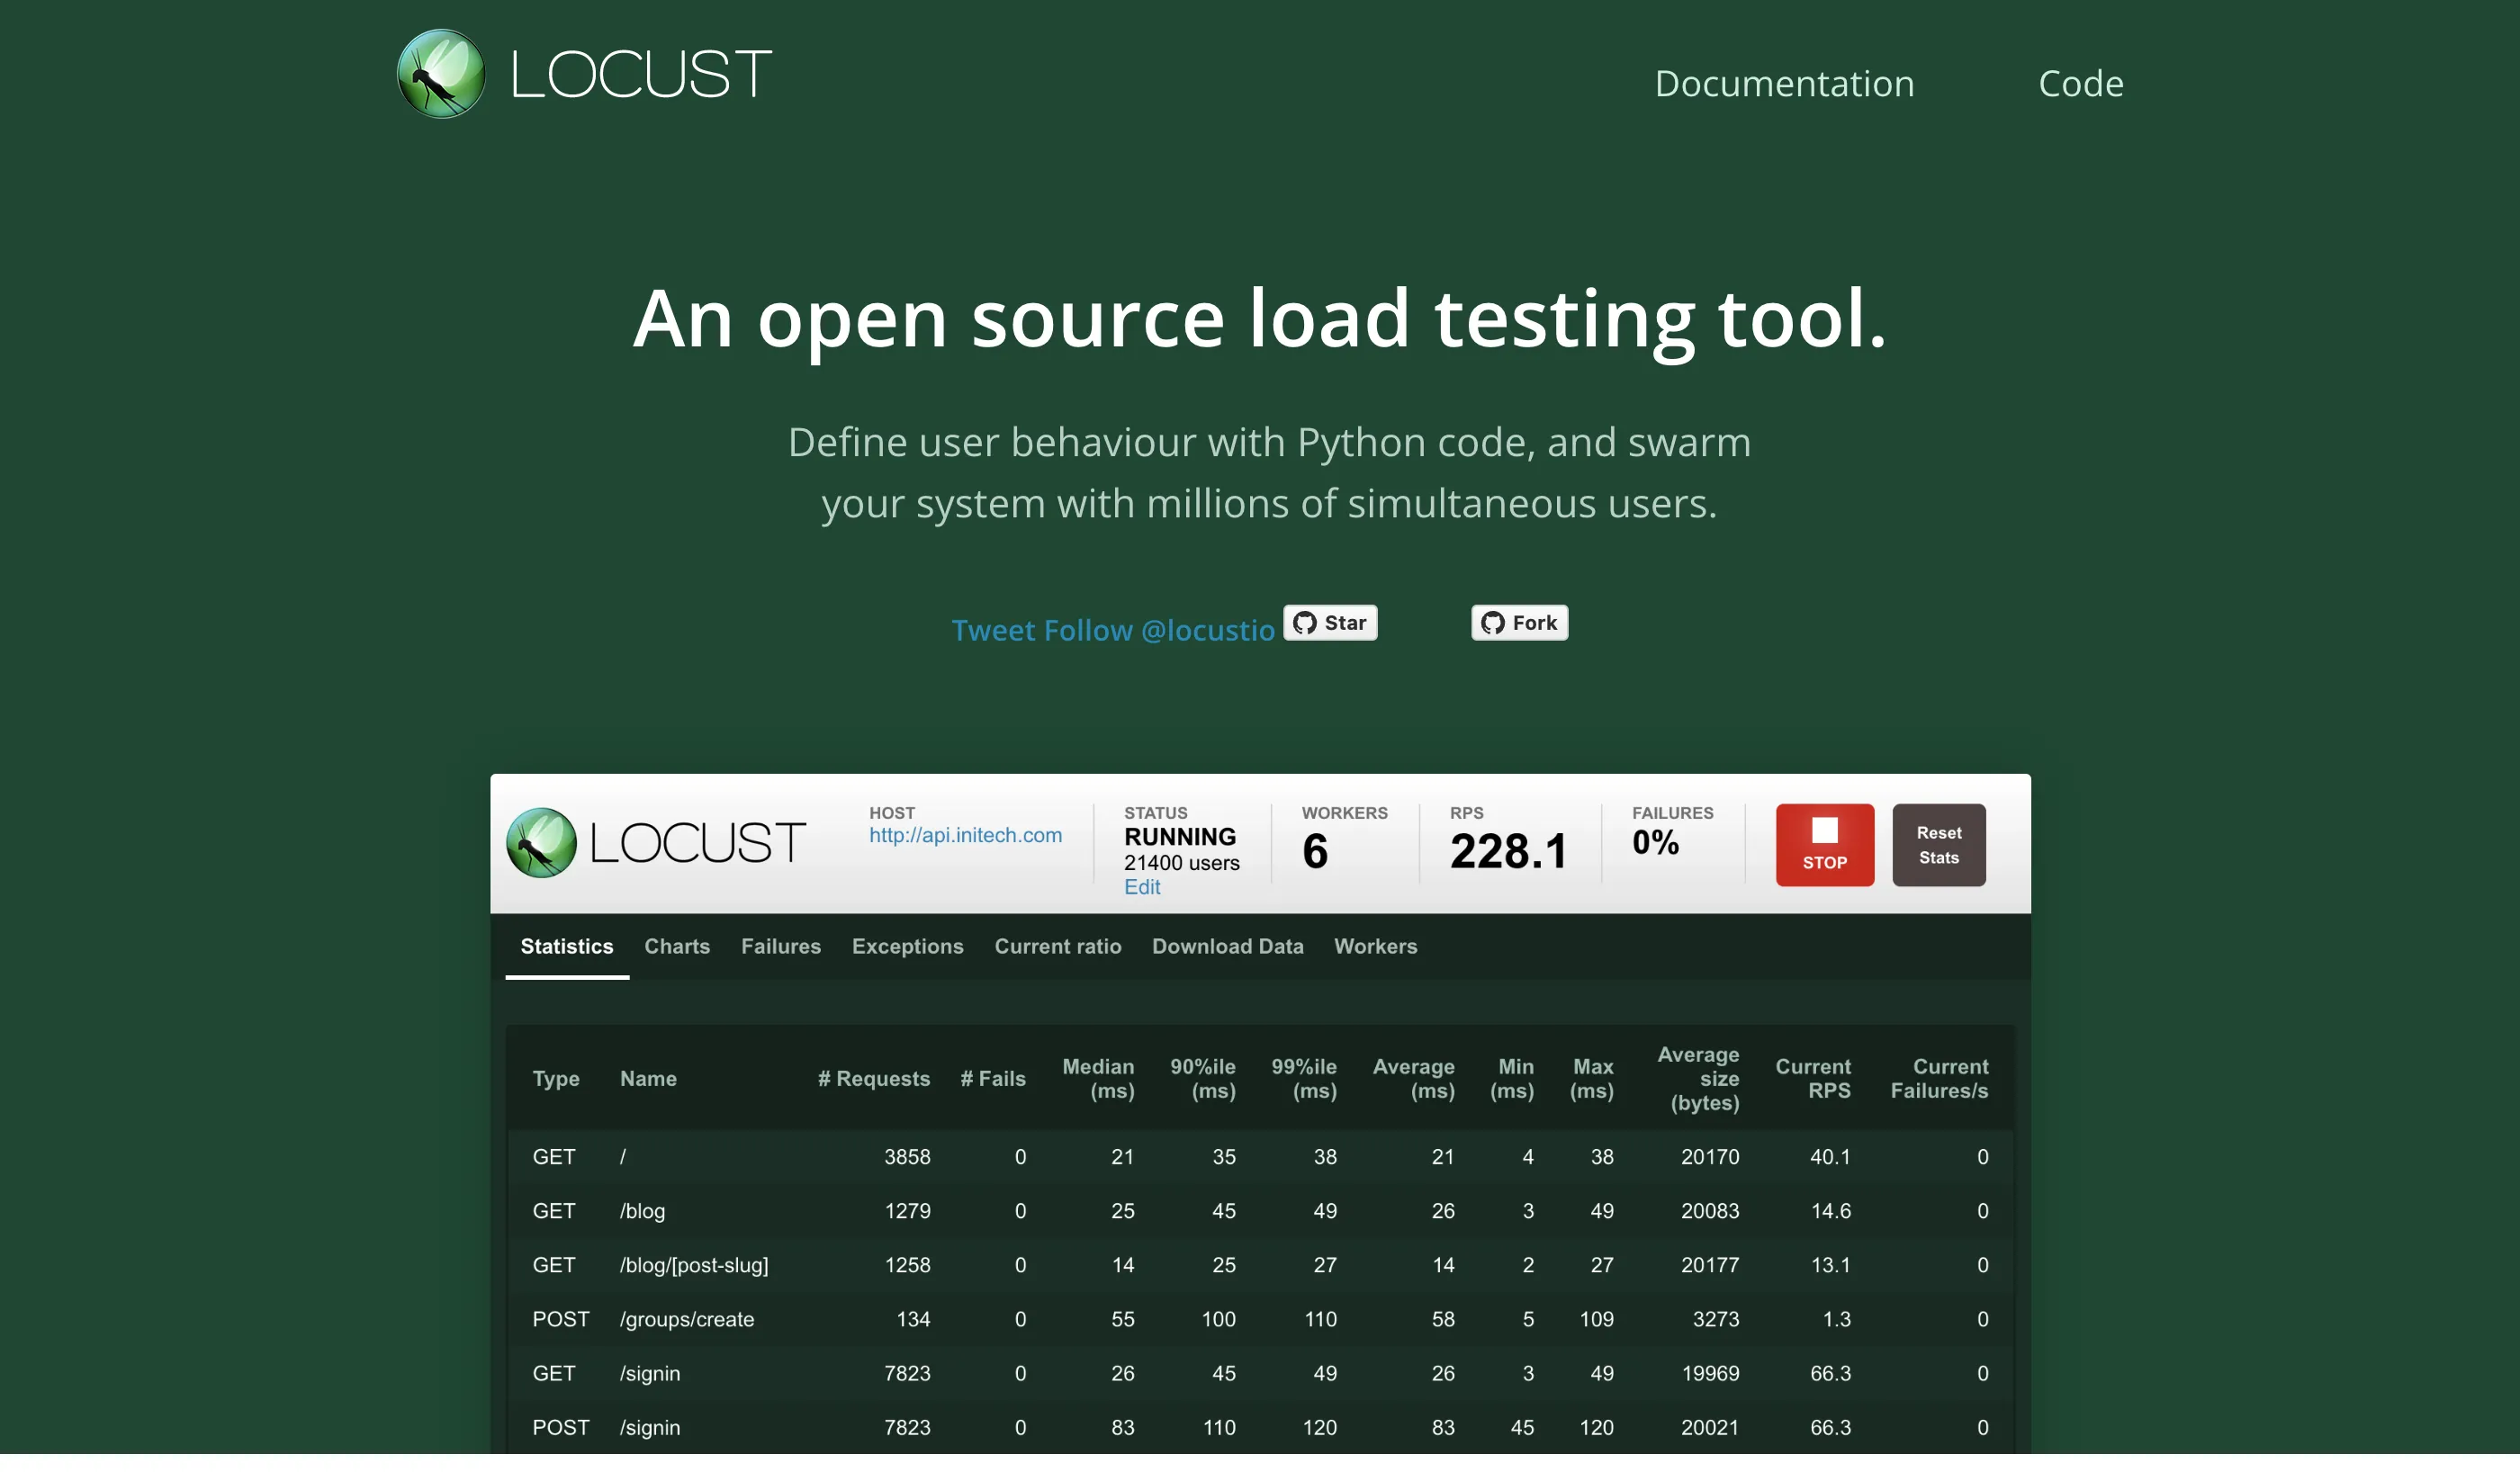
Locust is a developer-friendly, open source load testing tool known for its simplicity and ease of use. With its Python-based scripting and minimal setup requirements, Locust enables developers to quickly create scalable load tests. Let’s review what makes this tool so special.
Features
Locust simplifies load testing by allowing performance test scenarios to be written in plain Python code, promoting flexibility and ease of use. It facilitates running load tests distributed across multiple instances and serves as a library to embed tests in Python code, making it a versatile and powerful performance testing solution.
UI/UX and Ease of Use
Locust is arguably the easiest-to-use load testing tool in this roundup, at least for developers familiar with Python. You can work entirely from its CLI or use its minimalist GUI. This simplicity makes it ideal for developers looking for a straightforward load testing tool.
Price
Just like JMeter, Locust is free and open source. It uses the MIT License, which is also a permissive open source license that allows users to do almost anything with the software as long as the original copyright and license notices are included.
Integration with Other Services
While Locust doesn’t have a list of integrations as impressive as JMeter, you can add those that are available with a simple command: pip install locust-plugins. This will give you new capabilities like importing test data from CSV and MongoDB, support for logging transactions, and new protocols like Kafka and Selenium WebDriver.
Reliability
Using Python in the backend makes Locust a reliable load testing tool due to Python’s battle-tested nature and simplicity-focused approach. That said, it’s important to keep in mind that Locust is more geared toward simple, local tests than complex, large-scale load tests, largely due to Python’s single-core limitation. In short, you can expect reliable test results from Locust as long as you work with relatively simple projects.
Documentation and Support
Similar to JMeter, Locust support is community-based. Articles, blog posts, tutorials, and forums are the primary sources of support when you need help. As for its documentation, it’s comprehensive and easy to understand.
Maturity and Adaptation
Locust has been around since 2011, which, combined with its roots in Python, makes it an extremely mature tool. Moreover, as mentioned, you can embed a load test from your own Python code, making Locust one of the most flexible tools in the roundup.
Key Takeaways
Locust stands out as the ideal load testing tool for Python developers looking for a hassle-free solution to test their applications.
Blog Post: Speedscale & Locust: Comparing Performance Testing Tools
Gatling
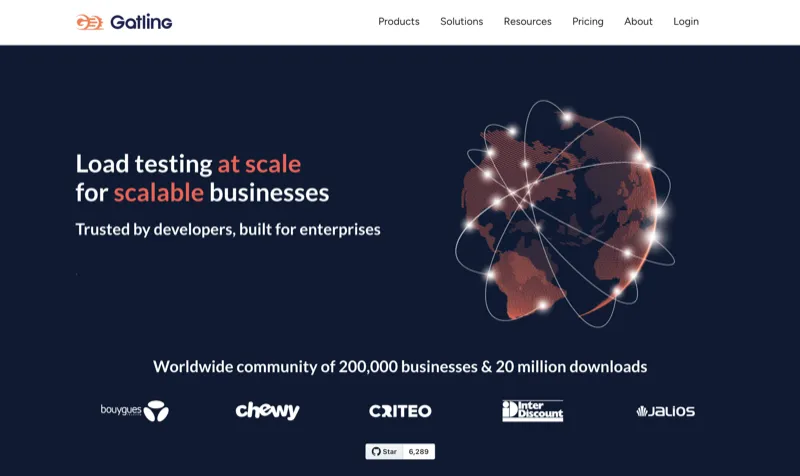
Similar to Locust, Gatling favors the test-as-code principle. In fact, it takes it a step further by supporting languages such as JavaScript, TypeScript, Java, Kotlin, and Scala. However, unlike Locust, Gatling comes in two flavors: Gatling open source, ideal for local testing, and Gatling Enterprise, aimed at large deployments that require more advanced features. Let’s review them.
Features
Gatling supports a wide variety of protocols, including HTTP, WebSockets, server-sent events (SSE), MQTT, and gRPC, although the latter two are exclusive to the Enterprise version.
Additionally, Gatling offers a built-in reporting engine that offers static reports in the open source version and detailed reports and analytics in the Enterprise version. On top of that, the Enterprise version also offers trends for simulations, where you can compare test results.
UI/UX and Ease of Use
As already mentioned, Gatling is aligned with the test-as-code principle, so you can get started with Gatling and create simulations right from your IDE, which can be convenient for savvy developers using the open source version.
For its part, Gatling Enterprise comes equipped with a no-code feature that allows you to create load tests in no time. Additionally, the Gatling Recorder allows you to capture browser-based actions to create a realistic user scenario for load testing, similar to NeoLoad’s RealBrowser.
Overall, the ease of use and user experience with Gatling will be determined by the developer’s experience and the version used.
Price
As you might expect, Gatling open source is freely available (under the Apache License 2.0). On the other hand, Gatling also offers paid versions, starting at €89/month for two users and sixty minutes of load generator. For more details on the different tiers, head over to the Gatling pricing page.
Integration with Other Services
Despite being targeted at enterprise users, Gatling doesn’t have as many integrations as you might expect. Basically, it has plugins for build tools like Maven, Gradle, and sbt that are very helpful for configuring Gatling instances.
The Enterprise version also has support for CI/CD pipelines like Jenkins, GitHub Actions, GitLab CI/CD, and others. Additionally, the Enterprise version also includes integration with Grafana Datasource for better visualization.
Reliability
Gatling is a load test tool created to have a low resource footprint and the ability to handle high loads, which gives it great reliability, as demonstrated by success stories from companies that opted for the simplicity and scalability of Gatling Enterprise.
Documentation and Support
Even though Gatling’s documentation is somewhat thin, it makes up for it with other resources such as Gatling Academy, videos and webinars, its blog, and its community forum.
Regarding commercial support, depending on the plan you subscribe to, the response times can vary from one to three business days.
Maturity and Adaptation
Gatling was launched in 2012, so it’s not new to the load testing arena. It’s a mature and proven tool used by companies across a variety of industries that rely on its ability to perform large-scale testing. As for adaptability, Gatling’s script-based nature gives it the flexibility to integrate into any modern workflow.
Key Takeaways
Gatling offers a mix of Locust’s test-as-code approach and the enterprise-level capabilities of JMeter/BlazeMeter, making it an interesting alternative for organizations that have developers with knowledge of Java, Kotlin, Scala, or JavaScript.
That said, writing realistic script tests with Gatling is a time-consuming process that requires patience and deep knowledge of programming languages and load testing design.
Blog Post: Gatling vs. Speedscale for Kubernetes Load Testing
Tricentis NeoLoad
NeoLoad is the first performance testing tool in this roundup based on Kubernetes. Thanks to this, NeoLoad offers impressive scalability out of the box, which puts it on par (at least in that department) with the JMeter/BlazeMeter duo.
Features
Given its Kubernetes-based architecture, it’s no surprise that NeoLoad is focused on facilitating load testing in cloud-native applications. To do so, it employs a protocol-based approach for backend testing through monitoring agents, along with its proprietary browser-based testing framework called RealBrowser, which captures client-side metrics and interactions.
In other words, NeoLoad provides both frontend and backend testing in a single platform, which is a huge plus since it allows engineers to record real-life users with RealBrowser while also being able to design custom load tests programmatically.
Other key features worth mentioning include SOAP/web services support with options for REST and WSDL API testing, creating user paths based on Swagger/OpenAPI files, real-time test results visibility, and automatic pass/fail performance SLA validation based on runtime parameters.
UI/UX and Ease of Use
NeoLoad’s intuitive GUI drives its user interface and experience. While developers can create load tests programmatically (as explained above), the platform’s simplicity shines through its test design process. You begin by recording a virtual user with RealBrowser, then validate the behavior (editing it as necessary) and iterate to create several virtual users with different behaviors. This approach ensures a simple testing process for a range of scenarios.
Price
NeoLoad’s pricing is determined by the number of virtual users (VUs) simulated in performance tests. According to its website, the starting price is $20,000 USD per year for 300 virtual users, offering unrestricted test runs to facilitate continuous testing for all team members. Additionally, volume discounts are accessible for larger VU quantities.
Integration with Other Services
Similar to JMeter and BlazeMeter, NeoLoad offers a broad catalog of integrations with tools that cover the entire DevOps toolchain, including APM tools, CI/CD, functional testing, version control, and even SAP testing.
It’s worth mentioning that you can also install NeoLoads plugins in JMeter and Gatling in order to send live data from these tools to be analyzed in NeoLoad.
Reliability
When it comes to reliability, NeoLoad doesn’t disappoint. Its roots in Kubernetes allow you to run NeoLoad on-premise or on private clouds on OpenShift, AKS, EKS, or GKE. Moreover, being an enterprise-level platform, you can expect rock-solid support, as explored in the next section.
Documentation and Support
NeoLoad provides some of the most comprehensive and intuitive documentation on this list. Additionally, customers have access to an extensive knowledge base written by experts, as well as an academy with certified courses.
In addition to the above, there are other resources available, such as case studies, e-books, webinars, reports and white papers, and the Tricentis Blog.
Overall, training will not be an obstacle. However, if you require support, you have the Tricentis Support Hub as well as a Customer Success Team at your disposal.
Maturity and Adaptation
NeoLoad has been on the market for almost twenty years, and during this time it has matured to become one of the most complete performance testing tools today. Moreover, its large number of integrations and cloud-native approach make it one of the most flexible load testing tools in the roundup.
Key Takeaways
While NeoLoad is a software performance testing tool with a lot to offer, like most tools in this roundup, it requires an arduous planning process to create realistic tests.
Blog Post: Kubernetes Load Testing: Speedscale vs NeoLoad
k6
Similar to Gatling, k6 actually refers to two tools: the k6 open source software (OSS) used by developers, QA engineers, and SREs mainly to perform local tests on macOS, Linux, and Windows, and the SaaS version called Grafana Cloud k6, which actually uses k6 OSS under the hood but adds the flexibility of the cloud and other nice features to the equation.
Features
Grafana k6 offers a developer-friendly CLI with powerful APIs for scripting and executing tests. It supports JavaScript test scripting with local and remote module support, ensuring flexibility and extensibility. With a focus on minimal resource consumption, k6 excels in load testing, stress testing, and soak testing.
Additionally, k6 provides browser testing capabilities through k6 browser, enabling comprehensive performance monitoring. Moreover, k6 is also capable of automatic synthetic monitoring through Grafana Cloud, allowing teams to continuously validate system performance and availability and facilitating the early detection of performance regressions and issues.
Overall, k6, particularly Grafana Cloud k6, offers a range of features that are hard to beat.
UI/UX and Ease of Use
Grafana Cloud k6 offers an exceptional UI/UX, prioritizing ease of use and developer experience. This is no surprise, since Grafana even has a load testing manifesto that emphasizes the importance of developer experience.
The manifesto also highlights how important it is for k6 to foster the principles of “everything as code” and automation. Last but not least, Grafana Cloud k6’s GUI reflects Grafana’s extensive experience in designing observability dashboards, ensuring a top-tier and intuitive user experience.
Price
k6 OSS is free to use, modify, and distribute under the AGPL-3.0 license. On the other hand, Grafana Cloud offers a free plan, a Pro plan with a pay-as-you-go model, and an Advanced plan that offers an enterprise bundle consisting of 2x usage, Enterprise plugins, and 24/7 support for $299/month.
For details on each plan, visit the Grafana pricing page. Please note that these plans give you access to the full Grafana Cloud ecosystem, not just k6, making it a good deal if your organization is interested in Grafana’s observability solutions.
Integration with Other Services
Besides Grafana Cloud, k6 offers a large number of integrations with CI/CD pipelines, codeless authoring tools, IDEs, test management tools, and more. On top of that, Grafana Enterprise offers exclusive plugins for a multitude of SaaS solutions, including Salesforce, SAP HANA, ServiceNow, Snowflake, Splunk, and AppDynamics, among many others.
Reliability
With over 20 million users worldwide, Grafana has built a reputation for delivering reliable solutions, and k6 is no exception. Whether you require load testing on your laptop or on the cloud at scale, k6 won’t let you down.
Documentation and Support
The learning resources offered by Grafana k6 are second to none. Besides the documentation, you have detailed code examples, tutorials, the Grafana Labs Blog, community forums, a Slack community, webinars and videos, hands-on workshops, and events like GrafanaCON.
As mentioned, support depends on the plan you subscribe to. For instance, the Pro plan offers support during business hours, while the Enterprise plan provides 24/7 uninterrupted support.
Maturity and Adaptation
Since its launch in 2017, k6 has proven to be a developer-friendly performance testing solution with great versatility. After becoming part of the Grafana suite in 2021, these advantages were enhanced by the experience and cloud infrastructure offered by Grafana Cloud.
Key Takeaways
Grafana k6 is one of the most versatile and developer-friendly performance testing tools in the roundup, both for load testing locally and on the cloud.
Blog Post: Top 5 k6 Alternatives
Conclusion
This roundup reviewed some of the best load testing tools, including the simplest ones like Locust and Gatling, beloved tools like JMeter, and advanced performance tools like k6, NeoLoad, and Speedscale.
Depending on the complexity of your project and the infrastructure where it will run, one performance testing tool may be more suitable than another. The following table provides a summary of the pros, cons, and ideal use cases of each:
| Tool | Pros | Cons | Ideal Fit |
|---|---|---|---|
| Speedscale | Mimics real production traffic | Primarily supports modern tech like K8S | Kubernetes apps |
| Blazemeter | Battle-tested, flexible with scripting | Requires additional plugins | Load testing HTTP apps |
| Locust | Simple, Python-based | Limited scalability | Python teams |
| Gatling | Flexible, test-as-code approach | Not as many integrations as other tools | Java teams |
| NeoLoad | High scalability | Does not replicate real traffic | Load testing legacy apps |
| Grafana k6 | Simple, JavaScript based | Not based on real traffic | JavaScript teams, Grafana customers |
If your team runs microservices on Kubernetes, try Speedscale to see how traffic replay compares to scripted load tests. For local development, proxymock brings the same capture-and-replay workflow to your laptop.