Testing LLM backends for performance Guide
While incredibly powerful, one of the challenges when building an LLM application (large language model) is dealing with performance implications. However one of the first challenges you’ll face when testing LLMs is that there are many evaluation metrics. For simplicity let’s take a look at this through a few different test cases for testing LLMs:
- Capability Benchmarks - how well can the model answer prompts?
- Model Training - what are the costs and time required to train and fine tune models?
- Latency and Throughput - how fast will the model respond in production?
A majority of the software engineering blogs you’ll find related to LLM software testing cover capabilities and training. However the reality is that these are edge cases and you’ll likely call a 3rd party API to take cover capabilities and training. What you’re left with is figuring out performance testing— how to improve the latency and throughput— which is the focus of the majority of this article.
Capability Benchmarks
Here is an example of a recent benchmark test suite from Anthropic about the comparison of the Claude models compared with generative AI models from OpenAI and Google. These capability benchmarks help you understand how accurate the responses are at tasks like getting a correct answer to a math problem or code generation.
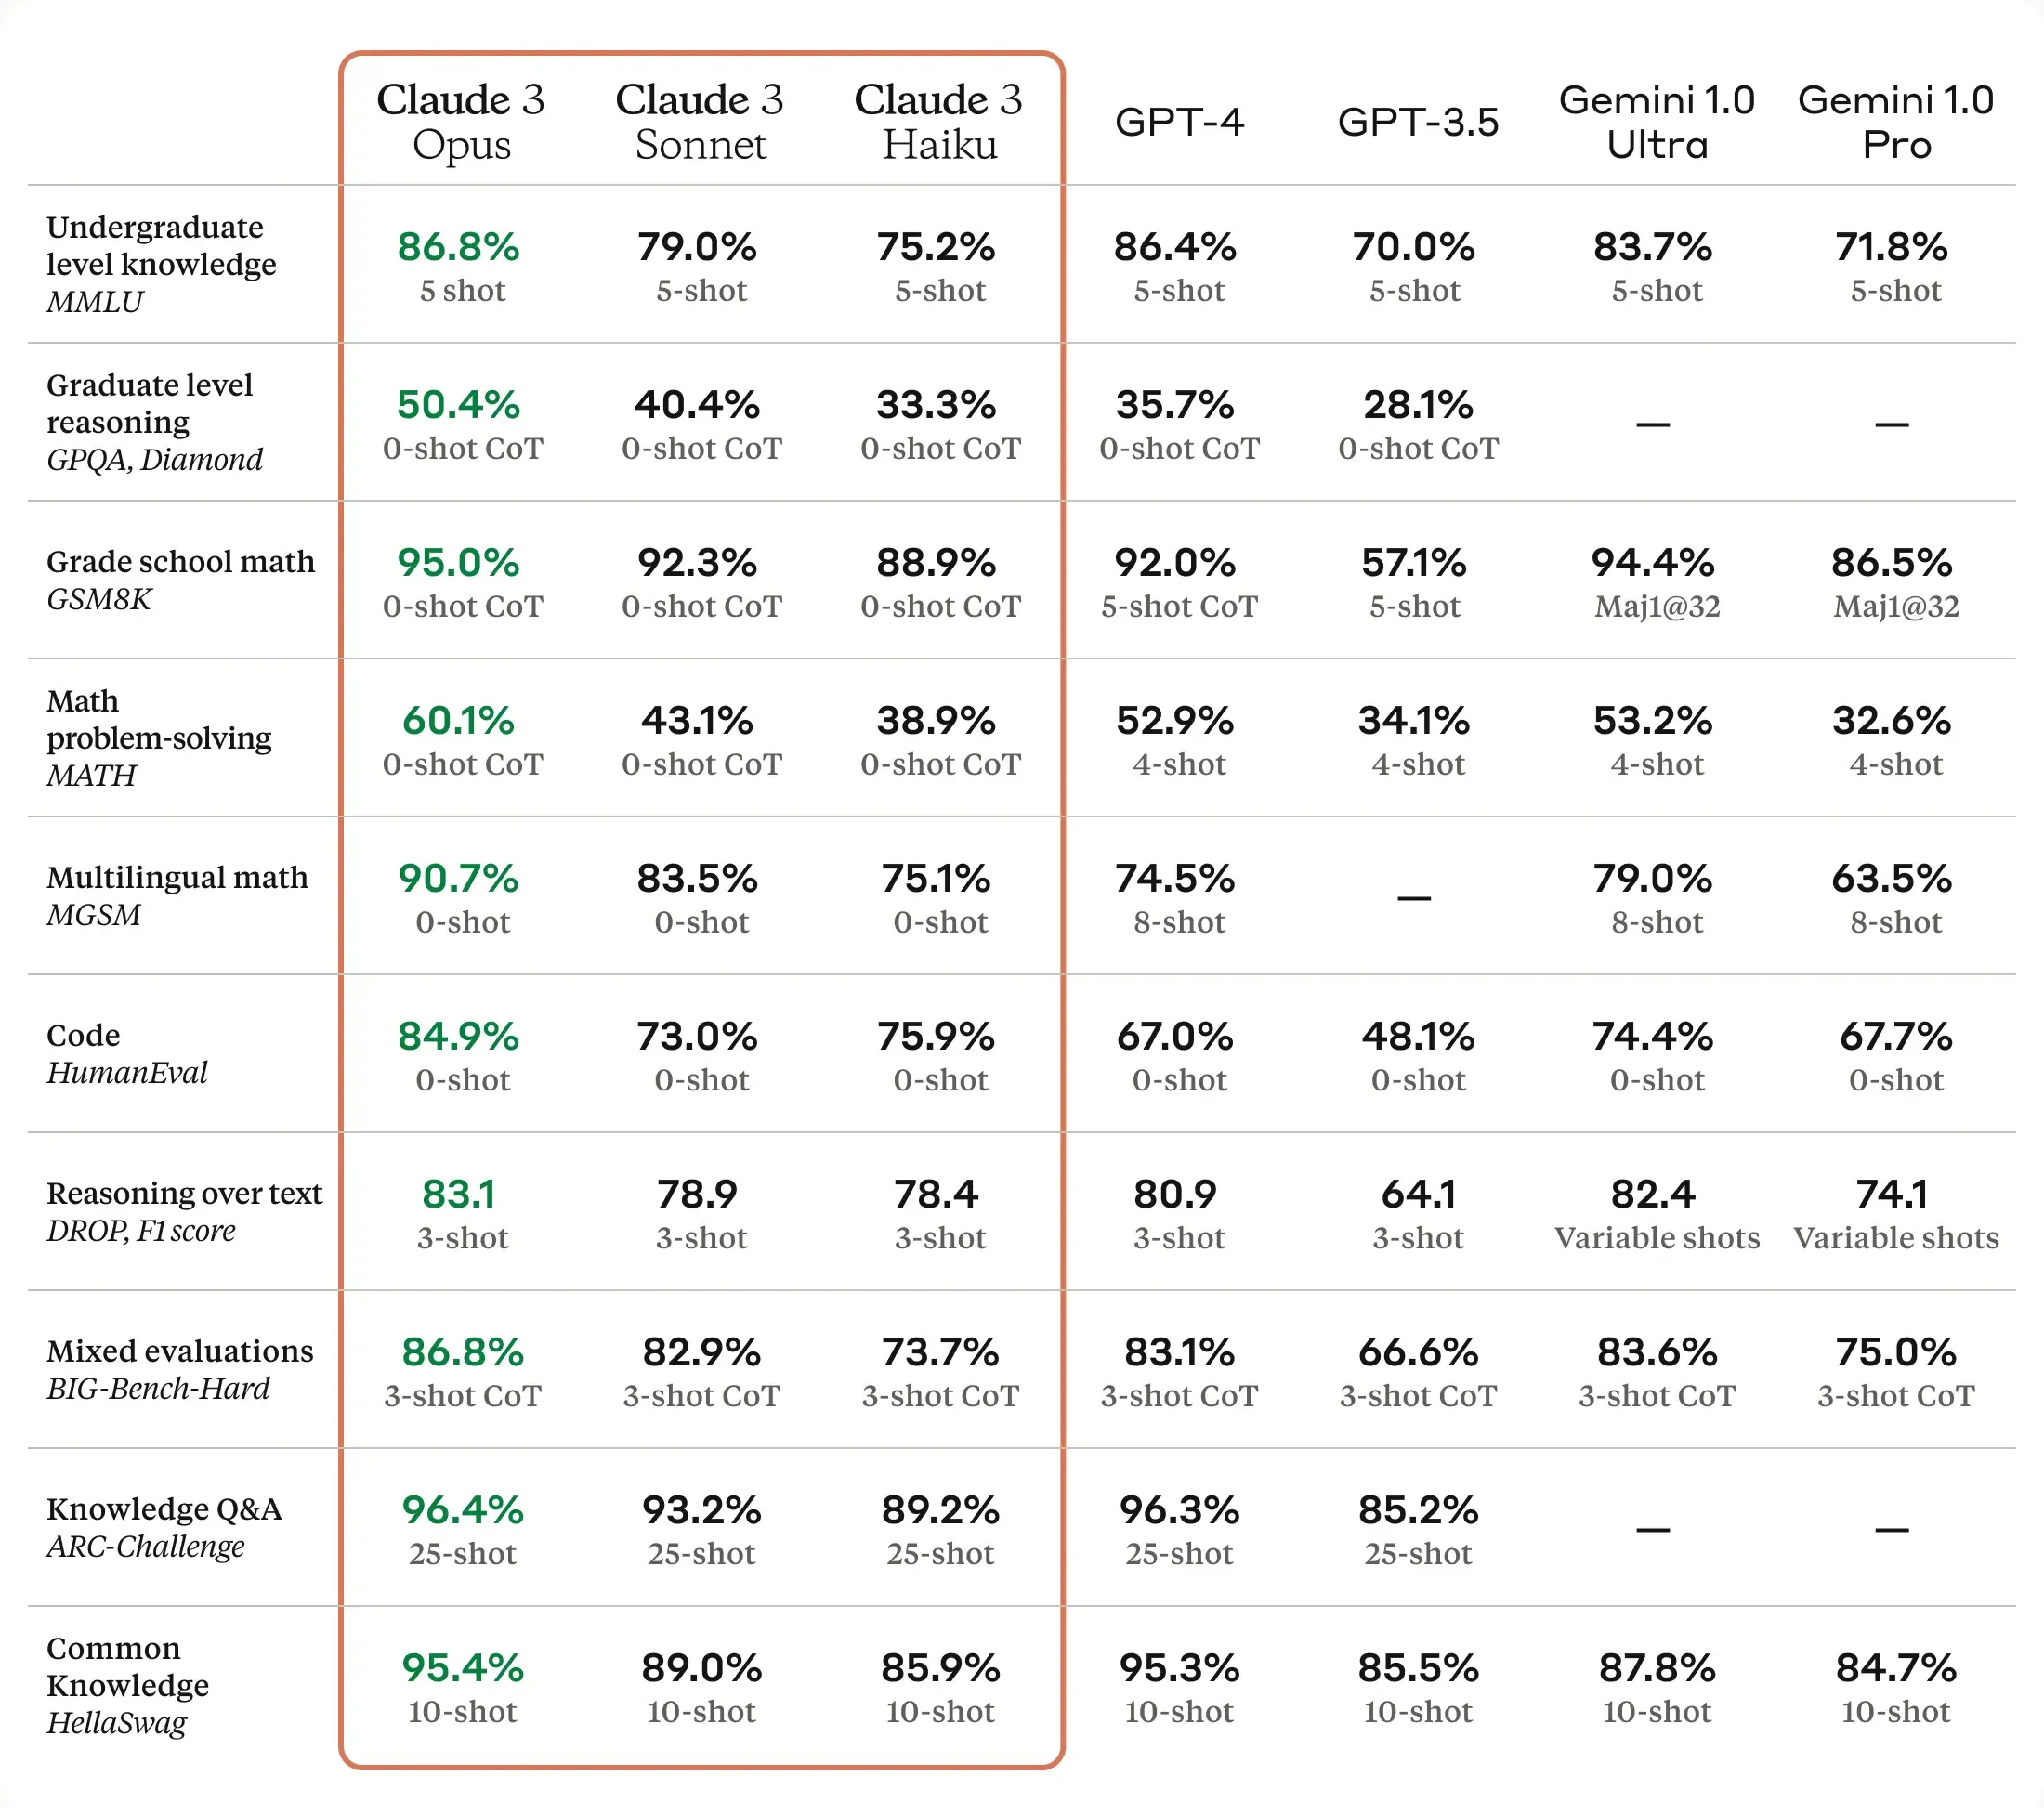
The blog is incredibly compelling, however it’s all functional testing— there is little performance testing considerations such as expected latency or throughput. The phrase “real-time” is used however specific latency is not measured. The rest of this blog will cover some techniques to get visibility into latency, throughput and various ways to validate how your code will perform against model behavior.
Model Training
If you run searches to learn about LLM, much of the content is related to getting access to GPUs so you can do your machine learning training. Thankfully however there has been so much effort and capital that has been put into machine learning training that most “AI applications” utilize existing models that have already been well trained. Your AI applications might be able to take advantage of an existing model and simply fine tune it on some aspects of your own proprietary data. For the purposes of this blog we will assume your AI systems have already been properly trained and you’re ready to install it in production.
Latency, Throughput and SRE Golden Signals
In order to understand how well your application can scale, you can focus on the SRE golden signals as established in the Google SRE Handbook:
- Latency is the response time of your application, usually expressed in milliseconds
- Throughput is how many transactions per second or minute your application can handle
- Errors is usually measured in a percent of
- Saturation is the ability of your application to use the available CPU and Memory
Before you put this LLM into production, you want to get a sense for how your application will perform under load. This starts by getting visibility into the specific endpoints and then driving load throughout the system.
Basic Demo App
For the purposes of this blog, I threw together a quick demo app that uses OpenAI chat completion and image generation models. These have been incorporated into a demo website to add a little character and fun to an otherwise bland admin console.
Chat Completion Data
This welcome message uses some prompt engineering with the OpenAI chat completion API to welcome new users. Because this call happens on the home page, it needs to have low latency performance to enable quick user feedback:
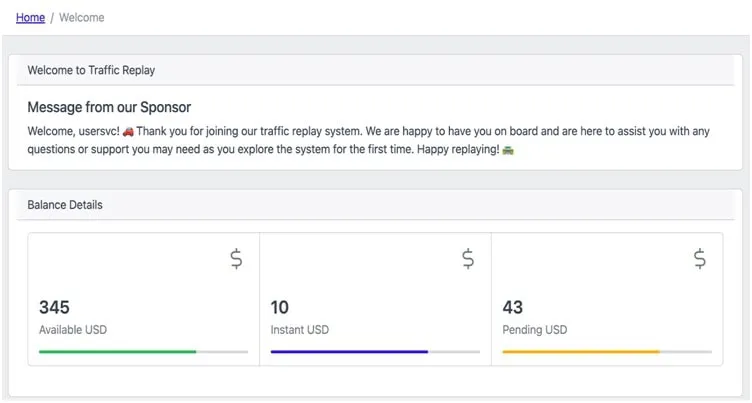
Image Generation
To spice things up a little bit, the app also lets users generate some example images for their profile. This is one of the really powerful capabilities of a large language model but you’ll quickly see these are much more expensive and can take a lot longer to respond. You can’t put this kind of call on the home page for sure.

Here is an example of an image generated by DALL-E 2 of a unicorn climbing a mountain and jumping onto a rainbow. You’re welcome.
Validating Application Signals
Now that we have our LLM selected and demo application, we want to start getting an idea of how it scales out with the SRE golden signals. To do this, I turned to a product called Speedscale which allows me to listen to Kubernetes traffic and modify/replay the traffic in dev environments. The first step is to install a Speedscale sidecar to capture API interactions running into and out of my user microservice. This lets us start confirming how well this application will scale once it hits a production environment.
Measuring LLM Latency
Now that we have our demo app, we want to start understanding the latency in making calls to OpenAI as part of an interactive web application. Using Speedscale Traffic Viewer, at a glance you can see the response time of the 2 critical inbound service calls:
- The Welcome endpoint is responding at 1.5 seconds
- The Image endpoint takes nearly 10 seconds to respond
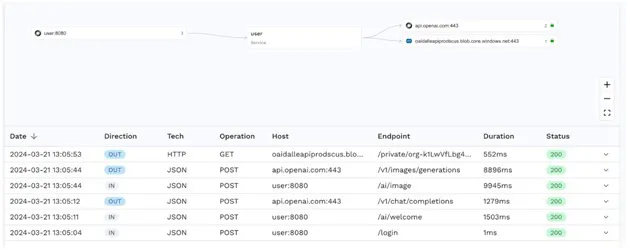
Always compare these response times to your application scenarios. While the image call is fairly slow, it’s not called on the home page so may not be as critical to the overall application performance. The welcome chat however takes over 1 second to respond, so you should ensure the webpage does not wait for this response before loading.
Comparing LLM Latency to Total Latency
By drilling down further into each of the calls, you can find that about 85 - 90% of the time is spent waiting on the LLM to respond. This is by using the standard out of the box model with no additional fine tuning. It’s fairly well known that fine tuning your model can improve the quality of the responses but will sacrifice latency and often cost a lot more as well. If you are doing a lot of fine tuning of your models, these validation steps are even more critical.
Validating Responses to Understand Error Rate
The next challenge you may run into is that you want to test your own code and the way it interacts with the external system. By generating a snapshot of traffic, you can replay and compare how the application responds compared with what is expected. It’s not a surprise to see that each time the LLM is called, it responds with slightly different data.
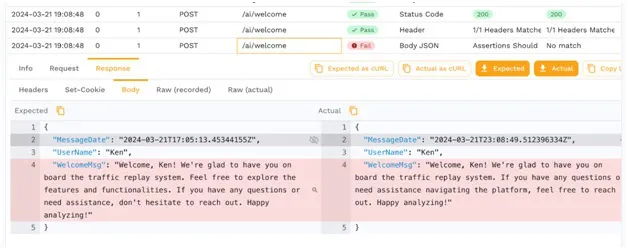
While having dynamic responses is incredibly powerful, it’s a useful reminder that the LLM is not designed to be deterministic. If your software development uses a continuous integration/continuous deployment pipeline, you want to come up with some way to make the responses consistent based on the inputs. This is one of Service Mocking’s best use cases.
Comparing Your Throughput to Rate Limits
After running just 5 virtual users through the application, I was surprised to see the failure rate spike from rate limits. While this load testing is helpful so you don’t inadvertently run up your bill, it also has a side effect that you can’t learn the performance of your own code.
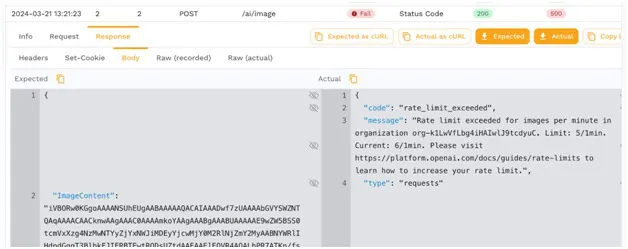
This is another good reason to implement a service mock so that you can do load testing without making your bill spike off the charts like traditional software testing would experience.
Comparing Rate Limits to Expected Load
You should be able to plan out which API calls are made on which pages and compare against the expected rate limits. You can confirm your account’s rate limits in the OpenAI docs.
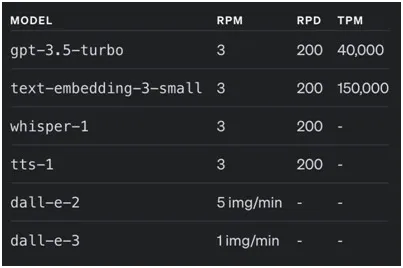
Fortunately OpenAI will let you pay more money to increase these limits. However, just running a handful of tests multiple times can quickly run up a bill into thousands of dollars. And remember, this is just non-prod. What you should do instead is create some service mocks and isolate your code from this LLM.
A step-by-step guide on how to leverage Traffic Replay to mock AI APIs
Mocking the LLM Backend
Because the Speedscale sidecar will automatically capture both the inbound and outbound traffic, the outbound data that can be turned into service mocks.
Building a Service Mock
Find the interesting traffic showing both the inbound and outbound calls you’re interested in and simply hit the Save button. Within a few seconds you will have generated a suite of tests and backend mocks without ever writing any scripts.
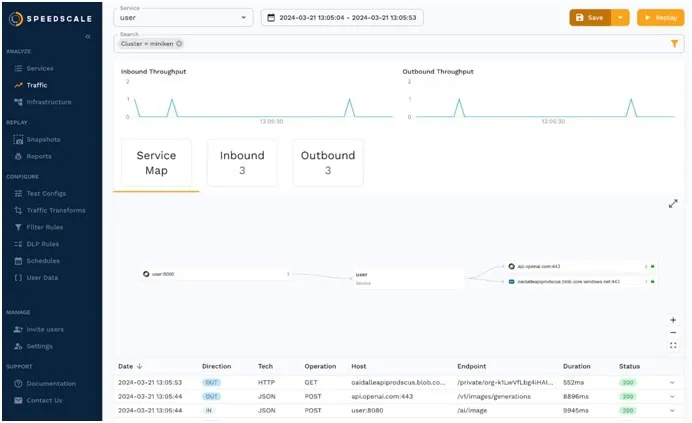
Replaying a Service Mock
Speedscale has built-in support for service mocking of backend downstream systems. When you are ready to replay the traffic you simply check the box for the traffic you would like to mock. There is no scripting or coding involved, the data and latency characteristics you recorded will be replayed automatically.
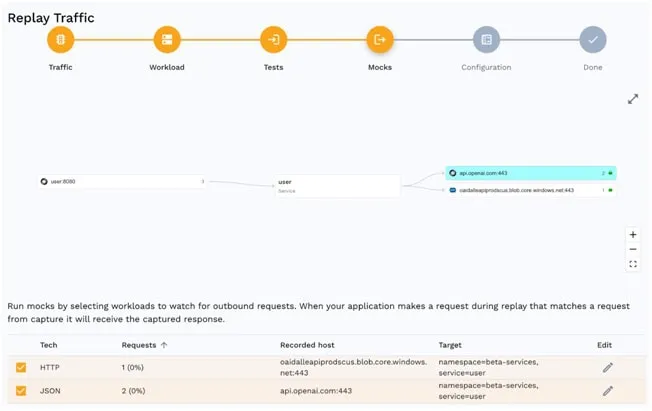
Using service mocks lets you decouple your application code from the downstream LLM and helps you understand the throughput that your application can handle. And as an added bonus, you can test the service mock as much as you want without hitting a rate limit and no per-transaction cost.
Confirming Service Mock Calls
You can see all the mocked out calls at a glance on the mock tab of the test report. This is a helpful way to confirm that you’ve isolated your code from external systems which may be adding too much variability to your scenario.
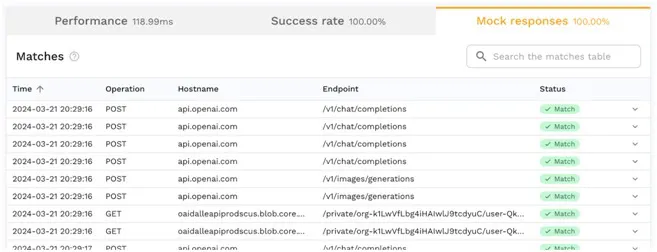
You usually want to have 100% match rate on the mock responses, but in case something is not matching as expected, drill into the specific call to see the reason why. There is a rich transform system that is a good way to customize how traffic is observed and ensure the correct response is returned by the mock.
Top 8 API Mocking Tools and Methodologies
Running Load
Now that you have your environment running with service mocks, you want to crank up the load to get an understanding of just how much traffic your system can handle.
Test Config
Once the traffic is ready, you can customize how many copies you’ll run and how quickly by customizing your Test Config. It’s easy to ramp up the users or set a target throughput goal.
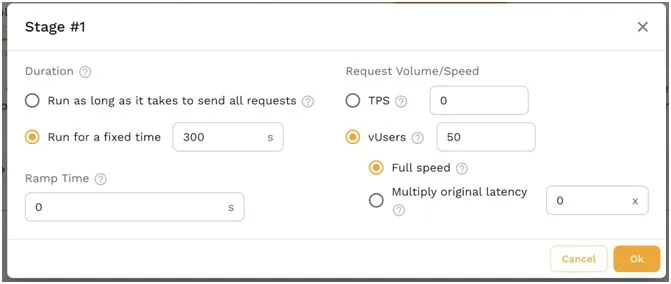
This is where you should be experimenting with a wide variety of settings. Set it to the number of users you expect to see to make sure you know the number of replicas you should run. Then crank up the load another 2-3x to see if the system can handle the additional stress.
Test Execution
Running the scenario is as easy as combining your workload, your snapshot of traffic and the specific test config. The more experiments you run, the more likely you are to get a deep understanding of your latency profile.
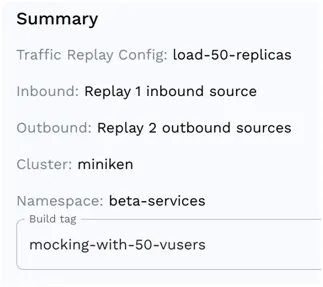
The scenarios should definitely build upon each other. Start with a small run and your basic settings to ensure that the error rate is within bounds. Before you know it you’ll start to see the break points of the application.
Change Application Settings
You’re not only limited to changing your load test configuration, you also should experiment with different memory, cpu, replica or node configurations to try to squeeze out extra performance. Make sure you track each change over time so you can find the ideal configuration for your production environment.
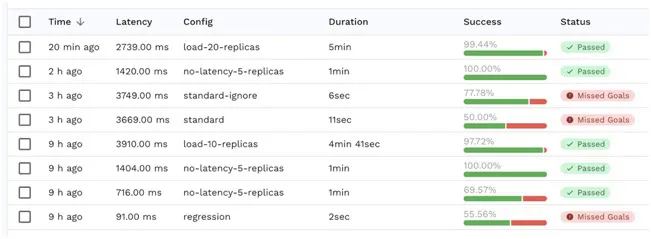
In my case, one simple change was to expand the number of replicas which cut way down on the error rate. The system could handle significantly more users and the error rate was within my goal range.
Sprinkle in some Chaos
Once you have a good understanding of the latency and throughput characteristics you may want to inject some chaos in the responses to see how the application will perform. By making the LLM return errors or stop responding altogether you can sometimes find aspects of the code which may fall down under failure conditions.
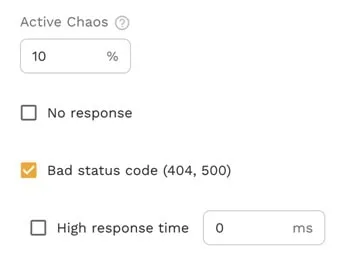
While chaos engineering edge cases is pretty fun, it’s important to ensure you check the results without any chaotic responses first to make sure the application scales under ideal conditions.
Reporting
Once you’re running a variety of scenarios through your application, you’ll start to get a good understanding of how things are scaling out. What kind of throughput can your application handle? How do the various endpoints scale out under additional load?
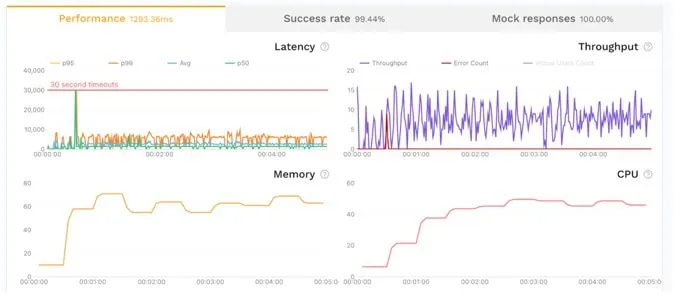
At a glance this view gives a good indication of the golden signals:
- Latency overall was 1.3s, however it spiked up to 30s during the middle of the run
- Throughput was unable to scale out consistently and even dropped to 0 at one point
- Errors were less than 1% which is really good, just a few of the calls timed out
- Saturation of Memory and CPU was good, the app did not become constrained
Percentiles
You can dig in even further by looking at the response time percentiles by endpoint to see what the typical user experience was like. For example if you look at the image endpoint, P95 of 8 seconds means that 95% of the users had a response time of 8 seconds or less which really isn’t that great. Even though the average was 6.5 seconds, there were plenty of users that experienced timeouts, so there are still some kinks that need to be worked out of this application related to images.

For even deeper visibility into the response time characteristics you can incorporate an APM (Application Performance Management) solution to understand how to improve the code. However in our case we already know most of the time is spent waiting for the LLM to respond with its clever answer.
Summary
While large language models can bring an enormous boost to your application functionality, you need to ensure that your service doesn’t fall down under the additional load. It’s important to run latency performance profiling in addition to looking at the model capabilities. It’s also important to consider avoiding breaking the bank on LLMs in your continuous integration/continuous deployment pipeline. While it can be really interesting to run a model that is incredibly smart with answers, you may want to consider the tradeoff of using a simpler model that can respond to your users more quickly so they stay on your app without closing their browser window. If you ever want to dig in further into the world of LLM and how to understand performance, feel free to join the Speedscale Community and reach out, we’d love to hear from you.