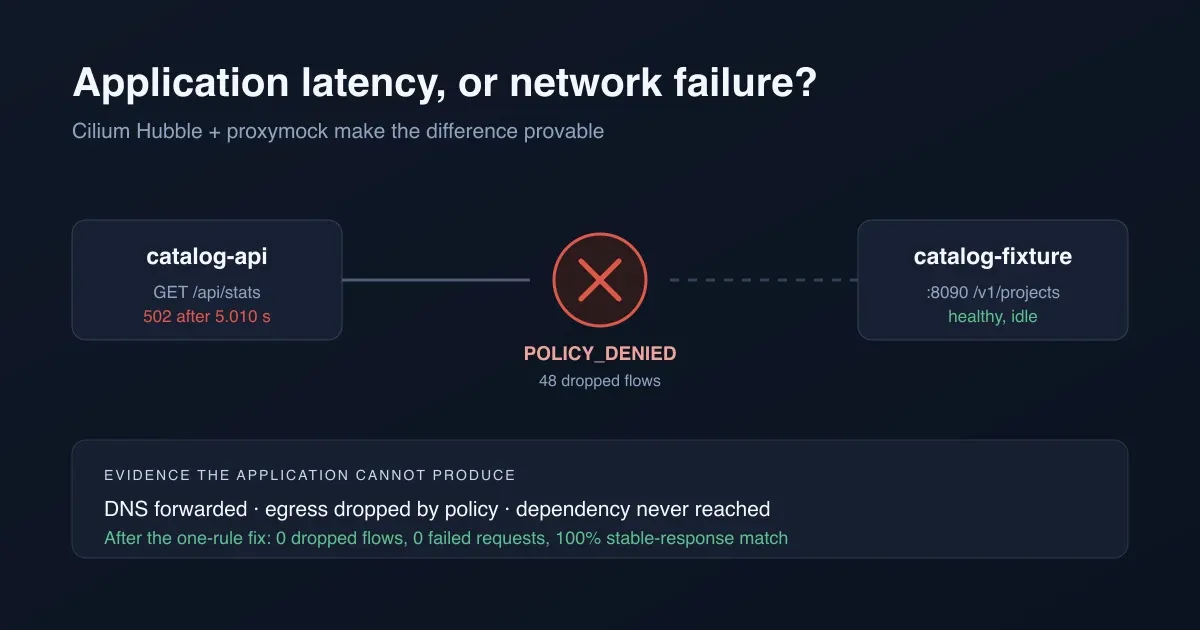
Separate Application Latency From Network Failure With Hubble
The request timed out after five seconds. The application said
context deadline exceeded. The dependency was healthy, its dashboards were
green, and its own latency histogram showed nothing above 30 milliseconds.
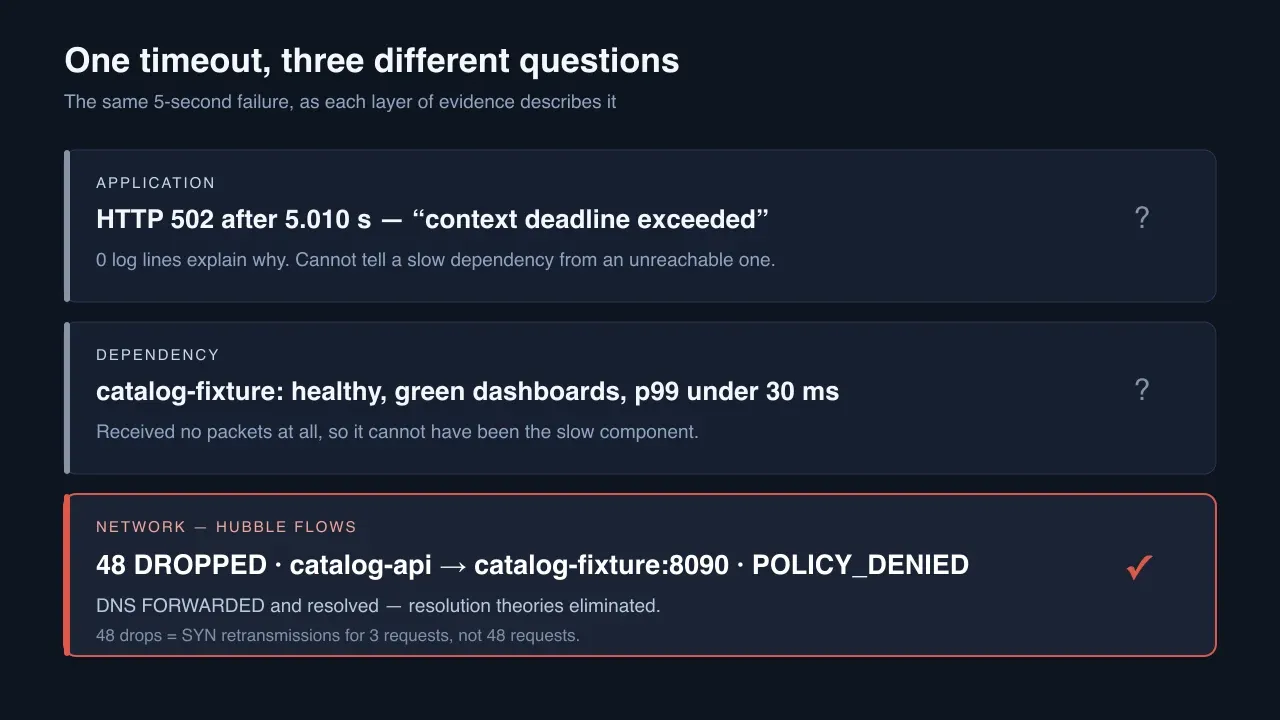
That combination is the most expensive kind of on-call evidence, because every part of it is true and none of it is an explanation. A client-side timeout only proves that a response did not arrive in time. It cannot tell you whether the dependency was slow, whether it never received the request, or whether the reply came back and was discarded on the way. Those are three different outages with three different fixes, and the application cannot distinguish them — by the time the error is raised, the evidence has already been lost in the kernel.
This guide builds a disposable Kubernetes lab where that ambiguity is resolved from evidence rather than from intuition. It takes two tools, and they do genuinely different jobs.
Cilium Hubble is the observer. It supplies a per-packet verdict and a drop reason over the failure interval — the evidence the application structurally cannot produce, because it lives in the kernel, below the socket API where the application’s knowledge ends.
proxymock is what turns that observation into an experiment. An observer alone cannot settle a hypothesis; something has to hold the input constant while exactly one variable moves. proxymock does that three times over:
- The control. It records the healthy request and its exact response before anything breaks, so the investigation compares against a captured contract rather than against a memory of one. Baselines are almost never available during an incident, because nobody thought to take one while things were fine.
- The trigger. It reproduces the failing request on demand instead of waiting for the outage to recur, and writes the precise interval it occupied. That is what makes the failure window yours: you know which seconds to ask Hubble about. This is where flow investigations usually stall — hunting for a window that has already aged out of the ring buffer.
- The verdict. After the fix, it replays the recorded request against the live workload and compares every stable response field. Restored packets are not the same as restored behavior, and only the replay can tell those apart.
Hubble says what happened to the packets. proxymock says whether the contract the caller depends on still holds — before, during, and after the change. Neither claim is sufficient alone, and together they separate an application conclusion from a dependency conclusion from a network conclusion.
The application image is byte-identical in the healthy and failing states. Only
a CiliumNetworkPolicy changes. So any conclusion that blames application code
is wrong by construction — which makes the lab a fair test of whether an
investigation, human or AI-assisted, actually follows evidence.
What you will build
The companion Hubble lab reuses the repository’s Go quickstart application and reference fixture.
GET /api/stats on catalog-api makes one in-cluster call to
http://catalog-fixture.netpath-demo.svc.cluster.local:8090/v1/projects and
aggregates the result by maturity. That call is resolved by cluster DNS and
dialed pod-to-pod, so Cilium and Hubble observe the real data path. This matters
enough to state plainly: the lab deliberately does not route the dependency
through a host proxy, because a proxied dependency would not exercise the
in-cluster network path the guide is about.
The failure is introduced the way most of these failures actually happen. A
platform change tightens egress for catalog-api. Its author remembers that the
pod needs cluster DNS and writes that rule:
egress:
  - toEndpoints:
      - matchLabels:
          io.kubernetes.pod.namespace: kube-system
          k8s-app: kube-dns
    toPorts:
      - ports:
          - port: "53"
            protocol: UDP
          - port: "53"
            protocol: TCP
        rules:
          dns:
            - matchPattern: "*"
That policy is not wrong about DNS. It is incomplete about everything else. In Cilium, the first policy that selects a pod for egress switches that pod from default-allow to default-deny for egress. So an “add DNS” change also silently blackholes the dependency this application needs. Packets are dropped rather than rejected, so the caller gets a hang instead of a connection error.
The lab pins Kubernetes 1.34.0, Cilium 1.19.6, the Hubble CLI v1.19.4, and Go 1.23.12 on Alpine 3.22.
Prerequisites
- Docker Desktop with at least 8 GiB assigned
- minikube 1.37 or newer with the Docker driver
- Kubernetes CLI 1.34 or newer and Helm 4
- Go 1.23 or newer,
curl, andjq - proxymock 2.5.842 or newer, initialized and on
PATH - An MCP client with STDIO support; the commands below use Codex
Install proxymock and clone the lab:
brew install speedscale/tap/proxymock
proxymock init
proxymock version

git clone https://github.com/speedscale/mock-lab.git
cd mock-lab/labs/hubble
Every command below runs from the mock-lab/labs/hubble directory unless a step says
otherwise. The hubble CLI is installed into the lab’s own bin/ directory by
make hubble-cli; nothing is written outside the lab.
The proxymock CLI quickstart covers Linux, Windows, and other installation paths. Cilium requires a Linux kernel with eBPF support. On macOS this lab runs it inside minikube’s Linux node; it does not load eBPF programs into the macOS kernel.
1. Start the network-path lab
make test
make up
make up creates only the hubble-lab minikube profile, starts it with
--cni=false, installs the pinned Cilium chart with Hubble and Hubble Relay
enabled, builds the application and fixture, and deploys them into the
netpath-demo namespace. It also deletes any leftover policy, so every run
begins from the healthy state.
The lab installs a pinned chart rather than using minikube start --cni=cilium,
which would install whatever Cilium version minikube happens to ship.
In another terminal, from mock-lab/labs/hubble, keep the observability ports
forwarded:
make forwardHubble Relay is on 127.0.0.1:4245 for the CLI, and the Hubble UI service map
is at http://127.0.0.1:12000. Confirm the observer is healthy before trusting
any absence of evidence:
./bin/hubble status --server 127.0.0.1:4245Healthcheck (via 127.0.0.1:4245): Ok
Current/Max Flows: 286/16,383 (1.75%)
Flows/s: 5.40
Connected Nodes: 1/1That last line matters more than it looks. Hubble keeps flows in a per-node ring buffer. “No flows” from a disconnected node and “no flows” because nothing was sent are the same empty result and completely different conclusions.
2. Record the healthy boundary
make captureThe target starts proxymock around the application port-forwards, sends one
GET /api/stats through the capture port and one GET /v1/projects through the
forward proxy, and writes two RRPairs plus a machine-readable interval:
proxymock/recording/window.jsonThat file carries capture_start and capture_end at nanosecond precision,
plus query_start and query_end floored and ceiled to whole seconds. The
derivation keeps the query interval conservative and hands the agent clean
RFC3339 values it can pass through untouched. The reader never records, copies,
rounds, substitutes, or confirms a timestamp.
The recorded response is the contract the rest of the guide protects:
cat proxymock/recording/catalog-response.json{
"by_maturity": { "Graduated": 16, "Incubating": 5, "Sandbox": 3 },
"total": 24
}Export the healthy flows over that same interval:
make flows WINDOW=proxymock/recording/window.jsonWrote proxymock/recording/flows.json: 65 flows in
2026-08-13T15:05:22Z..2026-08-13T15:05:28Z, 0 droppedSixty-five flows, zero dropped, and a catalog-api → catalog-fixture:8090 edge
with a FORWARDED verdict. This is the baseline the failure will be compared
against — captured before anything is broken, which is the only time it is cheap
to collect.
Unlike the sibling guides in this series, there is no vendor MCP server to call
here. Hubble does not ship one. So the lab writes newline-delimited jsonpb to
flows.json next to the saved window, and the agent reads a file instead of
calling a tool. The evidence discipline is identical; only the transport
changes.
3. Break the network, not the code
make breakciliumnetworkpolicy.cilium.io/catalog-api-egress created
Applied the incomplete egress policy. The application image is unchanged.No deployment is rolled, no image is rebuilt, no environment variable moves. If you were watching a deployment feed, nothing shipped.
4. Ask the application first, and watch it fail to answer
make probeattempt 1 http_status=502 duration_s=5.010835
{"error":"Get \"http://catalog-fixture.netpath-demo.svc.cluster.local:8090/v1/projects\": context deadline exceeded (Client.Timeout exceeded while awaiting headers)"}
attempt 2 http_status=502 duration_s=5.010503
attempt 3 http_status=502 duration_s=5.011488Three failures, all at the client timeout to within a millisecond. The container log adds nothing:
cat proxymock/failure/catalog-api.log2026/08/13 15:04:59 Starting HTTP server on :8080 (downstream=http://catalog-fixture.netpath-demo.svc.cluster.local:8090)That is the entire log: one startup banner, written before the failure, and nothing at all about three requests that just died. Zero log lines explain the failure, and that is not a gap in this lab’s instrumentation — it is the structural limit of application-side evidence. The process asked the kernel to connect, the kernel never reported success or failure, and after five seconds the client gave up. Everything the application knows is in that one sentence.
Note how precisely the timings cluster at the timeout. A dependency that is genuinely slow produces a distribution of durations. A blackhole produces the timeout value, repeatedly, because nothing else is influencing the outcome. That is a hint, not proof, and it is worth exactly as much as a hint — the next step is where the question is actually settled.
5. Ask Hubble over the exact interval
make flows WINDOW=proxymock/failure/window.jsonWrote proxymock/failure/flows.json: 290 flows in
2026-08-13T15:06:01Z..2026-08-13T15:06:22Z, 48 droppedGroup the dropped flows by source, destination, port, and reason:
jq -rs '
def nm($o;$p): (($o.labels // []) | map(select(startswith($p))) | first) // "-";
[ .[] | .flow | select(.verdict=="DROPPED") | {
  src: nm(.source;"k8s:app.kubernetes.io/name"),
  dst: (.destination.pod_name // "-"),
  port: ((.l4.TCP.destination_port // .l4.UDP.destination_port)|tostring),
  reason: (.drop_reason_desc // "")
} ] | group_by([.src,.dst,.port,.reason])
  | map({src:.[0].src, dst:.[0].dst, port:.[0].port, reason:.[0].reason, n:length})
' proxymock/failure/flows.json
[
{
"src": "k8s:app.kubernetes.io/name=catalog-api",
"dst": "catalog-fixture-57876959f-wlpqg",
"port": "8090",
"reason": "POLICY_DENIED",
"n": 48
}
]This is the evidence the application could not produce: not “no response arrived” but the packets were dropped, on the egress path, by policy, before they reached the dependency.
Now the discriminator that keeps the conclusion narrow. Cilium parses DNS at L7, so the same flow file already answers “was it DNS?” — group the records that carry a DNS query by name and verdict:
jq -rs '
[ .[] | .flow | select(.l7.dns.query) | {
  verdict: .verdict,
  query: .l7.dns.query,
  rcode: (.l7.dns.rcode // 0)
} ] | group_by([.verdict,.query])
  | map({verdict:.[0].verdict, query:.[0].query, n:length})
' proxymock/failure/flows.json
[
{ "verdict": "FORWARDED", "query": "catalog-fixture.netpath-demo.svc.cluster.local.", "n": 8 },
{ "verdict": "FORWARDED", "query": "catalog-fixture.netpath-demo.svc.cluster.local.cluster.local.", "n": 8 },
{ "verdict": "FORWARDED", "query": "catalog-fixture.netpath-demo.svc.cluster.local.netpath-demo.svc.cluster.local.", "n": 8 },
{ "verdict": "FORWARDED", "query": "catalog-fixture.netpath-demo.svc.cluster.local.svc.cluster.local.", "n": 8 }
]Four names rather than one is the resolver walking the pod’s search domains, and every one of them was forwarded. DNS resolved, and was forwarded. That single fact eliminates an entire family of plausible theories — CoreDNS trouble, a bad search-domain path, a stale service IP — that an investigation would otherwise spend an hour disproving. The name worked. The connection to what the name pointed at did not.
One counting trap deserves its own sentence, because it is the easiest way to misreport this evidence: 48 dropped flows are not 48 failed requests. Three requests were affected. A dropped SYN is invisible to the sender, so the kernel retransmits on a backoff until the client timeout fires, and every retransmission is its own dropped flow. Affected requests and dropped packets are different numbers and should never be reported as one.
6. Make the agent separate the three conclusions
Add the proxymock MCP server and give the agent this prompt. The demand is not “find the bug” — it is that each conclusion arrive with the evidence that supports it, and that the eliminated theories be named.
codex mcp add proxymock -- proxymock mcp run --work-dir "$PWD"Work in the hubble directory of the mock-lab clone. Do not edit application code.
Parse proxymock/failure/window.json. Use query_start and query_end unchanged.
1. Report the application evidence from proxymock/failure/observations.txt and
proxymock/failure/catalog-api.log: status, duration, error text, and how many
log lines explain the cause. State what this evidence cannot distinguish.
2. Call proxymock MCP search_local_traffic with:
{"in-directory":["proxymock/recording"],"direction":"in","method":"GET","query":"/api/stats","limit":20,"offset":0}
Report the recorded stable response. This is the contract a fix must preserve.
3. Read proxymock/failure/flows.json. Group .flow by verdict. For every DROPPED
flow report source workload, destination workload, destination port, and
drop_reason_desc. Report affected requests and dropped packets as separate
numbers.
4. Report the L7 DNS flows for the same interval and their verdicts.
5. State three separate conclusions - application, dependency, network - each
with its supporting evidence. Say which conclusion the drop reason supports
and which theories the DNS evidence eliminates.
Do not propose an application code change until step 5 is complete.Example AI output:
The application evidence is three
GET /api/statsrequests returning 502 after 5.0108, 5.0105, and 5.0115 seconds withcontext deadline exceeded. The container log contains one startup line and zero lines about the failure. This evidence establishes that no response arrived within the client timeout. It cannot distinguish a slow dependency from an unreachable one, because both present as an expired deadline.The recording contains one inbound
GET /api/statsRRPair returning 200 withtotal=24,Graduated=16,Incubating=5,Sandbox=3. That is the contract to preserve.The failure interval contains 290 flows: 226 FORWARDED, 16 REDIRECTED, and 48 DROPPED. Every dropped flow is
catalog-api → catalog-fixture:8090withdrop_reason_desc: POLICY_DENIED. Three requests were affected; the 48 drops are SYN retransmissions, not 48 requests.DNS for
catalog-fixture.netpath-demo.svc.cluster.localwas FORWARDED and resolved successfully.
- Application conclusion: no defect indicated. The handler issued the dependency call and honored its timeout. The image is unchanged from the healthy state.
- Dependency conclusion:
catalog-fixtureis not implicated. It received no packets fromcatalog-apiin this interval, so it cannot have been slow.- Network conclusion: egress from
catalog-apitocatalog-fixture:8090is denied by policy. The drop reason supports this conclusion specifically; the successful DNS flows eliminate resolution, CoreDNS, and search-domain theories.Smallest correct change: add an egress rule allowing
catalog-apito reachcatalog-fixtureon 8090. No application change is warranted.
The value here is the eliminations. An investigation that only produces “it was the network policy” is right but unpersuasive; one that also states what the evidence rules out is the one that survives review.
7. Fix the network and prove behavior is unchanged
make fix
make functional-replay
make load-replay
make verify
The fix adds one rule. The application image, environment, and handler code are untouched:
  - toEndpoints:
      - matchLabels:
          app.kubernetes.io/name: catalog-fixture
    toPorts:
      - ports:
          - port: "8090"
            protocol: TCP
Reachability is restored, but reachability is not correctness. The replay is what closes that gap. It replays the recorded request against the live workload — there is no mock in this step, deliberately, because the dependency call has to traverse the real Cilium data path for the result to be evidence about the network rather than about a stub.
Functional mode repeats the inbound request three times and fails unless
requests.failed=0 and requests.result-match-pct=100. That is a stable
response comparison, not a status-code or schema check. Load mode is allowed to
run only after that gate passes.
| Evidence | Healthy baseline | Broken policy | After the one-rule fix |
|---|---|---|---|
| Requests | 1 | 3 | 3 functional / 50 load |
| Failed requests | 0 | 3 | 0 |
| HTTP status | 200 | 502 | 200 |
| Stable response match | Recorded contract | No response | 100% |
| Inbound latency | ~31 ms | 5.010 s (client timeout) | 34 ms functional / 31 ms load avg |
| Flows in interval | 65 | 290 | 132 |
| Dropped flows | 0 | 48 | 0 |
| Drop reason | None | POLICY_DENIED | None |
| DNS verdict | FORWARDED | FORWARDED | FORWARDED |
catalog-api → :8090 | FORWARDED | DROPPED | FORWARDED |
The load replay ran 50 requests with 0 failed at 62.87 requests/second, p50
30 ms and p99 38 ms. The machine-readable reference behind this table is
hubble/evidence/reference.json
in the lab repository.
Two rows carry most of the weight. Dropped flows going 48 → 0 shows the
network condition is gone. Stable response match: 100% shows the caller-visible
contract came back unchanged rather than merely coming back. A network fix can
restore reachability and still change behavior — a policy that permits a
different port, or a routing change that lands on a different backend, will show
green flows and a different response body. Only the replay catches that.
When the network is not the answer
The lab is rigged so the network is the answer, which makes it a poor guide to the case where it isn’t. The honest reading of this evidence path runs in both directions.
If Hubble shows FORWARDED flows to the dependency, a healthy reply, and a
round-trip that matches the application’s measured latency, then the network has
exonerated itself and the remaining time belongs inside the process — a slow
handler, lock contention, garbage collection, a connection pool at its limit. At
that point the right next move is
latency attribution with traces,
not more flow queries.
The failure mode worth naming is treating flow data as a diagnosis rather than a discriminator. Hubble tells you what happened to the packets. It does not tell you what the code intended, whether the response was correct, or whether the retry storm you are looking at is a cause or a symptom. Keep it in the role it is decisive in.
Measurement limitations
- Cilium requires a supported Linux kernel with eBPF and BTF. macOS and Windows cannot run it directly. Managed clusters, lockdown modes, and restrictive security policies may reject the required probes.
- Hubble stores flows in a bounded per-node ring buffer. This lab raises
eventBufferCapacityso a window from minutes ago is still queryable; on a busy production node, flows age out far faster and a saved interval may be gone before you query it. Absence of flows is not evidence of absence of traffic — checkhubble statusand node connectivity first. - Drop reasons are Cilium’s own classification.
POLICY_DENIEDis decisive; other reasons are more general and may need correlation with kernel or CNI logs. - This lab uses unencrypted HTTP/1.1 between two Go binaries in one namespace on a single node. Multi-node paths, encryption, service meshes, egress gateways, and NAT each add hops that this topology does not exercise.
- Local replay latency and throughput are directional and machine-specific, and include the port-forward and generator harness. They are not a benchmark.
- Load mode deliberately skips response scoring. Only the functional replay is the correctness gate.
- The 5-second
DOWNSTREAM_TIMEOUTis what makes the failure fast and deterministic. Without a bounded client timeout, the same blackhole produces a multi-minute hang — which is the more common and considerably worse production experience.
Clean up
Stop make forward with Ctrl-C. Then delete only this lab’s isolated minikube
profile:
make down