Building, running and scaling SaaS demo systems that run around the clock is a big engineering challenge. Through the power of traffic replay, we scaled our demos in a huge way. A few weeks ago we launched a new demo sandbox. This is actually a second generation version of our existing demo system that I built a few months ago (codename: decoy). There were a few key requirements in the original demo system:
- Realistic - instead of “hello world”, we selected third-party APIs like Stripe, Plaid, Zapier, Slack, AWS services, GCP services, etc.
- Variability - the data includes GET, POST, DELETE, etc. and not just basic calls
- Easy - it can all be deployed with a single kubernetes instruction
- Continuous - it needs to be running 24/7 because our demos default to showing 15 minutes of traffic
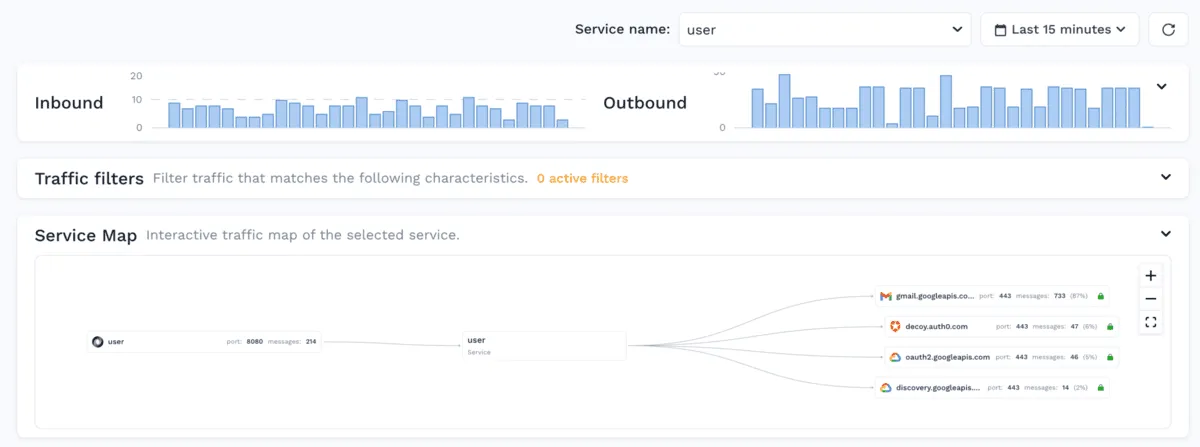
When it all comes together it looks really nice, and there is always data flowing in:  Because the traffic viewer page shows the most recent data by default, you need to constantly be pumping new data in there. Any type of real-time SaaS system is going to have a similar requirement. So this needs to be planned.
Scaling the SaaS Demo
If you’re a careful reader you may have noticed the last 2 items from my list above were Easy and Continuous. In my experience once you have the nice looking demo app built, it’s probably not very easy to run and might not run around the clock. Here is where we start to leverage a couple of our super powers:
- Kubernetes can actually make this easy by boiling all the complexity down to a few yaml files
- Responders will make it even easier by ensuring that no third party calls leave the cluster
- Generators make realistic calls to the app, not just hitting GET / but real-world traffic patterns
Kubernetes is Easy
There is a popular myth out there that Kubernetes is really hard because it involves a lot of new technologies. While it’s true that the overall architecture is complex, it’s also a huge advantage that we can tie together compute, network, configuration and storage into a single system. Each decoy microservice has a small number of parts:
- ConfigMap - for environment variables
- Deployment - a wrapper around the docker image itself
- Service - to expose the microservice on the network inside the cluster
Then just tie it together with a simple kustomization file like this:
apiVersion: kustomize.config.k8s.io/v1beta1 kind: Kustomization resources:
- svc.yaml
- cm.yaml
- deploy.yaml
Responders Reduce Dependencies
You may have noticed in the screenshot that our user microservice is making calls to third parties like Auth0, GCP, and GMail third-party APIs. In addition to relying upon these services, your demo now takes on some additional complexity:
- API Keys - need to track these secrets alongside your configuration
- Environments - some third parties use different endpoints for non-prod
- Data Set - you’ll need to ensure that the data is populated in these systems that matches your clients
Thankfully with responders you can handle all of these complexities. After capturing some sample traffic from a fully-integrated environment, you will see the exact calls being made to these third parties. Then just generate a snapshot and you will have all that data available with a reference UUID. Since we’re using Kubernetes here, we can just add a patch file with the following:
apiVersion: apps/v1 kind: Deployment metadata: name: user annotations: test.speedscale.com/scenarioid: {{SCENARIO_ID}} test.speedscale.com/testconfigid: standard test.speedscale.com/cleanup: “false” test.speedscale.com/deployResponder: “true”
There is real magic happening with these couple of annotations. Speedscale will deploy a small container inside the cluster that has all of the data needed for the demo. No need to populate data in a bunch of external systems. It can be configured to allow any API Key, so no need to keep track of tons of keys in your configuration management system (remember, this is just a demo). And then it will wire up the network to ensure outbound calls to the systems are routed directly to the responder. No code changes required.
Generate Real Calls
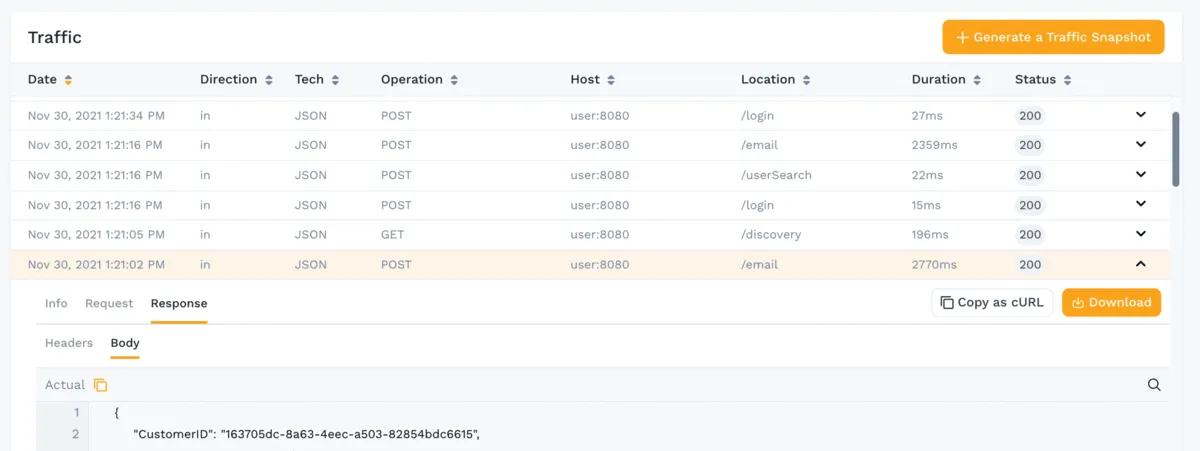
Now that our app is running and the third-party APIs are taken care of, we need to get some realistic inbound traffic. Well, in addition to traffic capture for all the outbound calls leaving an app, it’s just as easy to capture inbound as well. This is not just an access log, it includes the full fidelity of every single call:  Now that we know the calls that we want to make, we again can make a simple Kubernetes CronJob manifest, and schedule generator jobs to run on a schedule that we control. The most complex part of the whole thing is remembering the crontab syntax:
# ┌───────────── minute (0 - 59)
# │ ┌───────────── hour (0 - 23)
# │ │ ┌───────────── day of the month (1 - 31)
# │ │ │ ┌───────────── month (1 - 12)
# │ │ │ │ ┌───────────── day of the week (0 - 6) (Sunday to Saturday;
# │ │ │ │ │                                   7 is also Sunday on some systems)
# │ │ │ │ │
# │ │ │ │ │
# * * * * *
Ship It
This is a short blog because it’s actually just that easy. Through the power of Kubernetes we are able to deliver demos for production, play sandbox, staging, dev and custom demos with ease. And we keep the traffic constantly flowing with Speedscale responders and generators. Interested in seeing if this would work for your SaaS demo app? Sign up for a Free Trial today.