Every service has a branch that production traffic reaches and your test suite
does not. It is rarely exotic. Usually a dependency answers 200 OK with a
field nobody wrote a fixture for, some defensive code from three years ago
notices, and the service quietly does something expensive: it retries, it
falls back, it floods the log with warnings, and it returns exactly the right
answer anyway.
That last part is why the branch survives. Status codes are green. Response assertions pass. A response diff between releases shows nothing. The only evidence that anything unusual happened is a burst of log lines nobody is counting, and a tail latency number that looks like a slow request rather than a different code path.
This guide builds a lab where that branch is reproducible on demand:
- structured logs in Loki name the state transition, count it, and price it,
- proxymock holds the exact dependency payload that triggers it, so the trigger is recorded traffic rather than a value someone invented, and
- the same replay proves the fix changed the path without changing the answer.
What you will build
The companion Loki lab
contains a small checkout API that answers GET /api/quote by looking up a
price. The recording holds one ordinary shopping session: eight quotes across
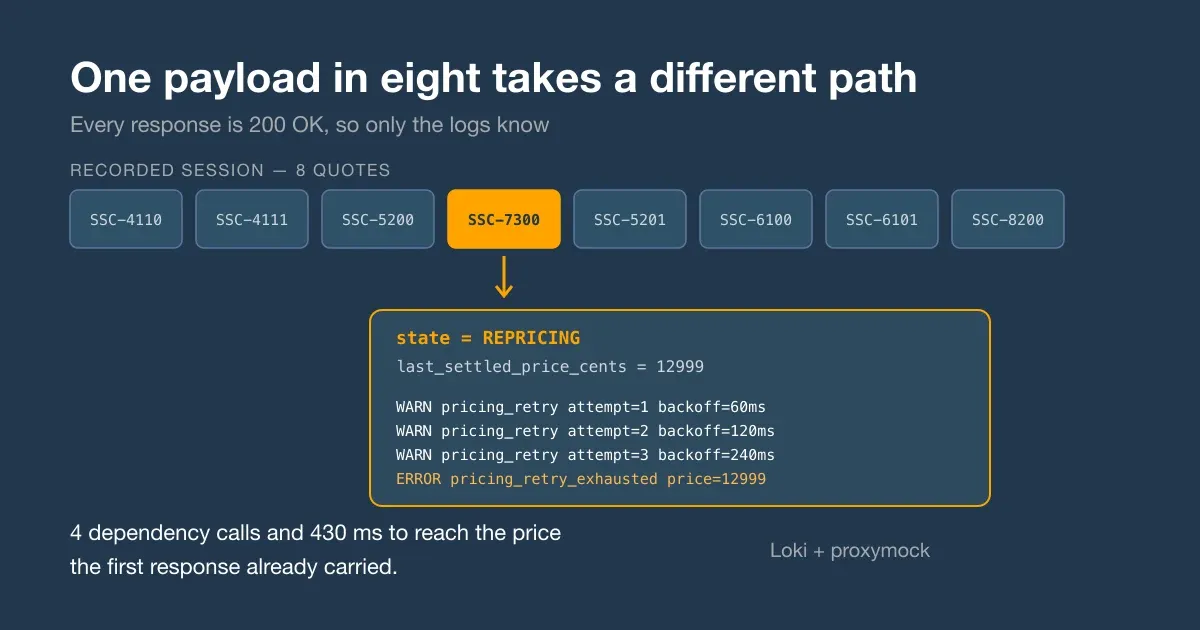
eight SKUs. Seven of them settle immediately. The eighth, SSC-7300, was
inside a repricing window when the traffic was captured, so the pricing
dependency answered like this:
{
  "sku": "SSC-7300",
  "currency": "USD",
  "state": "REPRICING",
  "unit_price_cents": 0,
  "last_settled_price_cents": 12999,
  "repricing_window_ms": 900000
}
That is a successful response. It withholds the live price and republishes the last price the dependency settled on, which callers are expected to honor until the window closes. The checkout client does not read it that way. It treats an unsettled answer as a transient failure, retries three more times on a 60/120/240 ms backoff, gives up, logs an error, and then uses the last settled price — the one the very first response already contained.
The caller-visible result is correct. The cost is four dependency calls, 420 milliseconds of backoff, and four log lines per occurrence. In the replay below, that path runs on 100 of 800 requests.
The app writes JSON logs with log/slog; Grafana Alloy tails the file and
pushes every line into Loki under the stream label service="checkout".
Nothing parses log text — every field the queries use comes from | json.
Prerequisites
- Docker with Compose
- Go 1.23 or newer,
curl, andjq - proxymock 2.5.842 or newer, initialized and on
PATH - An MCP client with STDIO support; the commands below use Codex
The lab pins Loki 3.5.7, Grafana Alloy v1.12.0, Grafana 13.1.0, and Grafana MCP 0.14.0.
Install proxymock and clone the lab:
brew install speedscale/tap/proxymock
proxymock init
proxymock version

git clone https://github.com/speedscale/mock-lab.git
cd mock-lab/labs/loki
Every command below runs from the mock-lab/labs/loki directory unless a step says
otherwise.
1. Start Loki, Alloy, and Grafana
make test
make up
make up starts a Compose stack with Grafana at http://127.0.0.1:3004
(disposable admin / admin credentials) and Loki at
http://127.0.0.1:3100. Alloy mounts the lab’s log directory read-only and
ships new lines within a second or two.
2. Record one ordinary shopping session
make capture RECORDING_DIR=proxymock/recordingThe target starts the pricing fixture and the checkout API under
proxymock record, sends eight quotes through the inbound reverse proxy, and
shuts both down. The recording holds 8 inbound quotes and 11 outbound price
lookups: seven SKUs needed one lookup each, and SSC-7300 needed four,
because the client retried it while it was being recorded.
Nothing about this capture is special, and that is the point. Nobody constructed the repricing payload. It was in the traffic on the day the traffic was recorded, and it is now a fixture that can be replayed on demand for as long as the recording exists.
3. Replay the baseline and save exact UTC intervals
Start the API against the recorded dependency; the pricing fixture is no longer needed:
make mock RECORDING_DIR=proxymock/recordingWait for mocking traffic sent from your app, then in another terminal, from
mock-lab/labs/loki:
make functional-replay RESULTS_DIR=proxymock/results/baseline
make load-replay RESULTS_DIR=proxymock/results/baseline
make verify RESULTS_DIR=proxymock/results/baseline
Functional mode sends the eight recorded quotes once and fails unless
requests.failed=0 and requests.result-match-pct=100. Load mode runs only
after that gate and sends 25 iterations from each of four virtual users: 800
requests, of which exactly 100 take the rare path.
Each successful replay pauses for log ingestion, then writes a window.json
beside its summary:
proxymock/results/baseline/load/window.jsonThe file contains the replay’s nanosecond start and end, plus three
derived fields: query_start floored to a whole second, query_end ceilinged
past Alloy’s push interval, and window_seconds, the integer difference. The
agent passes query_start and query_end through unchanged as the Loki time
range and window_seconds unchanged as the LogQL range. The reader never
records, copies, rounds, substitutes, or confirms a timestamp.
4. Configure the actual MCP interfaces
codex mcp add proxymock -- proxymock mcp run \
  --work-dir "$PWD"

codex mcp add grafana -- docker run --rm -i \
  --add-host host.docker.internal:host-gateway \
  -e GRAFANA_URL=http://host.docker.internal:3004 \
  -e GRAFANA_USERNAME=admin \
  -e GRAFANA_PASSWORD=admin \
  grafana/mcp-grafana:0.14.0 -t stdio --disable-write \
  --enabled-tools datasource,loki,navigation

codex mcp list
In this pinned stack, the relevant runtime tools and required arguments are:
| Tool | Required arguments used here |
|---|---|
list_datasources | optional type, limit, offset |
list_loki_label_names | datasourceUid; optional startRfc3339, endRfc3339 |
query_loki_logs | datasourceUid, logql; this guide also supplies queryType, the RFC3339 range, limit |
search_local_traffic | in-directory; this guide also supplies direction, method, query, limit, and offset |
response_diff | in-directory, baseline-directory |
These names and argument shapes came from tools/list against Grafana MCP
0.14.0 and proxymock MCP, not from guesswork. In this Grafana MCP version the
Loki tools take startRfc3339 and endRfc3339, and query_loki_logs runs
metric queries as well as log queries.
5. Let the logs name the anomaly
Do not inspect or edit application code yet. Give the agent this exact prompt:
Work in the loki directory of the mock-lab clone. Do not edit application code.

Parse proxymock/results/baseline/load/window.json. Report start and end. Assign
query_start, query_end, and window_seconds from the file; do not alter them or
ask me to record, copy, substitute, widen, round, or confirm timestamps. Write
every LogQL range below as [<window_seconds>s].

Call list_datasources with {"type":"loki","limit":50,"offset":0}.

Call query_loki_logs with queryType="instant", startRfc3339=file.query_start,
and endRfc3339=file.query_end. Use these exact logql values:
1. sum by (level) (count_over_time({service="checkout"} | json [<window_seconds>s]))
2. sum by (event) (count_over_time({service="checkout"} | json | level =~ `WARN|ERROR` [<window_seconds>s]))
3. sum by (sku, dep_state) (count_over_time({service="checkout"} | json | event = `pricing_retry_exhausted` [<window_seconds>s]))
4. quantile_over_time(0.95, {service="checkout"} | json | event = `quote_served` | unwrap duration_ms [<window_seconds>s]) by (price_source)
5. sum by (price_source) (count_over_time({service="checkout"} | json | event = `quote_served` [<window_seconds>s]))

Report lines per level, the events behind the WARN and ERROR lines, the SKU and
dependency state that produce them, the p95 served duration per price source,
and how many quotes used each price source. Take the exact request total from
proxymock/results/baseline/load/summary.json. State whether this is an error
condition or a state transition the service is handling. If a query returns no
data, repeat the identical call at most three times, then stop.
In the reference run, the baseline interval was
2026-08-13T19:26:29Z–2026-08-13T19:26:53Z, 24 seconds:
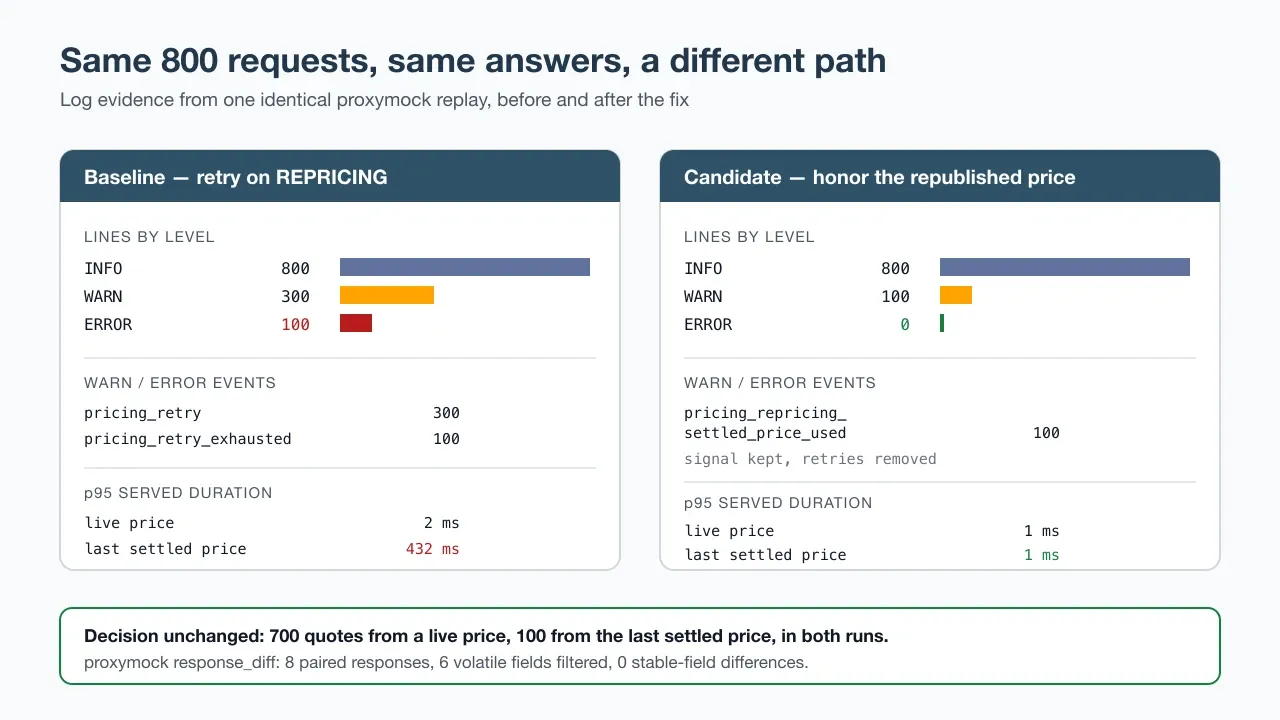
Over the unchanged 24-second interval the stream contains 800 INFO lines, 300 WARN lines, and 100 ERROR lines. Every WARN line is
pricing_retryand every ERROR line ispricing_retry_exhausted; there are no other warning or error events. All 100 exhaustions carrysku="SSC-7300"anddep_state="REPRICING". The replay summary reports 800 requests with 0 failed, and 700 quotes were served from a live price against 100 from the last settled price — so the rare path ran on exactly the 100 requests that logged the retries, three warnings and one error each. p95 served duration is 2 ms for live-price quotes and 432 ms for last-settled quotes. This is not an error condition: nothing failed, and the service reached a defensible answer 100 times. It is a state transition being handled by retrying, at a cost of about 430 ms and four log lines per occurrence.
Three properties of that answer are worth naming, because they are what separate a usable log signal from a log flood. The event is named, so it can be counted. It carries the dependency state that produced it, so it points outward at a contract rather than inward at a stack trace. And it carries a duration and a price source, so the same lines that identify the branch also price it.
6. Correlate the event chain to the recorded payload
A count is not a cause. The next prompt reads one occurrence end to end, then crosses from logs into the traffic that produced them:
Work in the loki directory of the mock-lab clone. Do not edit application code.

Using the same window.json interval, call query_loki_logs with
queryType="range", direction="forward", limit=20, and
logql={service="checkout"} | json | event = `pricing_retry_exhausted`
to obtain one request_id. Then query
logql={service="checkout"} | json | request_id = `<that id>`
with the same options and read the whole chain in order.

Then call proxymock MCP search_local_traffic with:
{"in-directory":["proxymock/recording"],"direction":"out","method":"GET","query":"/v1/price/SSC-7300","limit":20,"offset":0}

Read the returned RRPair files. Report the recorded dependency response body
that triggers the retries, state which field of that body makes the retries
unnecessary, and say how many times that same outbound call appears in the
recording.
The chain for a single request is the whole bug in five lines:
19:26:41.659  WARN   pricing_retry             attempt=1 dep_state=REPRICING backoff_ms=60
19:26:41.722  WARN   pricing_retry             attempt=2 dep_state=REPRICING backoff_ms=120
19:26:41.845  WARN   pricing_retry             attempt=3 dep_state=REPRICING backoff_ms=240
19:26:42.089  ERROR  pricing_retry_exhausted   dep_state=REPRICING price_source=last_settled
19:26:42.089  INFO   quote_served              duration_ms=431 price_source=last_settled
The recording contains four outbound
GET /v1/price/SSC-7300RRPairs, all status 200, all with the identical body:state=REPRICING,unit_price_cents=0,last_settled_price_cents=12999,repricing_window_ms=900000. The four copies are the four attempts, captured at record time. The field that makes the retries unnecessary islast_settled_price_cents: the dependency publishes an authoritative price in the same response it marks as repricing, and it stays authoritative for the length of the window. The client already uses that field — but only after exhausting its retries, and the value it finally uses is the one the first response carried.
That is the sentence the fix depends on, and note where it came from: a recorded payload, not a hypothesis. The trigger is a fixture now. Any change to the retry logic can be re-tested against it without waiting for another repricing window in production.
7. Make the smallest fix and prove both properties
The change in internal/checkout/checkout.go is to honor the republished
price on the first answer instead of retrying toward it, and to keep logging
the transition once so the signal survives the fix. Validation, the error path
for a dependency that publishes no usable price, and every response field stay
exactly as they were. Run make test, restart make mock so it rebuilds the
candidate, and repeat both replays into a candidate directory:
make functional-replay RESULTS_DIR=proxymock/results/candidate
make load-replay RESULTS_DIR=proxymock/results/candidate
make verify RESULTS_DIR=proxymock/results/candidate
Then prove the two properties separately. Behavior, through proxymock
response_diff with the baseline functional directory as baseline and the
candidate functional directory as candidate; and the log pattern, by repeating
the step 5 queries over the candidate’s own window.
| Evidence (identical 800-request replay) | Baseline | Candidate |
|---|---|---|
| Pricing calls per repricing quote | 4 | 1 |
| WARN lines | 300 | 100 |
| ERROR lines | 100 | 0 |
pricing_retry events | 300 | 0 |
pricing_retry_exhausted events | 100 | 0 |
| Quotes served from a live price | 700 | 700 |
| Quotes served from the last settled price | 100 | 100 |
| p95 served duration, last settled price | 432 ms | 1 ms |
| Replay p95 latency | 431 ms | 1 ms |
| Failed requests | 0 | 0 |
| Stable-field response differences | comparison source | 0 (none) |
response_diff compared 8 paired responses, filtered 6 volatile fields, and
found no stable-field differences.
The two middle rows are the acceptance test. The service made exactly the same decision 800 times — 700 live prices, 100 last-settled prices — before and after. What changed is that reaching the second decision no longer costs four dependency calls, 420 milliseconds, and four log lines. The remaining 100 WARN lines are deliberate: the service still records that it hit a repricing window and which price it used, because that is a real state transition and someone will eventually want to know how often it happens. A fix that deleted the signal along with the retries would have scored better on log volume and worse on every future incident.
The machine-readable reference behind this table is
loki/evidence/reference.json
in the lab repository.
When the log flood is telling the truth
The reverse case matters as much. If the same queries had shown error events
spread across many SKUs and many dependency states, or a count that did not
line up with any request population, then the logs would be reporting a real
failure rather than an expensive success, and the next move would be the
dependency rather than the client. The discriminator is the correlation in
step 6: a single request_id chain that ends in quote_served with a 200 is
a handled transition. One that ends in quote_failed is an outage, and no
amount of retry tuning fixes it.
Two other guides in this series pick up where this one stops. When the symptom is latency without an obvious branch, the Prometheus guide separates waiting from working. When the requests never arrive at all, the Hubble guide distinguishes a slow dependency from a dropped packet.
Measurement limitations
- Alloy assigns Loki timestamps as it reads the file, so a line’s position in
the stream can trail the
timefield inside the JSON by a fraction of a second. That is why the replay targets pause before closing the window rather than querying the instant the replay ends. count_over_timeover a fixed range is an exact count of matching lines. The exact replay request total still comes from proxymock’ssummary.json, because a log line is only evidence of what the app chose to log.unwrap duration_msreads the app’s own measurement of its handler, not the client-observed latency the replay summary reports. The two agree here because the handler is nearly the whole request.- The mocked dependency answers in about a millisecond, so the throughput difference between the runs is larger than a production fix would deliver. The direction is real; the multiple is a lab artifact.
- 12.5% is a generous rate for a rare path, chosen so a 30-second replay produces countable evidence. A one-in-ten-thousand payload behaves identically but needs a much longer replay.
- Retrying an unsettled dependency answer is not always wrong. It is wrong here because the dependency publishes an authoritative value in the same response. A dependency that publishes nothing usable still needs the retry and the error path the lab keeps.
Clean up
Stop make mock with Ctrl-C. Then remove only this lab’s Compose stack and
its volumes:
make down