Load Test PostgreSQL Instantly using Production Recordings
The first PostgreSQL post ran on a laptop: a demo app, a Docker container, and the proxymock CLI. That is the fastest way to see the idea. It is also not where your database problems live.
Your real query mix lives in the cluster, where a Java service with a connection pool, an ORM and a schema migration tool sends the statements nobody wrote by hand. This post deploys an open source banking app to Kubernetes and records the queries one of its services sends to PostgreSQL. From the Speedscale dashboard, it then turns them into two tests against a QA database: a regression test that catches a breaking migration, and a load test that runs the recorded statements with 10 concurrent sessions.
Every command below was run on a fresh minikube cluster, and every number and screenshot comes from that run.
- Thirteen minutes of recording gave a snapshot with 3,316 PostgreSQL messages from one service, including the ORM, driver and Flyway queries nobody wrote by hand.
- Choose replay tests turns those statements into tests, so the replay connects to a QA database directly and the app does not need to run.
- The clean baseline matched 100%. Dropping one column in QA took it to 67.33%, and the report listed every
INSERTandSELECTthat touched the column. - The same snapshot drove 975,946 statements in one minute from 10 sessions, every one with the recorded outcome, at a p99 of 7.2 ms.
flowchart LR
    subgraph A[banking-app namespace]
        T[banking-transactions + Speedscale sidecar] -->|real queries| P[(banking-postgres)]
    end
    T -.records.-> S[Snapshot in Speedscale cloud]
    S --> R[Replay: PostgreSQL traffic as tests]
    subgraph Q[banking-qa namespace]
        R --> QA[(qa-postgres)]
    end
What you need
- A Kubernetes cluster with about 6 CPUs and 7 GB of memory to spare. A local cluster works:
minikube start --cpus=6 --memory=7g. kubectlandhelm.- A Speedscale account. The free trial is enough.
- The
speedctlCLI, signed in to that account:
sh -c "$(curl -Lfs https://downloads.speedscale.com/speedctl/install)"
speedctl init
1. Deploy the demo app
The app is microsvc, an open source banking system: a Next.js frontend, an API gateway, user, accounts and transactions services in Spring Boot, a Go fraud service, Kafka, MongoDB and one PostgreSQL server with a schema per service. It ships a simulation client that signs users in and moves money around in bursts, so the cluster has realistic traffic without a load generator of your own.
Deploy it into the banking-app namespace straight from GitHub, and wait for every deployment to come up:
kubectl apply -k github.com/speedscale/microsvc/kubernetes/overlays/local
kubectl -n banking-app wait --for=condition=Available deployment --all --timeout=10m
The service this post records is banking-transactions. It writes to transactions_service.transactions through Hibernate, the HikariCP connection pool and the PostgreSQL JDBC driver, and Flyway manages its schema.
2. Install the Speedscale operator
speedctl prints the Helm commands for your account, with your API key and a cluster name filled in. Pick any name; it is how the cluster shows up in the dashboard:
speedctl deploy operator -e blog-minikubeRun the helm commands it prints. The chart also deploys a small Java demo of its own, which this walkthrough does not need; add --set deployDemo="" to the helm install line to skip it on a small cluster. Then check that the operator, forwarder and inspector are running:
kubectl -n speedscale get pods3. Record the service
Annotate the deployment, and the operator injects a Speedscale sidecar that records the service’s inbound and outbound traffic:
kubectl -n banking-app annotate deployment banking-transactions \
  sidecar.speedscale.com/inject=true
The annotation rolls the deployment, and the new pod starts with a speedscale-goproxy container next to the app. That restart matters for PostgreSQL. The wire protocol names the user and database only when a connection opens, and HikariCP prepares its statements once per connection, so the recording needs the pool’s connections to open through the proxy. Starting fresh also records the Flyway and Hibernate startup queries.
Give the simulation client 15 minutes or so. Then open Services, filter on your cluster, and click View traffic for banking-transactions. The PostgreSQL messages sit next to the inbound HTTP calls: prepare, bind and execute for every statement the service sent.
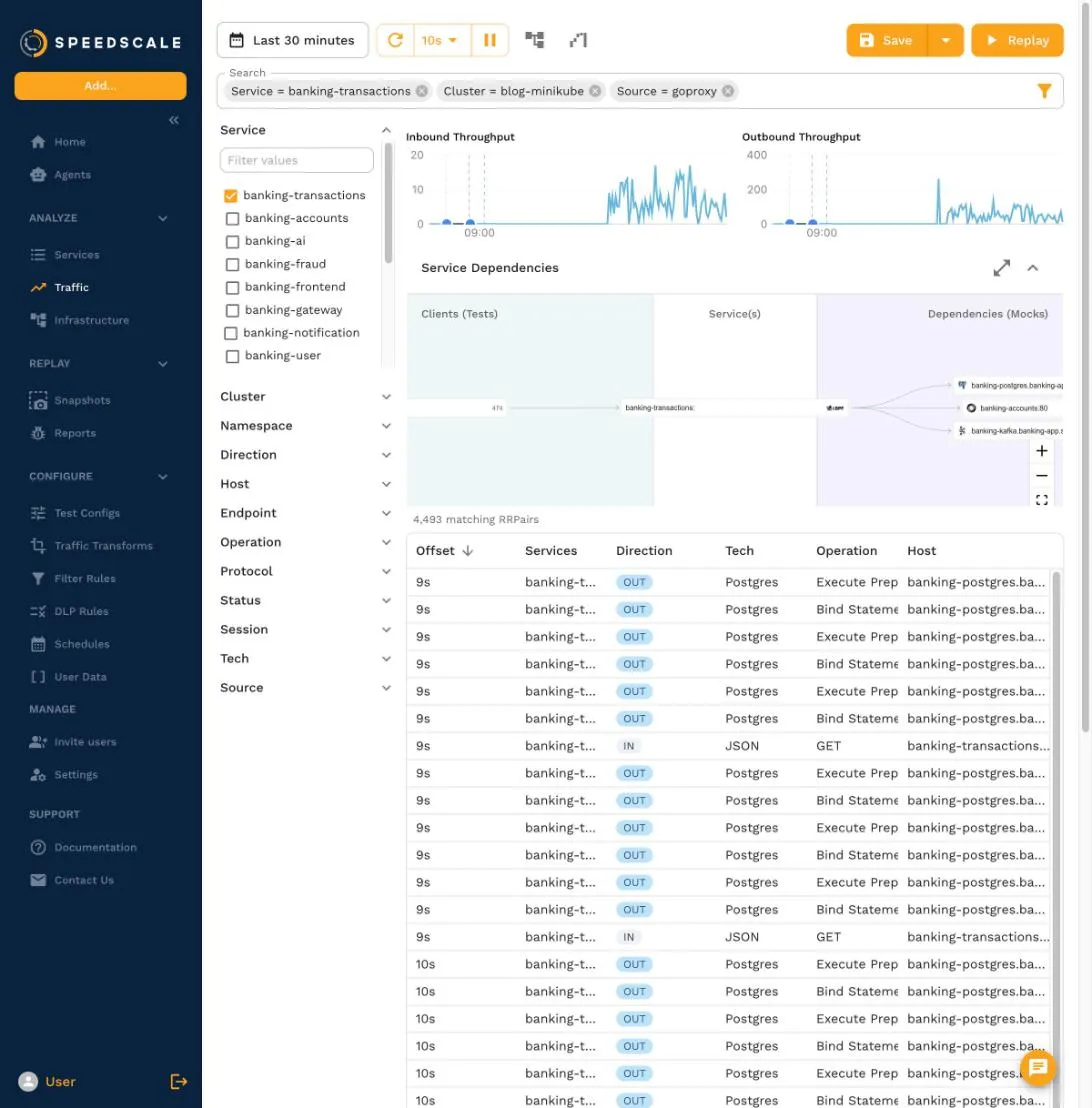
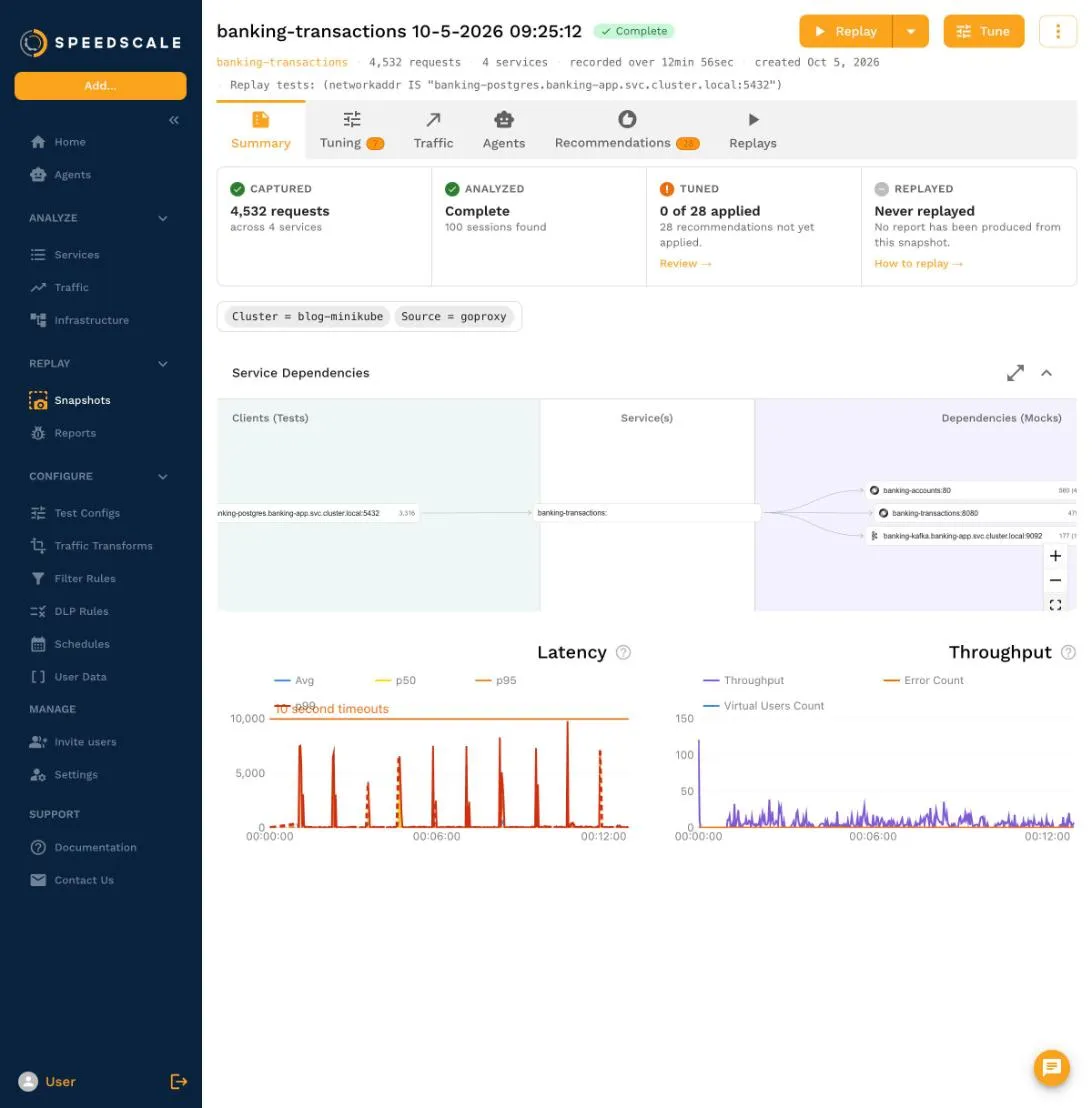
Click Save to turn the time range into a snapshot. This one covers 12 minutes and 56 seconds: 479 inbound HTTP calls, and outbound traffic to three dependencies, with banking-postgres at 3,316 messages, banking-accounts at 560 and Kafka at 177. A normal replay would send the HTTP calls as tests and mock all three dependencies.
4. Make the PostgreSQL traffic the tests
Open Choose replay tests from the snapshot’s ⋮ menu, select Outbound dependencies, and check the database. The dialog shows the filter it will save: (networkaddr IS "banking-postgres.banking-app.svc.cluster.local:5432").
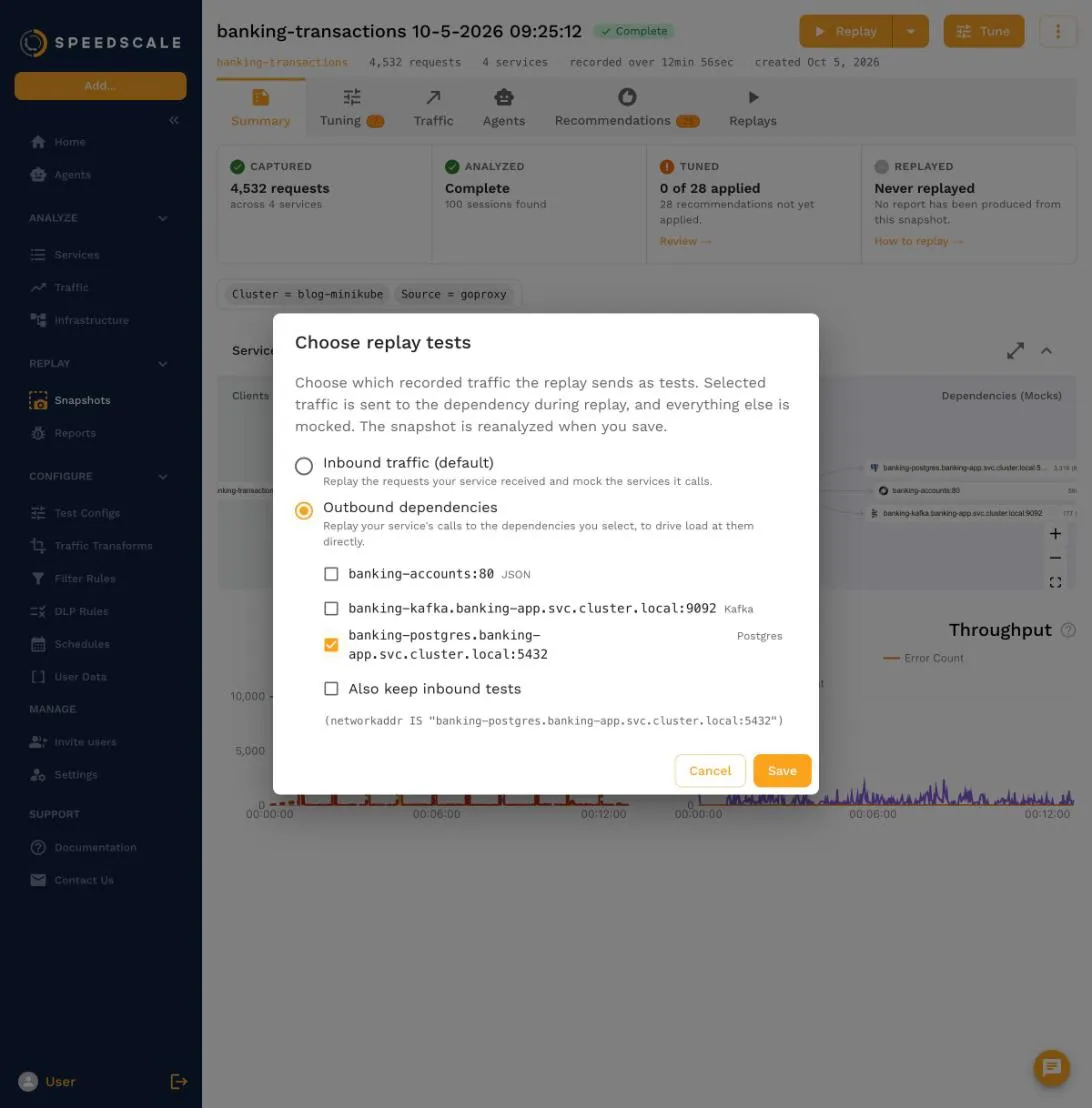
Save, and the snapshot is reanalyzed. The service map flips: the 3,316 PostgreSQL messages move under Clients (Tests), and the HTTP and Kafka dependencies stay mocked. The recording itself is unchanged; only its role in the replay is. It is the mirror image of mocking PostgreSQL, where the same messages answer the app instead of driving the database. If other replays or a CI job already use a snapshot, clone it from the ⋮ menu first, because this step changes what every replay of it sends.
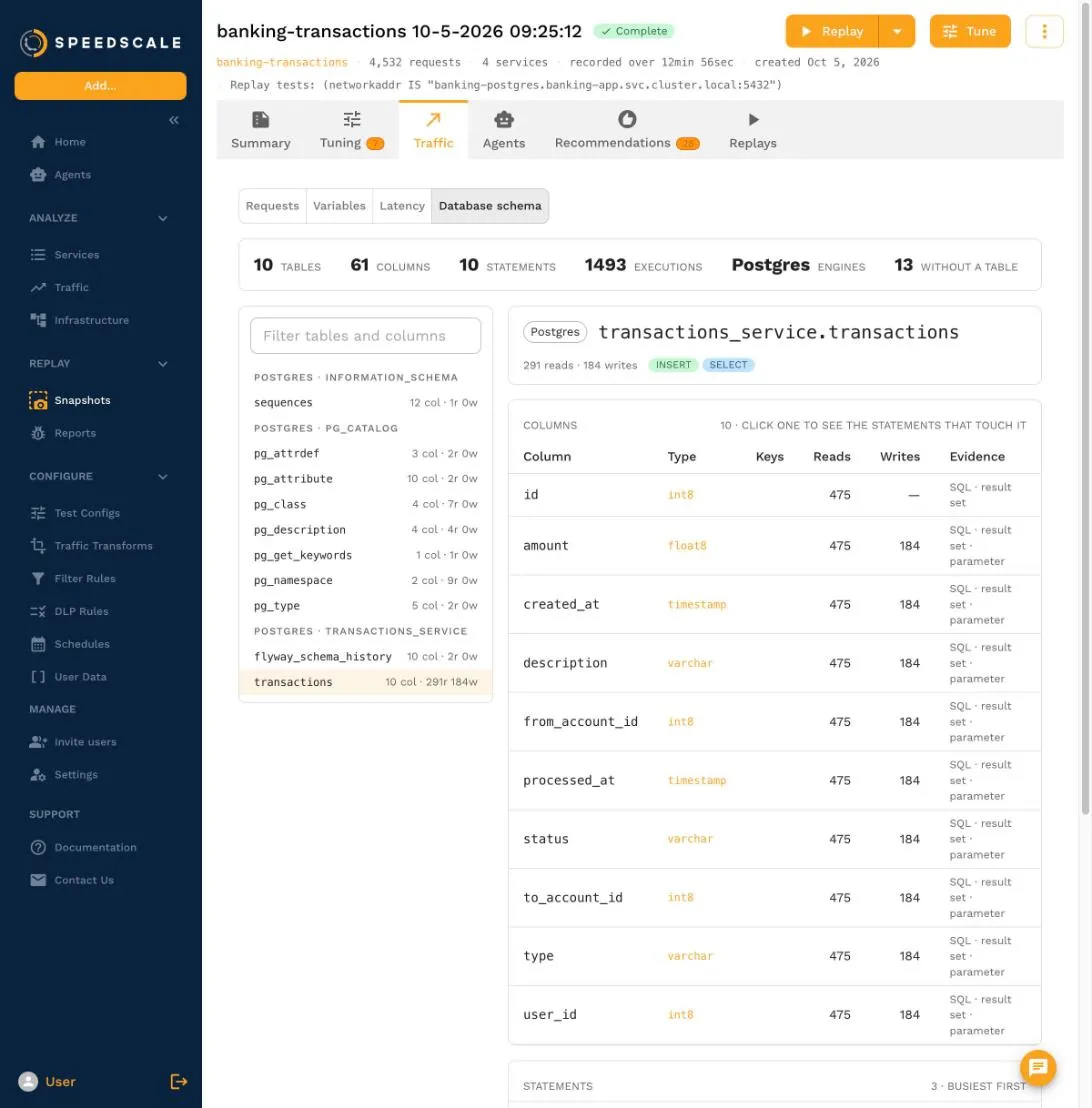
Before replaying, open Traffic → Database schema to see what the tests will touch. The snapshot holds 1,493 statement executions across 10 tables. For transactions_service.transactions, every column was read 475 times and written 184 times, by one INSERT ... RETURNING * and two SELECT statements that Hibernate generated. That table is where a careless migration will show up.
5. Create a disposable QA database
The replay runs real inserts, so give it a database it can break. Here that is a separate PostgreSQL in a banking-qa namespace:
kubectl apply -f - <<'EOF'
apiVersion: v1
kind: Namespace
metadata:
  name: banking-qa
---
apiVersion: apps/v1
kind: Deployment
metadata:
  name: qa-postgres
  namespace: banking-qa
spec:
  selector:
    matchLabels: { app: qa-postgres }
  template:
    metadata:
      labels: { app: qa-postgres }
    spec:
      containers:
        - name: postgres
          image: postgres:15-alpine
          env:
            - { name: POSTGRES_PASSWORD, value: qa-admin-throwaway }
          ports:
            - containerPort: 5432
---
apiVersion: v1
kind: Service
metadata:
  name: qa-postgres
  namespace: banking-qa
spec:
  selector: { app: qa-postgres }
  ports:
    - port: 5432
EOF
kubectl -n banking-qa rollout status deployment/qa-postgres
Create the app’s role, a throwaway login for the replay, and an empty database, then copy the transactions_service schema across with no rows:
kubectl -n banking-qa exec -i deploy/qa-postgres -- psql -U postgres <<'SQL'
CREATE ROLE transactions_service_user;
CREATE ROLE replay_qa LOGIN PASSWORD 'choose-a-throwaway-password';
GRANT transactions_service_user TO replay_qa;
CREATE DATABASE replay_qa OWNER replay_qa;
SQL

kubectl -n banking-app exec deploy/banking-postgres -- \
  pg_dump -U postgres -s -n transactions_service banking_app \
  | kubectl -n banking-qa exec -i deploy/qa-postgres -- psql -U postgres -d replay_qa
The GRANT is the non-obvious line. The recording includes the app’s own SET ROLE 'transactions_service_user', and the replay sends it like any other statement. Without the membership, that statement fails and every statement after it runs as the wrong role.
The replay opens its own PostgreSQL sessions, so it needs credentials. They go in the generator.postgres section of a test config. Credentials in the postgres:// address are rejected, which keeps them out of the replay request. This config replays the snapshot once with one virtual user and fails if any result differs from the recording:
{
  "id": "qa-postgres-regression",
  "generator": {
    "postgres": {
      "username": "replay_qa",
      "password": "choose-a-throwaway-password",
      "database": "replay_qa",
      "tlsMode": "PROTOCOL_TLS_MODE_DISABLE"
    },
    "stages": [{ "virtualUsers": { "virtualUsers": "1", "requestDelay": {} } }]
  },
  "rules": [{ "metricName": "expStatusCodePct", "type": "TOO_LOW", "value": 100, "action": "ALERT" }],
  "cluster": { "replayMode": "generator-only" }
}
Paste it into the JSON view of a new config under Test Configs, or save it as ~/.speedscale/data/testconfigs/qa-postgres-regression.json and push it with proxymock cloud push test-config qa-postgres-regression. generator-only matters: there is no app to mock dependencies for, only a database to send statements to. The replay logs a warning that a literal password is stored with the test config and the report. That is acceptable for a throwaway QA role. For a database you keep, use a secret reference such as ${{secret:pg-creds/password}}.
6. Point the replay at the QA database
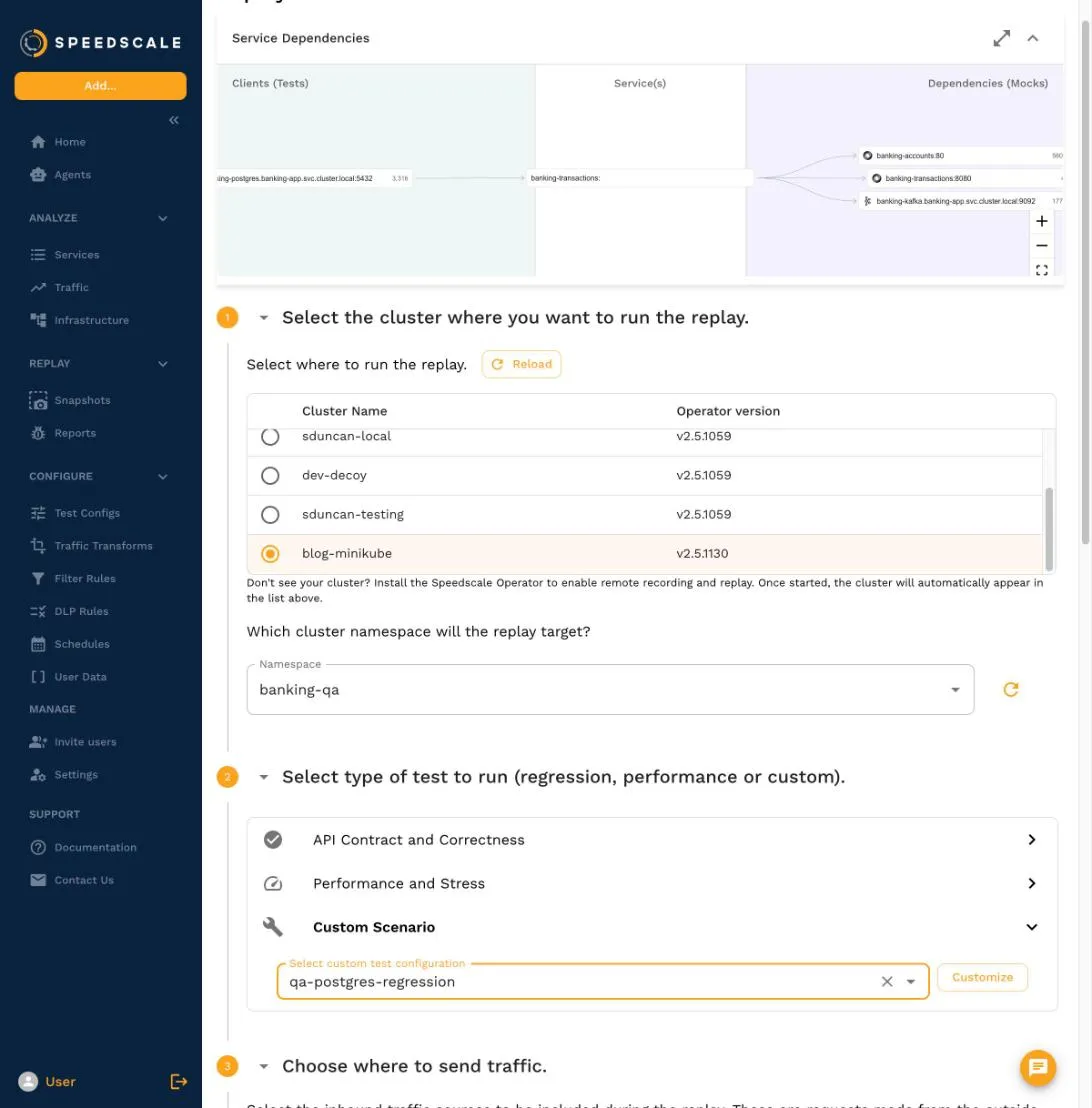
Click Replay on the snapshot. Pick your cluster and the banking-qa namespace, then the test config under Custom Scenario.
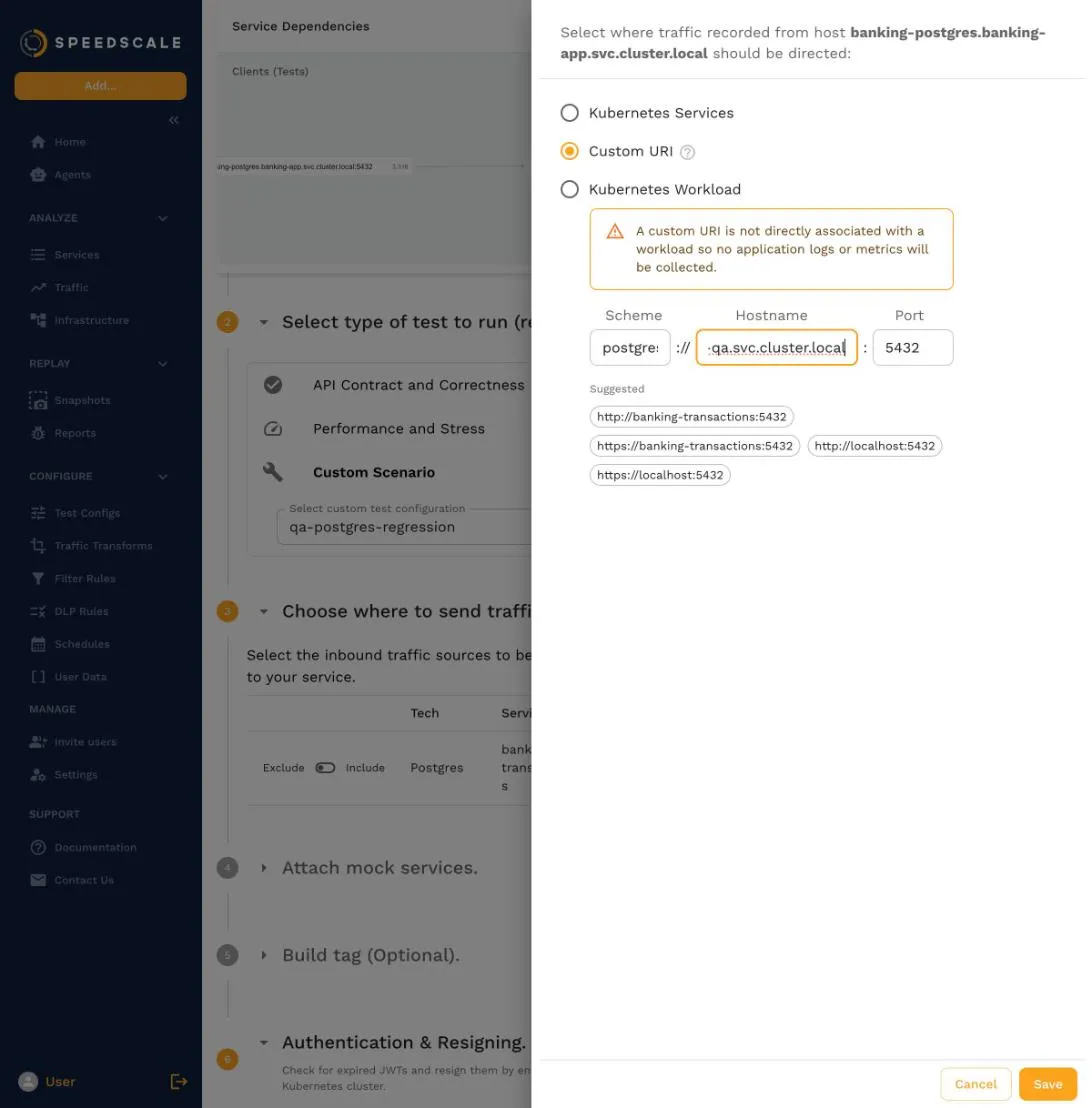
Under Choose where to send traffic, the PostgreSQL row starts out excluded with no target, because nothing in banking-qa matches the recorded workload. Edit it, choose Custom URI, and enter scheme postgres, host qa-postgres.banking-qa.svc.cluster.local and port 5432. Saving the target switches the row to Include. The database name comes from the test config.
Start the replay. Before it sends anything, the replay connects once with the configured user. A wrong password or a missing database stops it right there with PostgreSQL’s error, instead of failing 3,316 statements one by one.
7. Regression test a migration
The first run against the clean QA schema is the baseline. It came back at a 100% result match, with no errors in the QA database’s log. The result match compares each statement’s outcome with the recording: success with success, or the same SQLSTATE.
Now ship a bad migration to QA:
kubectl -n banking-qa exec deploy/qa-postgres -- psql -U postgres -d replay_qa \
  -c 'ALTER TABLE transactions_service.transactions DROP COLUMN description;'
Run the same replay again. The result match dropped to 67.33%, and the goal failed.
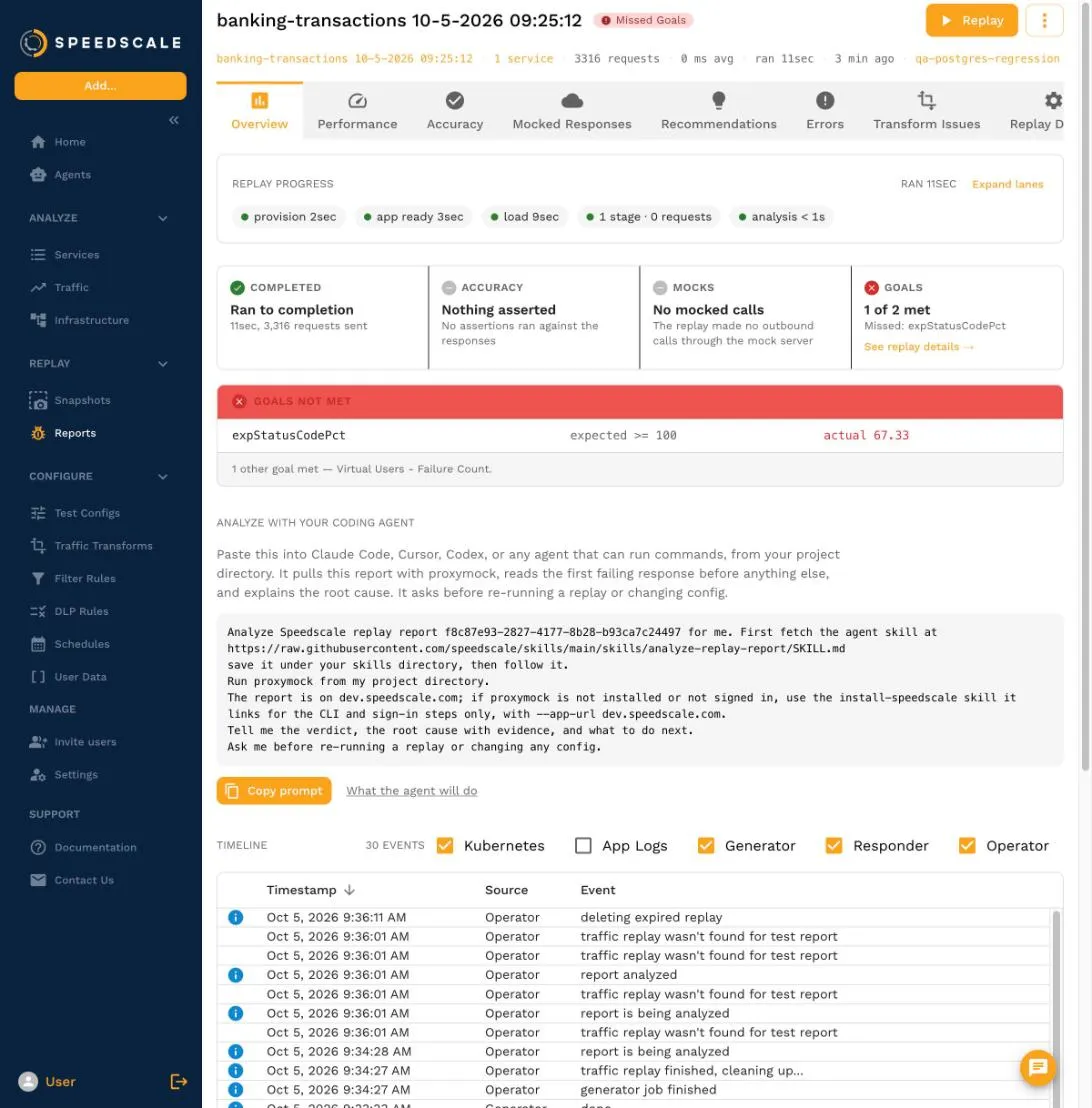
The Latency Summary by Endpoint on the Performance tab says which statements broke, with an error count and rate for each:
| Statement | Executions | Errors |
|---|---|---|
INSERT INTO transactions_service.transactions ... RETURNING * | 184 | 184 (100%) |
SELECT ... FROM transactions_service.transactions t1_0 WHERE t1_0.user_id = ? | 179 | 179 (100%) |
SELECT ... WHERE t1_0.user_id = ? AND (t1_0.from_account_id = ? OR t1_0.to_account_id = ?) | 112 | 112 (100%) |
COMMIT | 480 | 0 |
PostgreSQL’s log agrees: column "description" of relation "transactions" does not exist for the inserts and column t1_0.description does not exist for the selects, both SQLSTATE 42703. Nobody wrote those SELECTs. Hibernate generated them, which is exactly why a hand-written test suite tends to miss them while a recording catches every one. That is also why the API tests for this service could pass while the database underneath them changes, a gap covered in comparing SQL between runs.
8. Load test the QA database
Restore the schema by copying it across again:
kubectl -n banking-qa exec deploy/qa-postgres -- psql -U postgres -d replay_qa \
  -c 'DROP SCHEMA transactions_service CASCADE'
kubectl -n banking-app exec deploy/banking-postgres -- \
  pg_dump -U postgres -s -n transactions_service banking_app \
  | kubectl -n banking-qa exec -i deploy/qa-postgres -- psql -U postgres -d replay_qa
Then run a second test config that keeps the same generator.postgres section but changes the load:
{
  "id": "qa-postgres-load",
  "generator": {
    "postgres": { "username": "replay_qa", "password": "choose-a-throwaway-password", "database": "replay_qa", "tlsMode": "PROTOCOL_TLS_MODE_DISABLE" },
    "lowDataMode": true,
    "stages": [{ "duration": "60s", "virtualUsers": { "virtualUsers": "10", "requestDelay": {} } }]
  },
  "rules": [{ "metricName": "p99Latency", "value": 5000, "action": "ALERT" }],
  "cluster": { "replayMode": "generator-only" }
}
Each virtual user is one PostgreSQL session that replays the recorded statements in order and loops until the stage ends, so prepared statements carry over the way they did in the app. lowDataMode keeps only a sample of the failing pairs, which keeps the replay itself light.
The report’s progress lanes show the stage live, here 20 seconds in with 10 virtual users at about 25,400 statements per second.
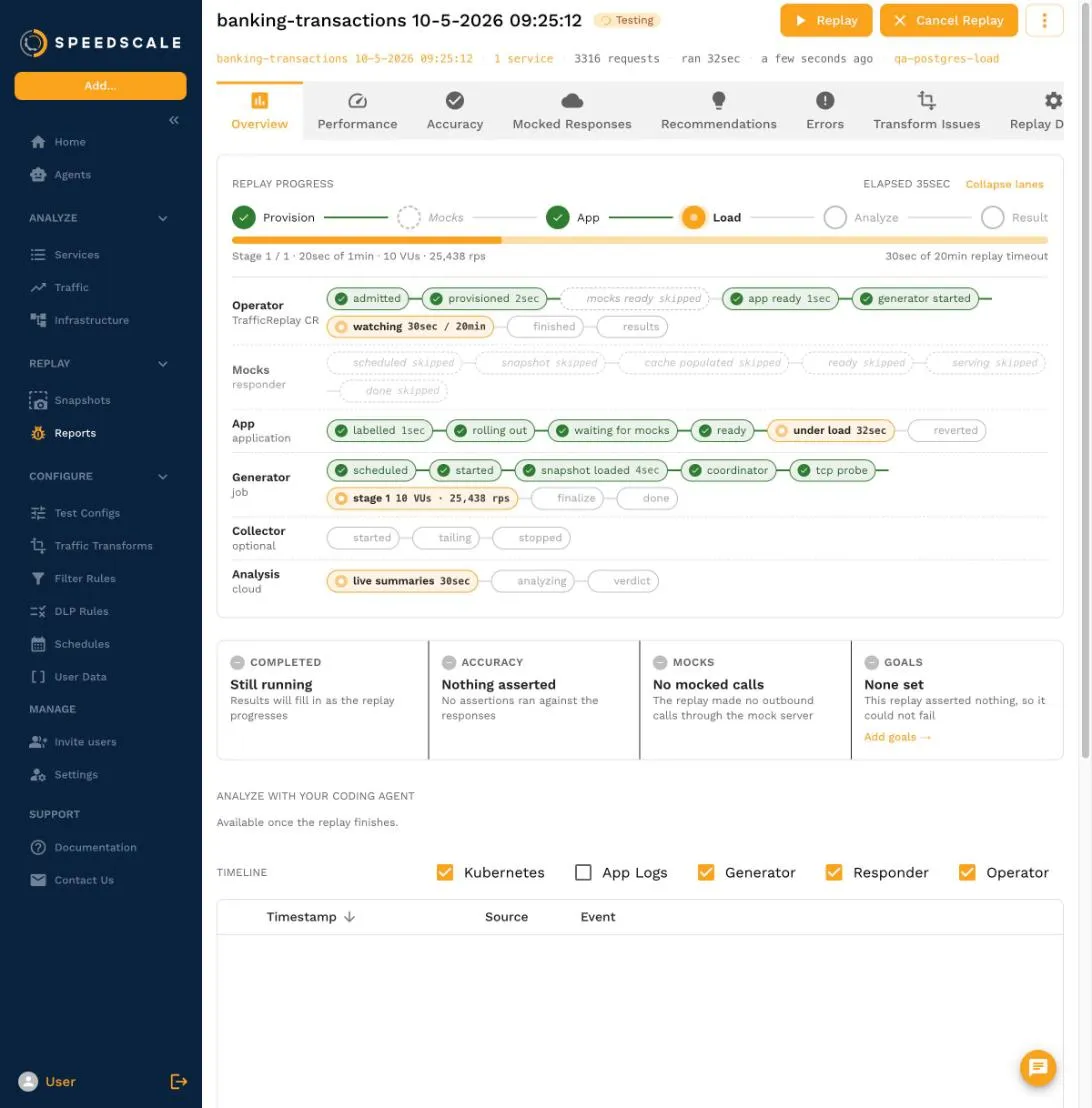
While it runs, the sessions show up in pg_stat_activity. Filter on the user, not on the application name: the recording includes the driver’s own SET application_name = 'PostgreSQL JDBC Driver', so the replay’s sessions report the app’s name rather than the replay’s.
kubectl -n banking-qa exec deploy/qa-postgres -- psql -U postgres -c "
  SELECT usename, application_name, state, count(*)
  FROM pg_stat_activity
  WHERE datname = 'replay_qa' AND pid <> pg_backend_pid()
  GROUP BY 1, 2, 3;"
usename | application_name | state | count
-----------+------------------------+---------------------+-------
replay_qa | PostgreSQL JDBC Driver | active | 1
replay_qa | PostgreSQL JDBC Driver | idle | 2
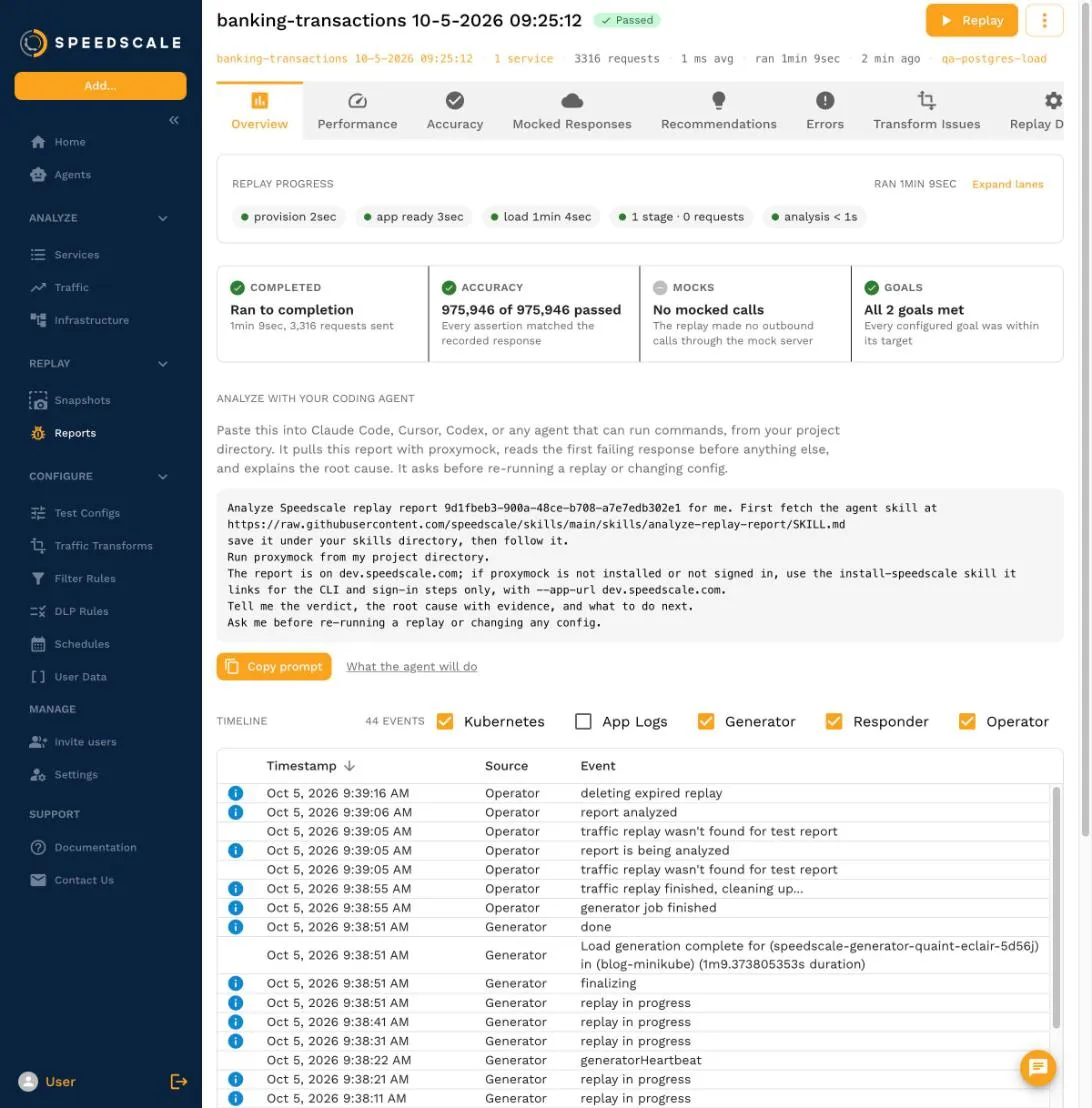
replay_qa | PostgreSQL JDBC Driver | idle in transaction | 7The run passed its goal. In one minute the 10 sessions sent 975,946 statements, averaging 16,265 per second, with a mean of 0.54 ms and p99 at 7.2 ms. Every statement came back with its recorded outcome.
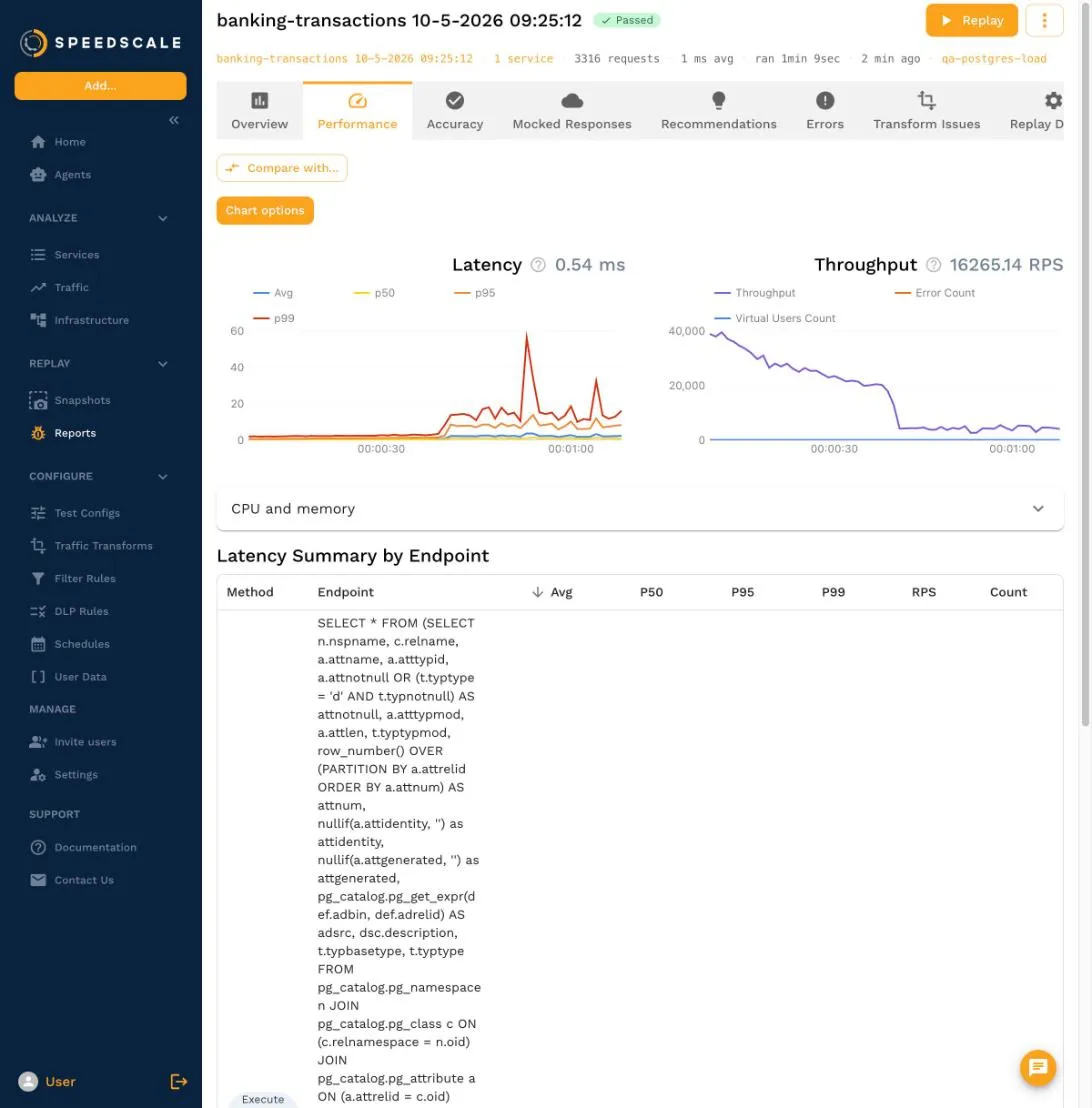
The throughput chart is the interesting part. It starts near 40,000 statements per second and ends near 5,000. The replay inserts the recorded rows again on every pass. By the end, the 111 recorded users had about 1,076 transactions each in QA instead of a handful, so the two Hibernate SELECTs that list a user’s transactions were sorting and returning hundreds of rows each. Both use the user_id index; they just read far more. They were the slowest busy statements, with p99 around 11 ms, against 3.3 ms for the 119,400 INSERTs. That is a real property of this query under data growth, and it also means two load runs are only comparable from the same starting data.
The laptop run in the first post did 18,756 statements per second with p99 at 1 ms. Neither number is the database’s speed in the abstract. Each one is what that database does with the queries its app actually sends, and here the QA database shared a laptop-sized cluster with the whole banking app.
Things to know
- Use a disposable QA database and role. The replay runs real inserts, and the regression test only works if you can break the schema on purpose.
- Compare against a baseline from the same starting data. A clean run against the current schema tells you what normal looks like for a snapshot. The regression signal is the drop from that baseline, along with the statements that started failing. Reset the schema between load runs, because rows from one run change what the next one reads.
- Recorded
SETstatements replay too.SET ROLEandSET application_namerun as recorded, which is why the QA login needs the app’s role and whypg_stat_activityshows the driver’s name. - Transactions are replayed statement by statement. Under load, each virtual user loops through statements recorded on many pool connections, so a replay can send
BEGINinside an open transaction orCOMMITwith none. PostgreSQL answers with a warning and the statement still counts as a success. - Row ids come from the recording. Statements that look rows up by id can return nothing on a fresh database. That is a different result set, not a failed statement.
- Record with a current operator. Before v2.5.1117, the recorder stored the connection pool’s health check as a copy of the previous statement on that connection. Speedscale v2.5.1130 and later skip those copies when they read an older recording, so older snapshots replay cleanly too. This run used v2.5.1130.
Clean up
kubectl delete namespace banking-qa banking-app
helm uninstall speedscale-operator -n speedscale
kubectl delete namespace speedscale
kubectl delete clusterrole,clusterrolebinding speedscale-forwarder
On minikube, minikube delete removes all of it at once.
The laptop demo proves the idea in five minutes. This version answers the question that matters before a release: does the QA database still accept every statement the service sends, and how does it hold up when those statements arrive ten sessions at a time? One snapshot from the cluster answers both.
The PostgreSQL Load and Regression Testing guide covers the same flow from the CLI and an AI assistant, and Choose What a Replay Tests covers the tests filter behind the dialog.