Developing highly resilient Kubernetes deployments is crucial for ensuring that your hosted applications in Kubernetes can effectively manage and recover from disruptions. This capability is vital in order to maintain continuous availability for your customers.
The importance of resilience in your distributed system also escalates depending on your customer base and the critical nature of your application. Even brief periods of downtime can have a significant negative impact on your business.
There are various methods and approaches to enhance the resilience of your distributed systems. Chaos engineering is one such approach. It involves rigorously testing and experimenting with your distributed systems to ensure they can withstand turbulent conditions, such as hardware failures, network issues, database outages, and security attacks. Adopting modern chaos engineering practices is essential for testing system performance under stress, using specialized tools to experiment safely within production environments.
Introduction to Chaos Engineering
Chaos engineering is a discipline that involves intentionally introducing failures or disruptions into a system to test its resilience and identify vulnerabilities. This practice helps organizations build more robust and reliable systems by simulating real-world scenarios and identifying potential weaknesses before they become critical issues. Chaos engineering is a proactive approach to ensuring the reliability and resilience of a system, and it is a key component of a DevOps culture.
In essence, chaos engineering allows teams to create chaos experiments that mimic unpredictable conditions, such as hardware failures, network issues, or sudden spikes in traffic. By doing so, they can observe how their systems behave under stress and make necessary adjustments to improve stability and performance. This method not only prepares systems for unexpected disruptions but also fosters a culture of continuous improvement and resilience. Today, we’re going to look at some of the top chaos engineering tools. After reading this, you will have a plethora of options to build your chaos toolkit!
Benefits of Chaos Engineering
The benefits of chaos engineering are numerous. By introducing controlled disruptions into a system, organizations can:
-
Identify vulnerabilities and weaknesses before they become critical issues: Chaos engineering helps uncover hidden flaws in the system that might not be apparent during regular operations. By proactively identifying these vulnerabilities, teams can address them before they lead to significant problems.
-
Improve the reliability and resilience of their systems: Regular chaos experiments ensure that systems are robust and can handle unexpected disruptions. This continuous testing and improvement process enhances overall system reliability.
-
Reduce downtime and improve overall system availability: By preparing for potential failures, organizations can minimize the impact of disruptions, leading to reduced downtime and higher availability of services.
-
Enhance their ability to respond to failures and outages: Chaos engineering equips teams with the knowledge and experience to respond swiftly and effectively to real-world incidents, reducing recovery times and mitigating damage.
-
Improve their understanding of how their systems behave under stress: Observing system behavior during chaos experiments provides valuable insights into performance bottlenecks and areas for optimization.
-
Reduce the risk of cascading failures and improve overall system stability: By identifying and addressing weak points, chaos engineering helps prevent small issues from escalating into larger, more severe problems, thereby enhancing system stability.
Key Features to Look for in Chaos Engineering Tools
When evaluating chaos engineering tools, there are several key features to look for. These include:
-
Support for a wide range of failure types: A robust chaos engineering tool should support various failure types, including resource failures (e.g., CPU, memory), network failures (e.g., latency, packet loss), and state failures (e.g., service crashes).
-
Integration with specific infrastructure: The tool should seamlessly integrate with your existing infrastructure, whether it’s AWS, Azure, Kubernetes, or other platforms. This ensures that chaos experiments can be conducted in a realistic environment.
-
Automation capabilities: Look for tools that offer automation features, such as the ability to run experiments on a schedule or trigger them in response to specific events. Automation streamlines the chaos engineering process and ensures continuous testing.
-
Visualization and analytics: Effective chaos engineering tools provide visualization and analytics capabilities, allowing you to view experiment results and analyze system behavior. This helps in understanding the impact of experiments and making target=“_blank” rel=“noopener”> Learn More
Speedscale
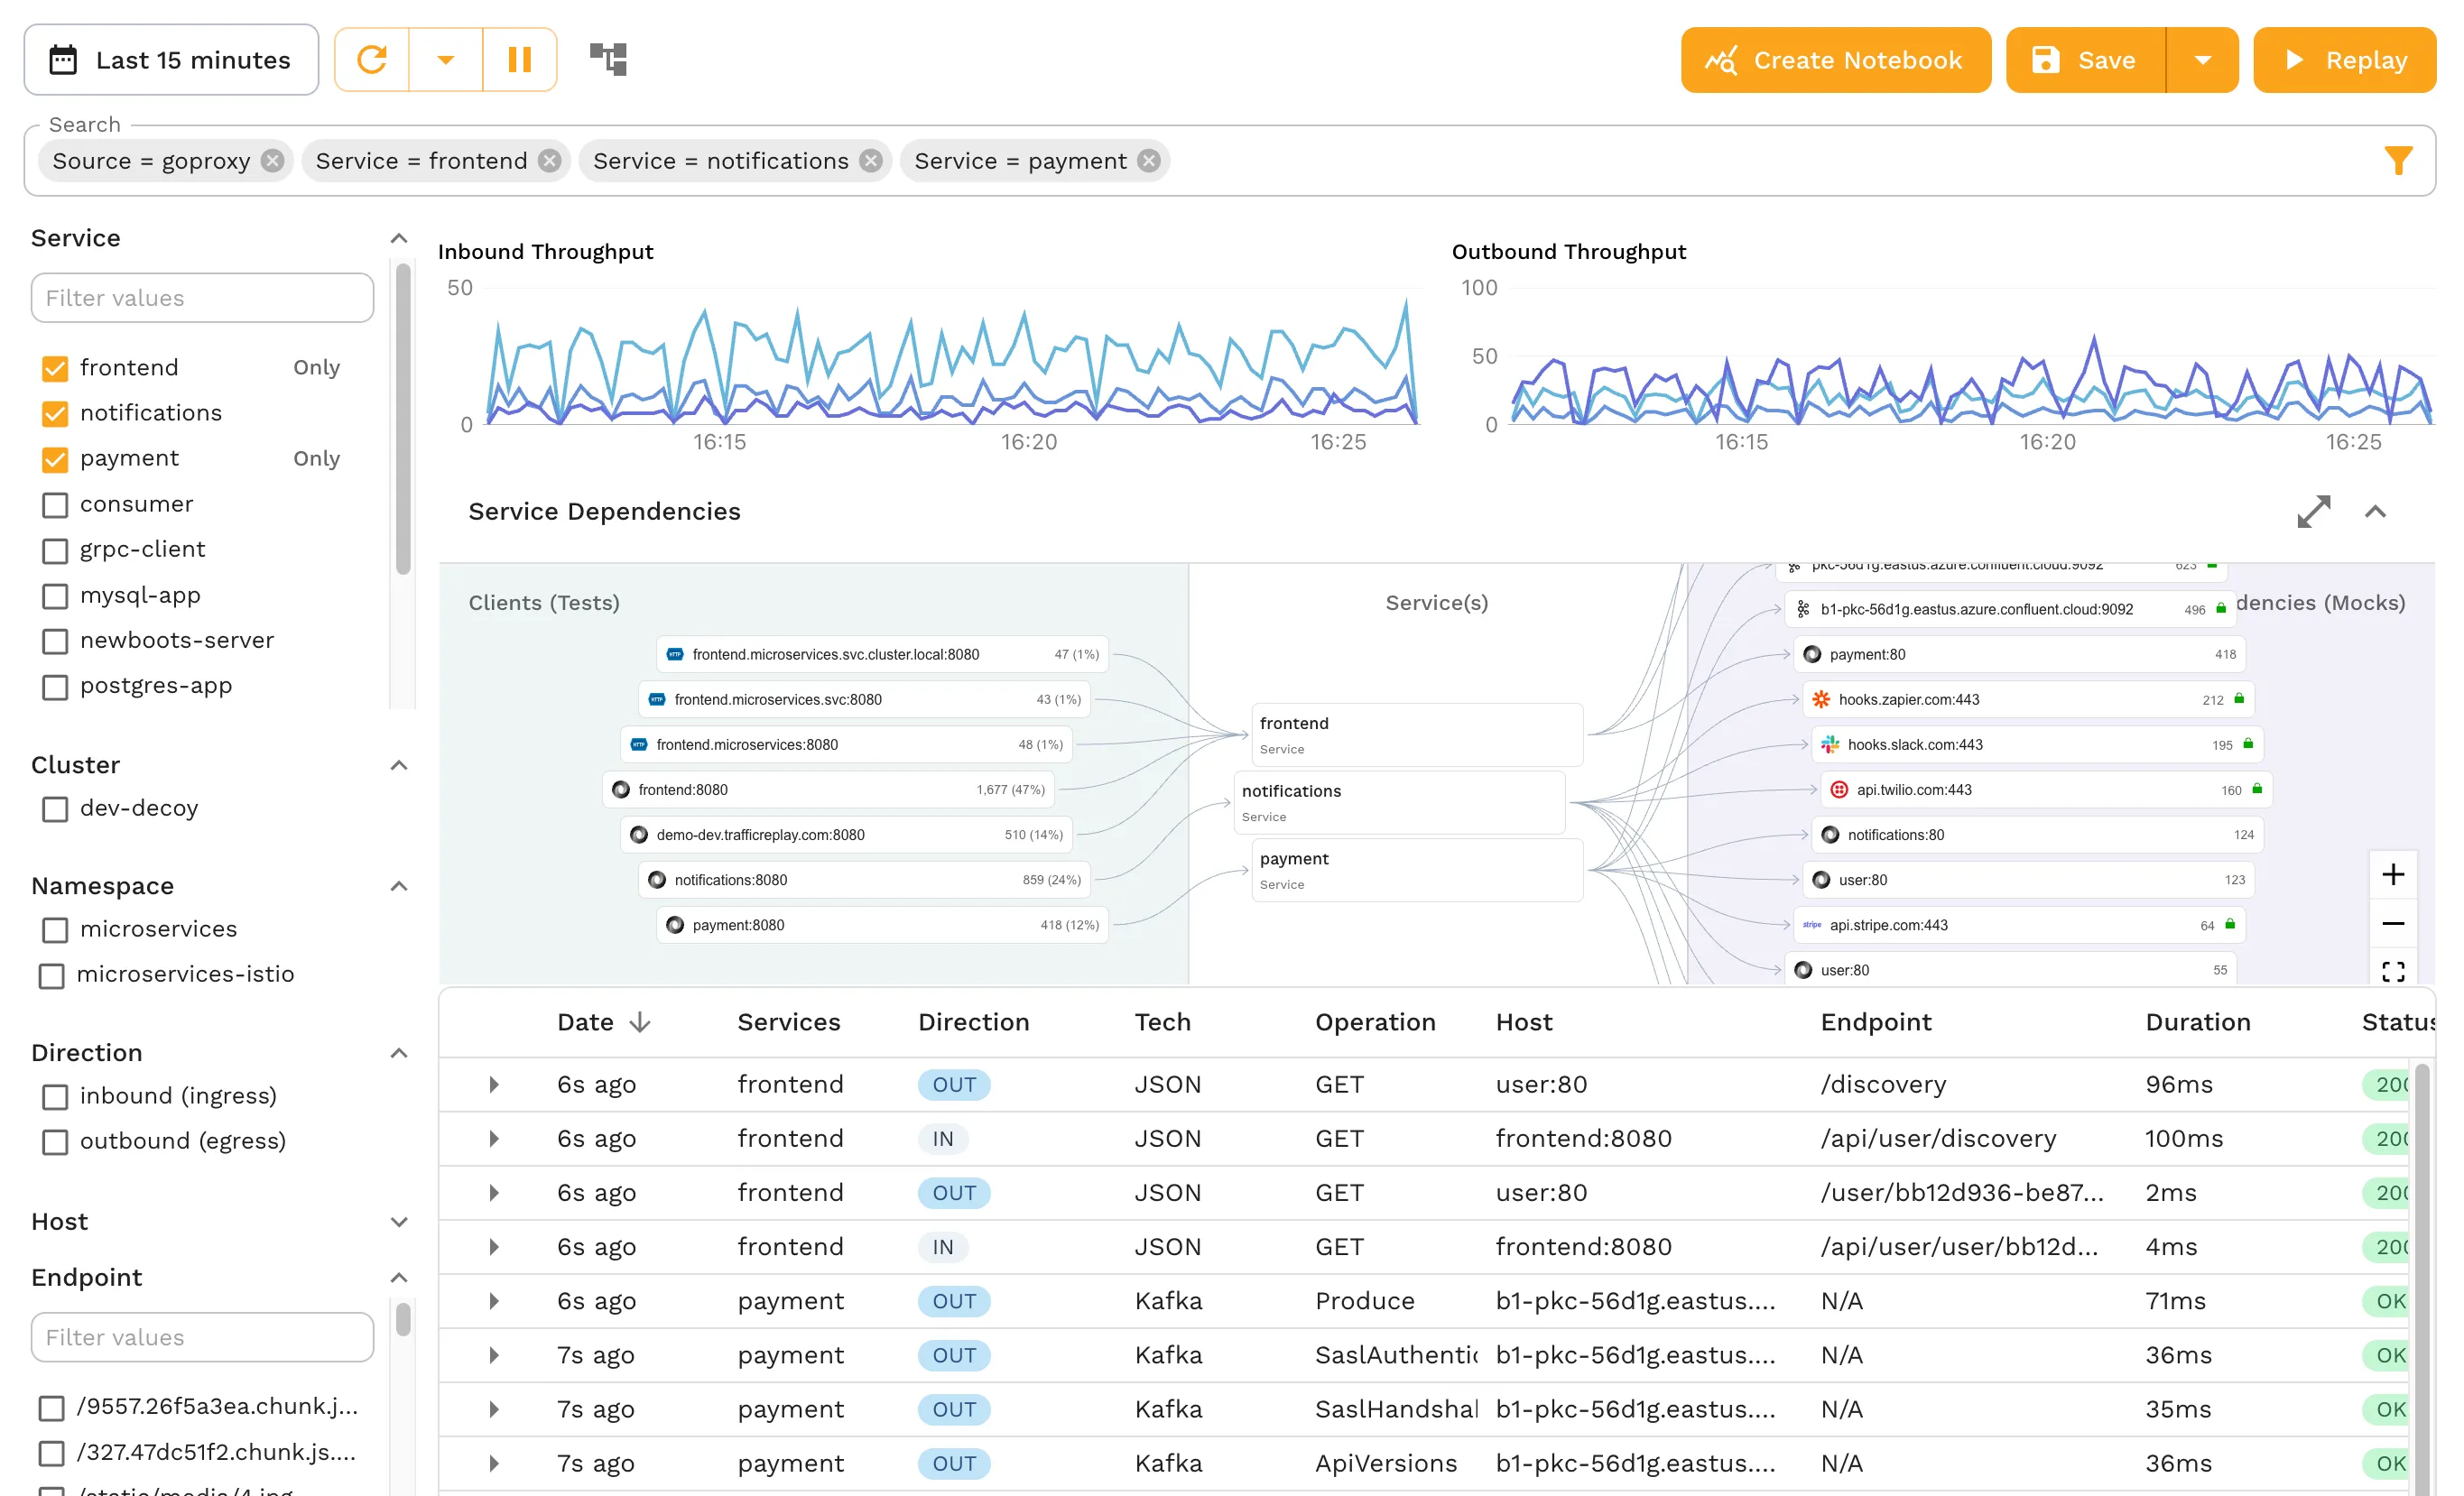
While other platforms predominantly provide chaos experiments at the infrastructure level, Speedscale addresses the API level, with a particular focus on Kubernetes environments. It allows you to test how your applications respond under various conditions, helping you identify and rectify potential issues before they impact your production environment. Some of its key features include:
- Traffic anomaly simulation: Speedscale can simulate various types of network anomalies and issues—such as high latency, packet loss, or bandwidth constraints—via load testing to see how the application copes under adverse conditions.
- Fault injection: You can introduce faults into specific parts of the system (like services and databases) through its service mocking functionality in order to assess the resilience and fault tolerance of your application.
- Automated chaos experiments: Speedscale can automate chaos experiments within your CI/CD pipeline, ensuring continuous evaluation of application resilience.
Experiment Types
Speedscale supports a variety of experiment types for assessing your application’s resilience against network failures. You can simulate different network conditions like latency and packet loss, test your application’s robustness against failures in external services and APIs, and conduct load testing to evaluate performance under high-traffic scenarios. It’s important to note that its experiment types are focused more on application robustness compared to the others, which focus more on the overall infrastructure.
Customization
Speedscale allows users to define specific testing parameters to match their chaos experiments’ unique requirements. The customization options include filters, configuring data loss prevention, and test config.
Integration
Speedscale supports integration with a diverse array of environments. It’s seamlessly compatible with major cloud providers such as AWS and GCP, ensuring flexibility and ease of use in cloud-based environments. Additionally, its design is tailored particularly for Kubernetes, allowing it to integrate effortlessly with a Kubernetes cluster.
Pricing
Speedscale has a free tool called proxymock that can be used for local development workflows. For customers with more demanding needs who want to capture and replay traffic at scale, there are Pro and Enterprise tiers. The cost depends on the amount of traffic captured and analyzed by the platform.
Support
Speedscale offers comprehensive support through detailed documentation, a user community forum, and dedicated technical assistance from the Speedscale team, depending on your selected plan.
AWS Fault Injection Simulator
AWS Fault Injection Simulator (FIS), released on March 15, 2021, is a fully managed AWS service that supports chaos engineering experiments on a range of AWS services, including Amazon Elastic Kubernetes Service (Amazon EKS). The chaos toolkit is another essential tool for running experiments on AWS workloads, known for its open-source nature and flexibility in managing chaos experiments locally or on AWS. The following are some of its notable features:
- It’s simple to set up: It’s easy to use AWS FIS to get started running experiments on your AWS infrastructure without complex or additional installations. You can use its intuitive UI via the Management Console or CLI and its SDKs for programmatic access.
- It has out-of-the-box access control: AWS FIS has a dedicated identity and access control service that allows you to control the users and resources that should have access to run experiments on your AWS services. Additionally, integrating AWS IAM with AWS FIS for your AWS services enables faster setup compared to external chaos engineering tools, as you avoid the need for extensive access control configuration.
- You can run real-world scenarios: AWS FIS enables you to experiment with real-world scenarios. For instance, you can simulate disruptions (such as loss of power or connectivity interruptions) to AWS services that your application relies on to see how the app would behave.
- It offers fine-grained controls: AWS FIS provides fine-grained control of each service that makes up your system, which is essential when running a chaos engineering experiment on distributed systems. It allows you to perform different experiments based on parameters like the environment, application, tags, and so on. For instance, you can increase RAM usage by ten percent of your instances with the tag “env”:“prod”.
Experiment Types
AWS FIS offers many experimentation types, including the AZ Availability: Power Interruption scenario, pausing Amazon DynamoDB global table replication, simulating InsufficientInstanceCapacity errors in EC2, denying traffic to target subnets, and more. For more information on experiments that you can carry out using AWS FIS, check the AWS FIS actions reference and the AWS FIS scenario library.
Customization
AWS FIS allows you to create tailored fault injection experiments for your specific needs and chaos scenario. You can inject a variety of fault types, such as latency, server errors, API throttling, database outages, and more. You can also scope your experiments due to its fine-grained control features.
Integration
AWS FIS seamlessly and easily integrates with other AWS services within the AWS ecosystem. You can also use Amazon CloudWatch to monitor your AWS FIS experiments on targets and your AWS FIS usage. However, it’s important to note that AWS FIS is difficult to integrate with services outside of the AWS ecosystem, so it’s not ideal for non-AWS-centric environments.
Pricing
The AWS FIS pricing model is pay-as-you-go. You don’t have to pay any fees up front before you can start using it. Currently, its starting price is $0.10 per action-minute. For more information on its current pricing, check the official pricing page.
Support
AWS FIS is a fully managed AWS service. It also has a large community; you can look for support in places like the AWS Forum.
LitmusChaos
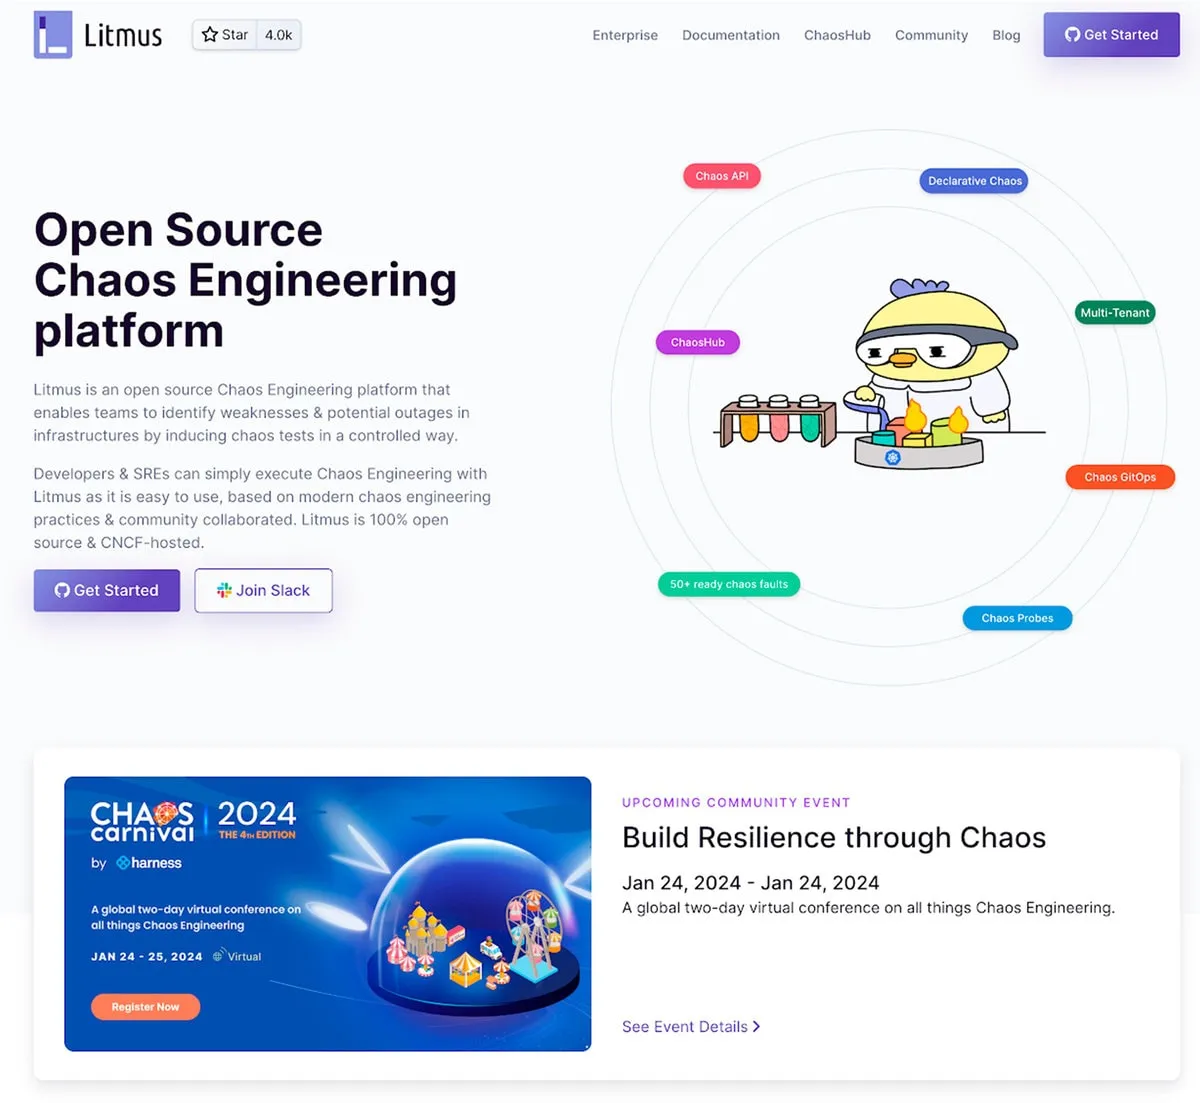
LitmusChaos is a cloud native, open source chaos engineering platform built on Kubernetes. The platform was initially developed by MayaData, with its first public release in 2019. The project, which is now under the Cloud Native Computing Foundation (CNCF), is used by several organizations.
These are some features of LitmusChaos:
- It has a user-friendly dashboard: LitmusChaos has a user-friendly chaos dashboard known as ChaosCenter, which offers an intuitive interface to manage various features of LitmusChaos. You can create chaos experiments, manage user roles and access control, and oversee the overall management of chaos experiments from the dashboard.
- You can run chaos experiments simultaneously: LitmusChaos’s Chaos Experiment, formerly named Chaos Workflow, enables you to execute various experiments simultaneously, either sequentially or in parallel, to simulate a chaos scenario that might occur in a production environment.
- It offers a central marketplace for chaos experiments: LitmusChaos provides a marketplace called ChaosHub, which hosts different open source LitmusChaos experiments that you can use for your chaos experiments. These experiments are ready for use, and you can fine-tune them to fit your use case.
- Resilience probes: LitmusChaos provides resilience probes that can be used to check the health of the system at different times of your experiment.
- Resiliency scores: LitmusChaos provides a resiliency score for a given experiment to measure the resiliency of the system.
Experiment Types
LitmusChaos supports a diverse range of chaos experiments, categorized into Kubernetes, Spring Boot, and cloud infrastructure. Kubernetes experiments include specific pod and node failures like container kill, disk fill, and node CPU hog. For Spring Boot applications, experiments focus on app kill, CPU, and memory stress. Cloud infrastructure experiments cover AWS (eg EC2 stop, EBS loss), VMware, Azure (eg instance stop, disk loss), and GCP (eg VM instance stop, disk loss). All in all, LitmusChaos provides comprehensive open source chaos engineering capabilities across various environments and platforms.
Customization
As LitmusChaos uses Kubernetes custom resource definitions (CRDs) to create chaos experiments, you can tailor your experiments to your specific requirements. The combination of Kubernetes CRDs, ConfigMaps, and secrets further expands the possibilities for different customizations for your chaos experiments.
Integration
LitmusChaos seamlessly integrates with the cloud technologies you are already familiar with, especially those supporting Kubernetes, including major platforms like AWS, Azure, and GCP. In addition to this, it offers integration with prominent monitoring tools such as Prometheus and Grafana, enhancing its functionality and providing a powerful chaos engineering solution in your existing cloud and monitoring ecosystem.
Pricing
LitmusChaos is an open source platform, and it is free to use. However, you can opt in for enterprise support provided by Harness at $200 per service per month.
Support
LitmusChaos is an open source platform under the CNCF project. It has a large amount of support from the LitmusChaos open source community. You can join the Litmus Slack workspace to get support from other users using LitmusChaos in their projects. Furthermore, as mentioned, Harness provides enterprise support when you are subscribed to its Enterprise Plan. It also has comprehensive documentation with resources to assist you with running experiments, hence improving the developer experience.
Gremlin

Gremlin was founded by Kolton Andrus and Matthew Fornaciari in January 2016 and is the first company to offer a failure-as-a-service platform. Prior to 2016, Kolton Andrus designed a failure injection service while working for Amazon and Netflix. Gremlin empowers engineers to develop resilient systems through safe experimentation via a failure injection.
With Gremlin, you can:
- Proactively run chaos experiments using GameDay: Gremlin provides a feature out-of-the-box called GameDay that allows you to organize and prepare chaos experiments, execute them, learn from the results, and create tickets after an experiment is completed.
- Perform health checks: Gremlin health checks allow you to check the state of your systems at the beginning of, during, and at the end of an experiment test to ensure that they are operating as expected. You can configure the health check with most of the popular observation tools, including Datadog, Prometheus, and Grafana Cloud.
- Run multiple experiments: Gremlin allows you to run multiple experiments in series or simultaneously to simulate real-world scenarios or recreate a recent outage. Gremlin refers to this feature as Scenarios. Furthermore, Gremlin provides predefined scenarios that you can use as examples to create your own custom scenarios.
- Schedule experiments: You can use the Gremlin dashboard or APIs to schedule your experiments to run at a certain time.
Experiment Types
Gremlin supports many experiment types, including resource, network, and state experiments. These experiments can be executed on various cloud host technologies, such as Kubernetes, VMs (Linux and Windows), and container runtimes (Docker, CRI-O, containerd, and so on). Additionally, the experiments can be run on cloud platforms that provide Linux and Windows VMs, such as GCP, AWS, and Azure.
Customization
Gremlin allows you to customize your attacks based on your specific needs and scenarios. You can tailor the length of the experiment; target specific hosts, services, and ports; and adjust the severity of the attack. As mentioned, you can also schedule the experiment.
Integration
Gremlin integrates with many of the popular technologies you already use. For instance, it integrates seamlessly with AWS, Azure, and GCP virtual machines. Furthermore, on the monitoring side, Gremlin works well with numerous observability tools, including Datadog, New Relic, Prometheus, Grafana, and others.
Pricing
Gremlin requires a commercial license, the cost of which is not stated on its website. However, there is a free thirty-day trial that does not require a credit card, allowing you to test the service.
Support
Gremlin offers support through its dedicated customer support channel, and you can also receive assistance from its Slack community.
Chaos Monkey
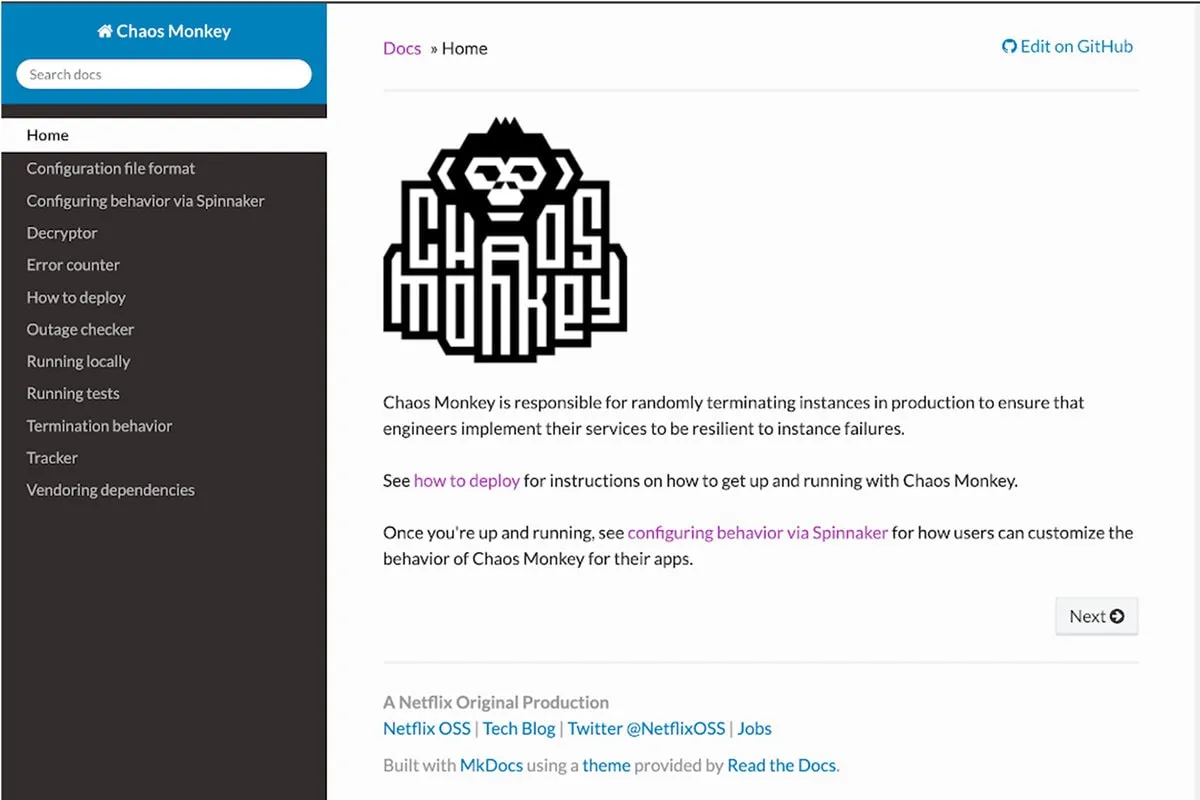
Chaos Monkey was developed by engineers at Netflix in 2010 to test the resiliency of their system. This was the same year Netflix embraced cloud architecture and migrated its systems to the cloud. Chaos Monkey played a pioneering role in the development of chaos engineering. By randomly terminating virtual machine instances during testing, it creates unpredictable failures to assess system resilience and reliability. Subsequently, in 2012, Chaos Monkey was released as an open source project under the Apache 2.0 License. However, as of the time of writing, it is no longer actively maintained.
Chaos Monkey offers the following features:
- Random termination of instances of your application or virtual machines: This is the only experiment type that Chaos Monkey provides. It randomly terminates instances of your application or virtual machines within a configured time frame that you specify.
- An error counter: Chaos Monkey records the rate of errors, but you will need to modify the code if you want to send the error counts to an external observation tool.
- An outage checker: This feature automatically disables Chaos Monkey if there is an outage in your system.
- A tracker: Chaos Monkey offers a tracker that can be used to record the termination of events.
Experiment Types
As mentioned, Chaos Monkey only supports randomly terminating instances of your application or virtual machines.
Customization
Chaos Monkey lacks any sort of built-in customization. If you want to customize it, you’ll have to modify the code.
Integration
Chaos Monkey integrates with Spinnaker to take advantage of its Deck web interface and MySQL database to store data.
Pricing
Chaos Monkey is free to use.
Support
As this tool is no longer maintained, there is a smaller community of support. You can get support from communities such as Stack Overflow.
ChaosBlade
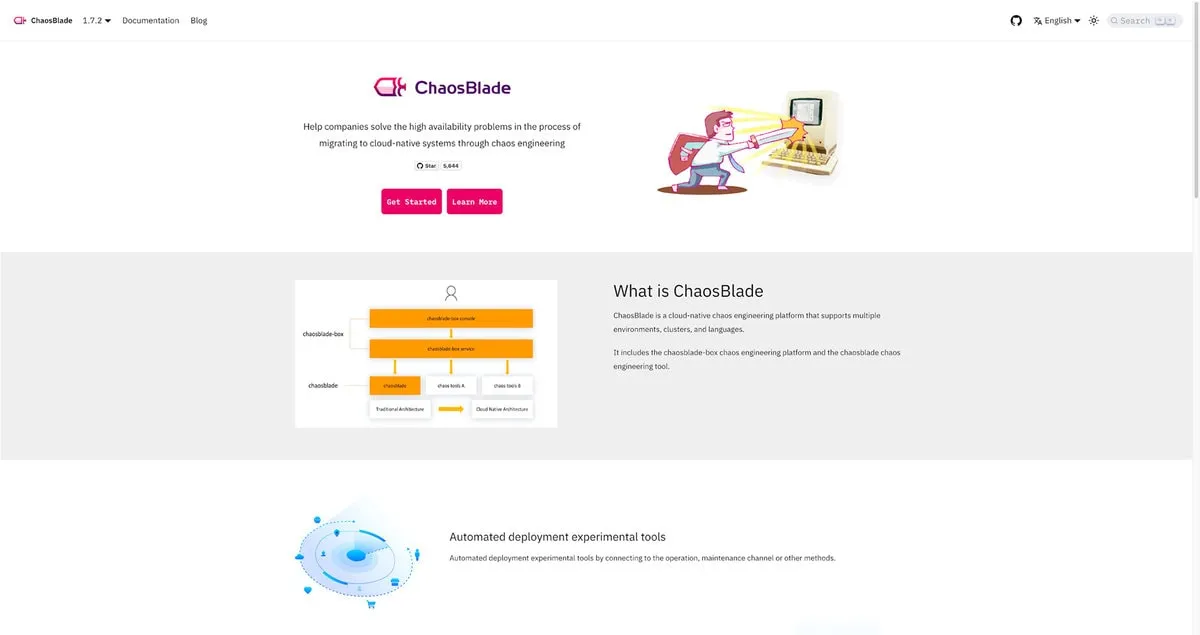
ChaosBlade is another open source, cloud native chaos engineering platform created by Alibaba in 2019. The platform supports four different programming languages (Java, Golang, C++, and Node.js), more than 200 experimental scenarios, and over 3,000 experimental parameters. It’s important to note that while ChaosBlade is widely used by prominent companies like China Mobile and Xiaomi, its English documentation isn’t completely translated from Chinese.
With ChaosBlade, you can:
- Run chaos experiments on multiple environments: You can run experiments on virtual machines, Kubernetes, or your application directly.
- Use a variety of chaos experiment types: Experiment types include CPU, memory, and network experiments.
- Run chaos experiments via the command line interface: ChaosBlade doesn’t only allow you to configure and run experiment types through a visual interface. It also allows you to execute them via the command line and provides easy-to-use CLI commands.
Experiment Types
Similar to LitmusChaos, ChaosBlade supports a diverse range of chaos experiments, categorized into physical host experiments, Kubernetes experiments, and application experiments. So, you have a variety of attack target options when using ChaosBlade for your chaos experiments.
Customization
ChaosBlade enables you to customize your experiments for specific needs. It offers adjustable durations for assessing both short-term effects and extensive stress tests. You can target specific hosts, services, or ports to pinpoint vulnerability checks. The disruption severity is also adjustable, allowing for different stress level assessments. Plus, you can schedule experiments to minimize operational disruptions, balancing testing thoroughness with operational stability.
Integration
ChaosBlade supports deployment across multiple environments, including Linux, Docker, Kubernetes clusters, and various cloud vendor environments. You can also integrate Prometheus and Grafana in order to monitor your experiments.
Pricing
ChaosBlade is an open source platform similar to LitmusChaos and is free to use.
Support
ChaosBlade is an open source platform under the CNCF project. Hence, the best source of support is the open source community. Additionally, you can join the ChaosBlade Slack workspace and Gitter to get support.
Azure Chaos Studio
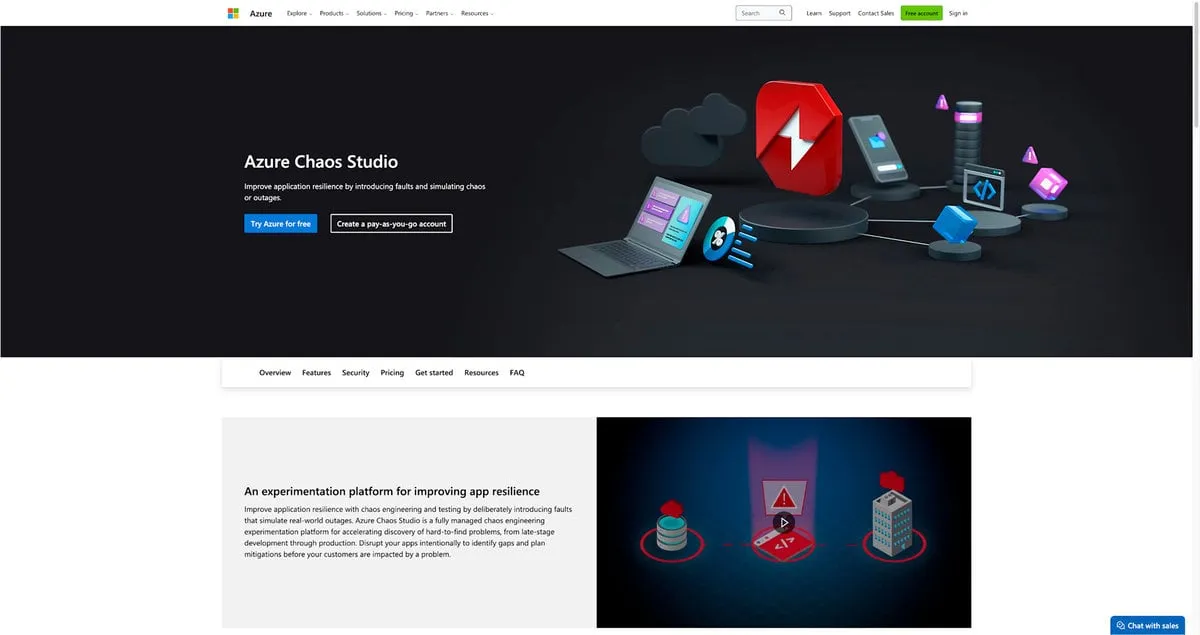
In November 2021, Microsoft released its first public preview of Azure Chaos Studio. With Azure Chaos Studio, you can practice chaos experiments on your Azure services and simulate real-world outages that could occur in production.
It allows you to do the following:
- Set permissions and security: Azure Chaos Studio has a comprehensive permissions model that controls who can create, execute, and manage chaos experiments. This ensures that chaos experiments are not run unintentionally or by a malicious person.
- Schedule an experiment: Azure Chaos Studio’s scheduling functionality allows you to plan and execute chaos experiments at scheduled times. This is particularly useful for automating chaos tests to occur during specific operational periods, like low-traffic hours, to minimize potential disruptions.
- Run experiments programmatically: Azure Chaos Studio extends its capabilities beyond the GUI, offering APIs for programmatically conducting chaos experiments. This includes REST APIs and SDKs for popular programming languages like Python, .NET, and JavaScript. You can easily integrate chaos experiments into existing development workflows and initiate, monitor, and analyze experiments from within the development environment or CI/CD pipelines.
Experiment Types
Azure Chaos Studio provides over thirty experiment types that you can use to run your chaos experiments. These experiments cover a wide range of potential disruptions, from infrastructure failures to network latency, enabling you to thoroughly test the resilience of your systems.
Customization
You can customize your chaos experiments by defining specific parameters or conditions under which a fault should occur, thus obtaining a more tailored and relevant test environment for your specific use case.
Integration
Azure Chaos Studio has seamless integration capabilities within the Azure ecosystem, which enhances its utility and effectiveness. For instance, you can use Azure Monitor to track and analyze the impact of chaos experiments on your Azure services. While Azure Chaos Studio is user-friendly, it requires a certain level of understanding of Azure services.
Pricing
Azure Chaos Studio pricing model is pay-as-you-go. You don’t have to pay anything before you start using it. Currently, its starting price is $0.10 per action-minute. For more information on its current pricing, check the official pricing page.
Support
Azure Chaos Studio is a fully managed service supported by Azure’s robust support infrastructure. Additionally, it benefits from a large, active community that provides an additional layer of support and shared knowledge.
The Complete Traffic Replay Tutorial
Steadybit
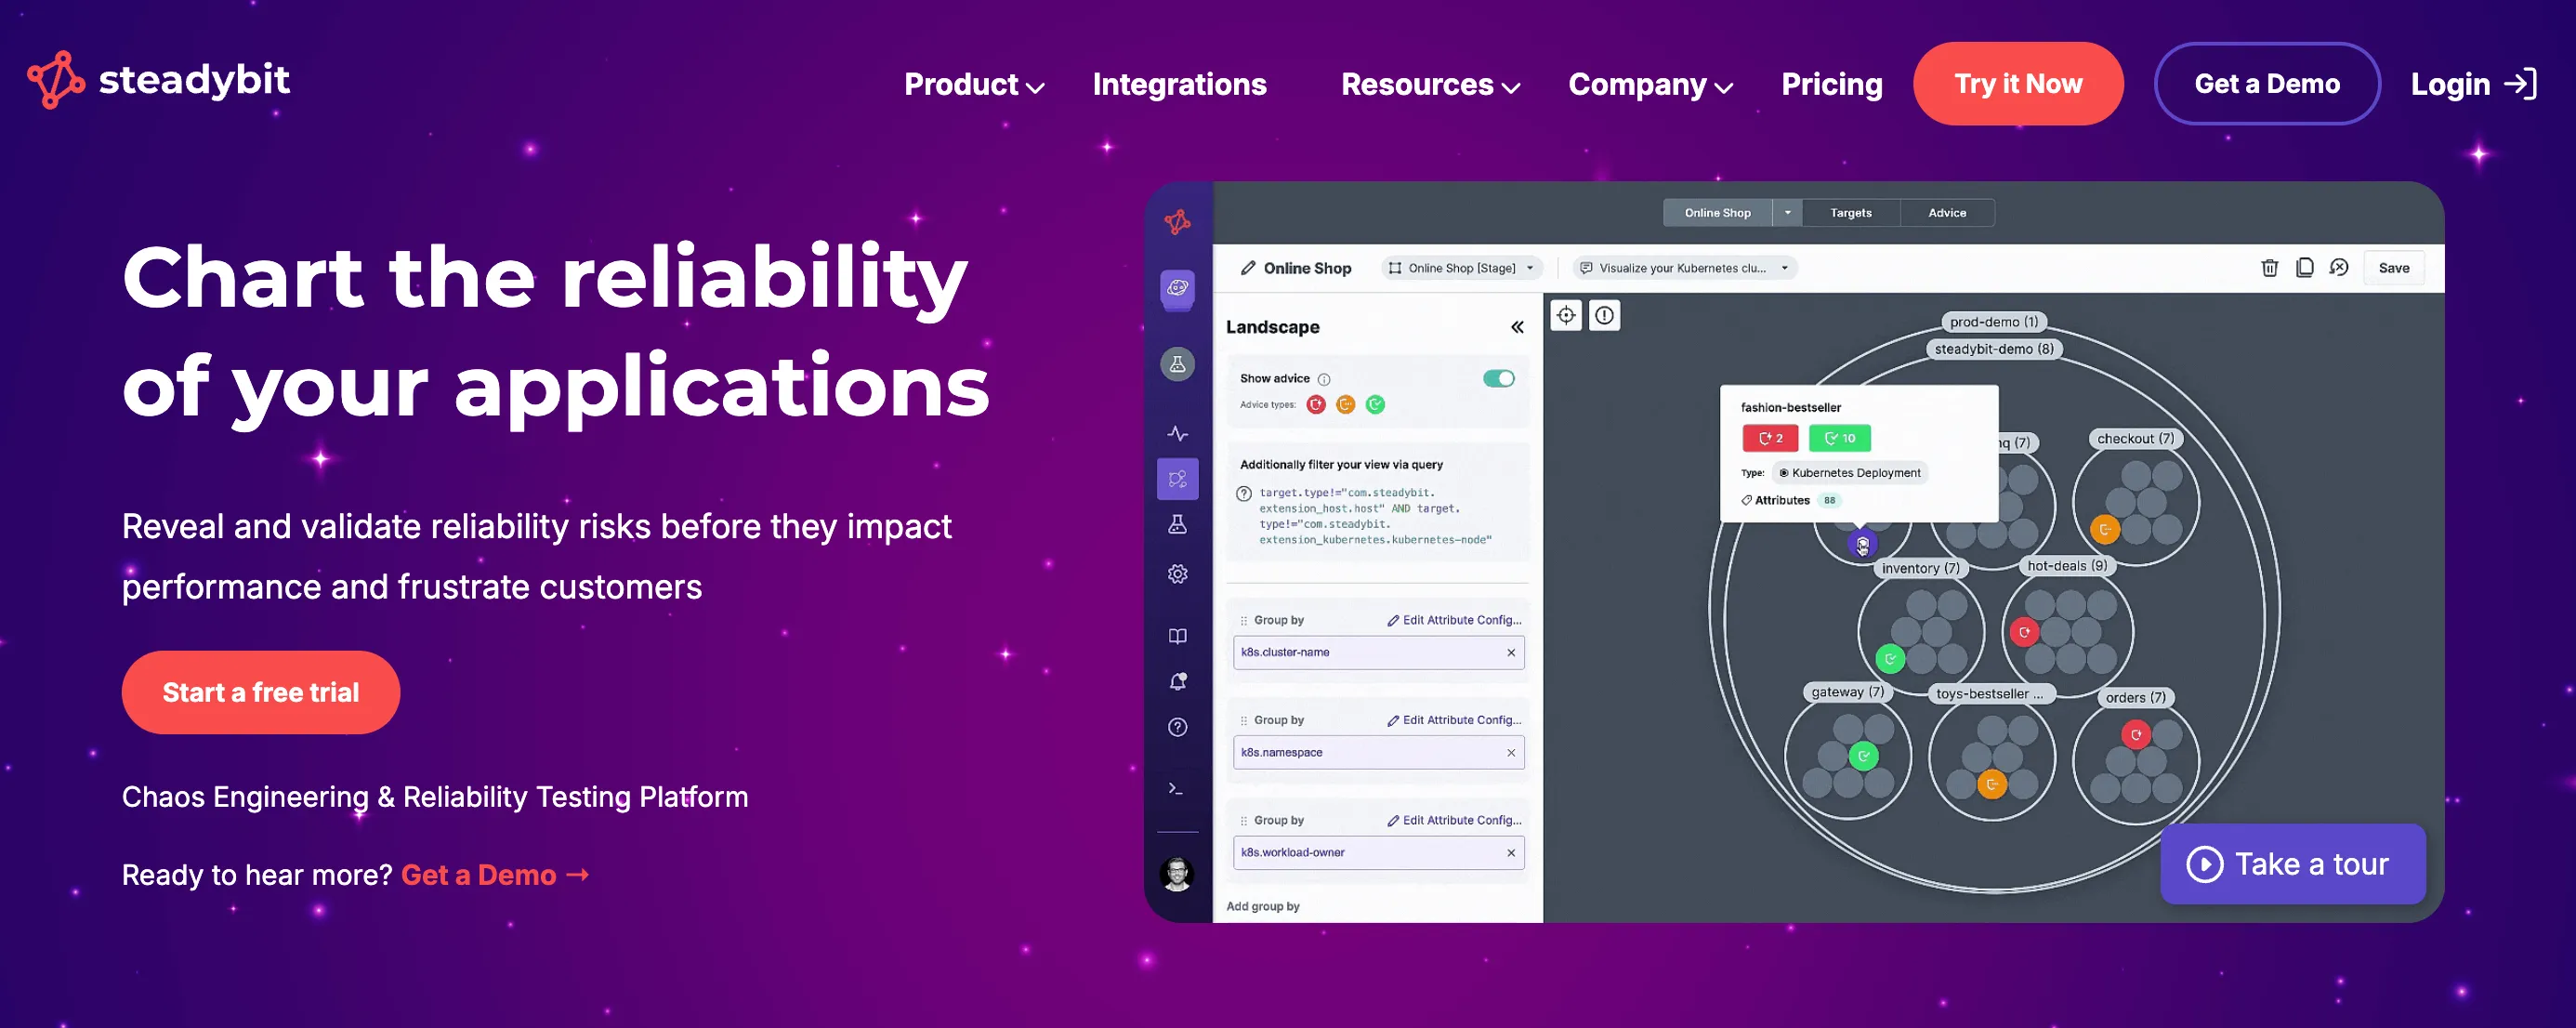
Steadybit is a commercial chaos engineering tool that aims to build remediation into its experiments. It provides a range of features, including:
-
Resilience policies: Steadybit uses declarative rules to evaluate your systems during an experiment. These resilience policies help ensure that your systems meet predefined standards of reliability and performance.
-
Automatic safety mechanisms: The tool integrates with monitoring and observability tools to provide automatic safety mechanisms. This ensures that experiments are conducted safely and that any adverse effects are promptly detected and mitigated.
-
Support for a wide range of failure types: Steadybit supports various failure types, including resource failures (e.g., CPU, memory), network failures (e.g., latency, packet loss), and state failures (e.g., service crashes). This comprehensive support allows for thorough testing of system resilience.
-
Integration with specific infrastructure: Steadybit integrates with Docker, Kubernetes, and Linux hosts, making it versatile and suitable for different environments. This integration ensures that chaos experiments can be conducted in realistic settings.
-
Automation capabilities: The tool offers automation features, allowing you to run experiments on a schedule or in response to specific events. This ensures continuous testing and helps maintain system resilience over time.
Steadybit is a powerful tool that can help organizations build more resilient systems. However, it may have a steep learning curve, and teams may need to already know what experiments to run, what to test for, and how to interpret the results. Despite this, its comprehensive features and integration capabilities make it a valuable addition to any chaos engineering toolkit.
Conclusion
Choosing the appropriate chaos engineering platform tailored to your specific needs is crucial in order to achieve your desired outcomes. This article provided a comprehensive comparison of seven popular, powerful chaos engineering platforms, discussing their key features, supported environments, cost considerations, and examples of potential experiments. With this information at your disposal, you are well equipped to make an informed decision about the chaos engineering platform that best suits your unique requirements. It’s essential to thoroughly understand your use case to ensure you choose the most fitting platform for your needs.
