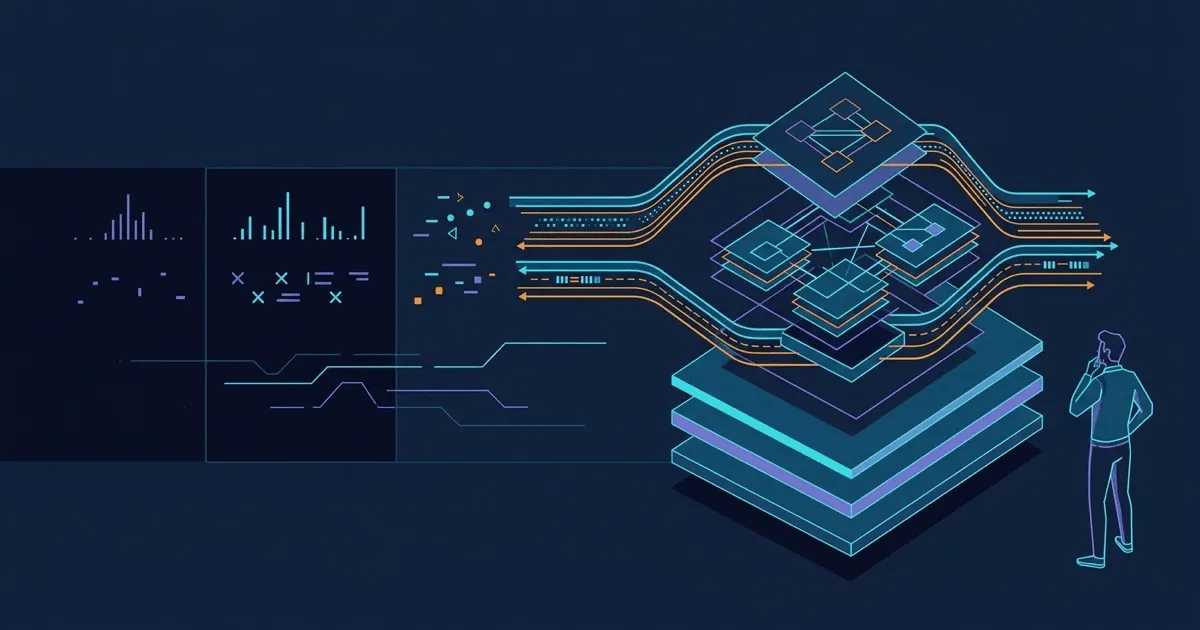
A metric says latency increased. A log says a request failed. A trace identifies the slow dependency. An APM agent points to the method. Manual instrumentation explains the business operation. Traffic capture shows the exact request and response that triggered it.
Each layer answers a question the previous layer could not. Each also introduces a new cost, blind spot, and failure mode.
- Instrumentation technologies are not interchangeable. They observe different layers of the system and answer different questions.
- Greater data fidelity creates greater operational and security responsibility. Full payloads are useful, expensive, and sensitive.
- The strongest collection strategy combines several techniques instead of asking one collector to explain everything.
Visibility grows in layers
The industry tends to put eBPF, sidecars, OpenTelemetry, log agents, APM agents, and proxies on the same comparison slide. That is convenient, but technically wrong.
eBPF is a kernel capability. A sidecar is a deployment pattern. OpenTelemetry is a set of APIs, SDKs, semantic conventions, and protocols. Fluent Bit is a telemetry pipeline. An APM agent instruments a runtime. A proxy observes traffic from the network path.
They overlap, but they are not substitutes. An OpenTelemetry Collector can run as a sidecar or a node agent. An eBPF program can produce OpenTelemetry data. A sidecar can contain a MITM proxy. The useful comparison is not the product category. It is the evidence each approach can collect.
This gives us a visibility ladder:
- Infrastructure metrics show system health.
- Logs describe events the application chose to report.
- Automatic APM connects work across common frameworks.
- Manual instrumentation adds business intent.
- eBPF observes behavior below the application.
- Traffic capture records what systems actually exchanged.
Moving down the ladder increases fidelity. It does not automatically increase understanding. A request body can show what happened while a custom span explains why the application did it.
flowchart LR
    Metrics["Metrics<br/>System health"] --> Logs["Logs<br/>Reported events"]
    Logs --> APM["APM<br/>Request causality"]
    APM --> OTel["Manual OTel<br/>Business intent"]
    OTel --> EBPF["eBPF<br/>System behavior"]
    EBPF --> Traffic["Traffic<br/>Exact exchange"]
The comparison at a glance
| Technology | Strongest visibility | Primary blind spot | Main operational tradeoff | Best use |
|---|---|---|---|---|
| Telemetry agents | Emitted logs, metrics, and traces | Missing application context | Backpressure and another fleet to operate | Collection and routing |
| Automatic APM agents | Framework calls and request paths | Business intent and unsupported code | Runtime injection and compatibility | Broad application diagnosis |
| Manual OpenTelemetry | Code and business semantics | Uninstrumented behavior | Engineering maintenance | Workflow debugging and domain SLOs |
| Kubernetes sidecars | Workload-local collection or interception | Depends on the component inside | Per-pod resources and lifecycle | Isolation and local policy |
| eBPF | Kernel, process, network, and profiling data | Business meaning and some encrypted data | Host access and kernel dependencies | Fleet-wide system visibility |
| MITM proxies | Application-layer requests and responses | Internal application decisions | In-path risk and sensitive payloads | API debugging, analytics, and testing |
Agents move the signals
Agents such as Fluent Bit, Vector, Filebeat, and the OpenTelemetry Collector usually begin with data that already exists. They tail logs, scrape endpoints, receive OTLP, enrich records with Kubernetes metadata, buffer data, and route it to one or more backends.
Fluent Bit describes its pipeline as inputs, filters, and outputs. That is the right mental model. The agent moves and transforms evidence. It does not know that a failed POST /checkout represents a lost order unless something upstream records that meaning.
Compared with direct application export, agents provide a control point for batching, redaction, credentials, retries, and vendor routing. Compared with APM or manual instrumentation, they provide little new application context.
The upside is broad signal support and a central place for filtering, enrichment, buffering, and routing. Agents also separate applications from backend credentials and work well in multi-backend or restricted-egress environments.
The tradeoff is another fleet to operate. An agent cannot recover context the application never generated. It can also become a throughput bottleneck, and overload or a backend failure may cause data loss.
That last point matters. The OpenTelemetry Collector troubleshooting guide identifies undersizing and slow or unavailable destinations as common causes of dropped telemetry. Your collection layer is production infrastructure, even when it is not in the request path.
APM adds causality
Automatic APM agents move the observation point inside the runtime. New Relic, Dynatrace, and OpenTelemetry zero-code instrumentation hook supported web frameworks, database clients, queues, and RPC libraries. They can build a distributed trace without asking every team to add spans by hand.
Compared with a log agent, an APM agent creates new evidence. It can connect an inbound HTTP request to a database query and an outbound queue operation. Compared with manual instrumentation, it sees common technical boundaries but rarely understands business intent.
OpenTelemetry calls this edge visibility: automatic instrumentation typically covers requests, database calls, and messaging libraries rather than arbitrary application code. New Relic similarly documents its built-in Java framework and library instrumentation. Dynatrace uses injected code modules for deep application monitoring.
The upside is fast, consistent coverage across a large application estate. Distributed traces, service maps, query timings, and framework timings provide a strong starting point for dependency analysis without editing every repository.
The tradeoff sits at the runtime boundary. Coverage depends on supported languages, versions, and libraries. Injection can affect startup and compatibility, while custom detail may pull teams toward vendor-specific APIs. Even a technically complete trace can miss why a business operation failed.
APM tells an SRE where the time went. It does not necessarily tell a software engineer why the code chose that path.
Manual instrumentation adds intent
Only application code knows that a database transaction represents an inventory reservation, that a policy engine rejected a transfer, or that a model response failed a safety check.
Manual instrumentation records those concepts directly. OpenTelemetry APIs and SDKs let developers add custom spans, events, metrics, and attributes while retaining a vendor-neutral data model. The OpenTelemetry instrumentation guidance explicitly treats code-based and zero-code instrumentation as complementary.
Compared with automatic APM, manual instrumentation trades breadth for meaning. Compared with logs, spans preserve causal context across a request. Compared with traffic capture, manual instrumentation exposes internal decisions that never cross the network.
The upside is the richest business and application context. Developers control the names, attributes, and event boundaries, then correlate that detail with traces generated automatically. This makes manual instrumentation the best source for domain-specific SLOs and workflow debugging.
The tradeoff is ownership. Instrumentation requires code changes, conventions drift between teams, and refactors can silently invalidate old assumptions. High-cardinality attributes also create cost, performance, and privacy risks.
Prometheus provides a useful warning: every unique label set creates another time series. User IDs, email addresses, request IDs, and other unbounded values belong in logs, traces, or analytics systems, not metric labels.
Sidecars change the placement
A Kubernetes sidecar is not a signal or collection mechanism. It is a place to run one.
The Kubernetes definition is deliberately broad: a sidecar extends the primary application and shares its network and potentially its storage. The sidecar might contain an OpenTelemetry Collector, a log processor, an APM component, a service-mesh proxy, or a traffic recorder.
Compared with an embedded SDK, a sidecar can be managed separately from application code. Compared with a node agent, it offers clearer workload ownership and isolation. The cost is repetition. Every pod receives another container, another resource request, another configuration, and another lifecycle to manage.
The upside is proximity without sharing the application process. Sidecars offer natural workload attribution, per-pod configuration, shared networking, and a useful option when cluster policy prohibits node-wide access.
The tradeoff grows with pod count. CPU and memory repeat per workload, injection complicates rollouts, and failures can become coupled to the application. An inline sidecar proxy also adds a network hop and enters the request path.
Sidecars should therefore be compared with DaemonSets, gateways, and embedded libraries as deployment choices. Whether they provide metrics, traces, or full payloads depends entirely on what runs inside them.
flowchart TD
    subgraph Pod["Application pod"]
        App["Application"] --> SDK["Embedded SDK"]
        App -. "local export" .-> Sidecar["Sidecar collector"]
        SDK --> Sidecar
    end
    App -. "node logs" .-> Node["Node agent"]
    Sidecar --> Gateway["Collector gateway"]
    Node --> Gateway
    Gateway --> Backend["Telemetry backends"]
eBPF goes below the application
eBPF moves observation into the Linux kernel and, in some implementations, into userspace libraries through uprobes. It can observe network connections, syscalls, scheduling, process behavior, and profiling data without changing every application repository.
Compared with manual instrumentation, eBPF offers far wider coverage and much weaker business meaning. Compared with automatic APM, it depends less on framework hooks but more on kernels, symbols, runtimes, and system capabilities. Compared with sidecars, a node-level DaemonSet can cover many workloads without adding a container to every pod.
The upside is broad coverage for unknown, third-party, and legacy workloads without source changes. A single node collector can produce strong network, process, syscall, and profiling evidence for many workloads.
The tradeoff moves into the host. Kernel version, architecture, BTF, and Linux capabilities matter. Elevated access expands the security review, business context remains weak, and TLS visibility or distributed context propagation varies by implementation.
The TLS caveat is easy to miss. eBPF does not magically make encryption disappear. Tools may attach uprobes before encryption or after decryption, but support depends on the language and TLS library. OpenTelemetry’s eBPF instrumentation documents kernel and context-propagation limitations, including cases where L7 proxies disrupt network-level propagation.
Speedscale provides a concrete example. Its eBPF traffic collector combines kernel probes with runtime-specific TLS capture mechanisms. That expands payload visibility without a proxy sidecar, but it still has explicit kernel, permission, runtime, and TLS-library requirements.
Proxies expose the conversation
A proxy observes the application protocol boundary. A forward proxy sees outbound calls. A reverse proxy sees inbound calls. A transparent or service-mesh proxy redirects traffic without requiring every client to select it explicitly. A MITM proxy terminates and re-establishes TLS so it can inspect encrypted application data.
Compared with a trace, a proxy can retain the complete request and response rather than selected attributes. Compared with eBPF, protocol parsing and TLS termination can provide predictable payload visibility across supported clients, but the proxy becomes part of the network path. Compared with manual instrumentation, it shows actual inputs and outputs but not internal decisions.
The upside is full request and response visibility that is largely independent of application language. That makes proxies useful for protocol debugging, contract discovery, dependency simulation, analytics, and traffic replay.
The tradeoff is that inline deployment can affect latency and availability. TLS interception requires certificate trust, certificate pinning may prevent capture, and full payloads can expose credentials, personal data, or customer content. Storing that data is also expensive.
The mitmproxy certificate documentation explains both the generated certificate chain and the limitation imposed by certificate pinning. These are architectural constraints, not setup trivia.
Traffic visibility also creates a capability that normal observability does not: reuse. A trace can tell you that production failed. A captured interaction can become a test case, a mock response, or a load-test input. This is where tools such as Speedscale move collection beyond diagnosis and into traffic replay.
Match the evidence to the job
The deepest collection method is rarely the correct default for every workload.
| Engineering job | Start with | Add when necessary |
|---|---|---|
| SLOs and alerting | Stable aggregate metrics | Traces for exemplars and diagnosis |
| Incident timelines | Metrics and structured logs | APM traces and deployment context |
| Dependency latency | Automatic APM | Manual spans around critical operations |
| Business workflow debugging | Manual instrumentation | Payload capture for exact inputs and outputs |
| Unknown or legacy workloads | eBPF or automatic agents | Targeted code instrumentation |
| Performance analysis | APM and profiles | eBPF for kernel and scheduler behavior |
| Security investigation | Audit logs and process telemetry | Network and payload evidence under strict controls |
| API debugging | Traces and proxy capture | Manual spans for internal decisions |
| Regression and integration testing | Traffic capture and replay | Semantic assertions from application instrumentation |
| Product analytics | Structured events | Traffic data only with deliberate consent and governance |
The pattern is consistent. Start with compact signals. Add causal context. Add business meaning. Reach for full payloads when exact behavior matters.
flowchart TD
    Question["What must you know?"] --> Signal{"Evidence needed"}
    Signal --> Health["System health"] --> Metrics["Metrics"]
    Signal --> Cause["Request causality"] --> Traces["APM and traces"]
    Signal --> Intent["Business intent"] --> Manual["Manual OTel"]
    Signal --> Behavior["System behavior"] --> Kernel["eBPF"]
    Signal --> Exchange["Exact exchange"] --> Proxy["Traffic capture"]
More visibility means more responsibility
Every layer changes the system somewhere.
Metrics consume CPU and create time series. Log agents buffer memory and disk. APM agents modify runtime behavior. Sidecars consume pod resources. eBPF programs execute on kernel and syscall paths. Proxies add a hop and may terminate connections.
The data also becomes more sensitive as visibility increases. Infrastructure metrics usually contain aggregates. Logs and traces may contain identifiers. Runtime instrumentation can expose queries and code paths. Traffic capture can contain authorization headers, personal data, proprietary payloads, and entire customer interactions.
Collection architecture therefore needs its own controls:
- Targeting and sampling
- Redaction before export
- Encryption in transit and at rest
- Regional processing and retention rules
- Backpressure and failure behavior
- Access auditing
- Health metrics for the collectors themselves
There is no invisible collector. There is only overhead and risk that has been measured, bounded, and accepted.
Build a layered visibility stack
A practical default is deliberately uneven.
Use infrastructure metrics and telemetry agents everywhere. Add automatic APM where runtime support is mature. Instrument the business-critical paths by hand. Use eBPF to fill fleet-wide, legacy, and system-level gaps. Enable full traffic capture selectively for debugging, analytics, and testing workflows that need exact requests and responses.
This is not an evolution from an old technology to a new one. It is an evolution from summaries toward evidence.
Start with the cheapest signal that can answer the question. Move deeper only when that signal stops being enough. If exact API behavior is the missing evidence, explore traffic-based API observability and Kubernetes traffic replay, or read the complete guide to traffic replay.