Testing a FastAPI app that calls OpenAI, Anthropic, or Gemini gets expensive fast. The problem is not just the API bill in production. It is all the repeated traffic in development: prompt tweaks, CI runs, regression checks, and the load tests you keep putting off because every run burns tokens.
Hand-written mocks do not help much once the app is doing multi-step LLM work. One request turns into several dependent calls, the later prompts depend on earlier outputs, and pretty soon your “test double” is just a second implementation of the feature.
What you actually want is simpler: run one real request, save the traffic, and reuse it locally and in CI.
Speedscale proxymock takes a straightforward approach. Record one real run from the app you already have, store the request and response pairs as markdown, then use those recordings for local mocks or replay tests. No SDK changes. No custom fake server to maintain.
This walkthrough uses the real llm-simulation-demo, which includes a FastAPI backend, a small tools service, and support for OpenAI, Anthropic, Gemini, and xAI.
The FastAPI Testing Problem: LLM Mocks Don’t Exist
Mocking a REST dependency is usually manageable because the response shape is stable and the payloads are short. LLM traffic is a different problem. In the triage app, the backend looks like this:
# Each ticket triggers 5 outbound calls:
# 1. Order lookup → tools-service
# 2. Policy lookup → tools-service
# 3. Triage call → api.openai.com (or api.anthropic.com, etc.)
# 4. Analysis call → api.openai.com
# 5. Response draft call → api.openai.com

order_tool, policy_tool = await asyncio.gather(
    _call_tool("lookup_order", f"/tools/order/{request.input.ticket_id}"),
    _call_tool("lookup_policy", "/tools/policy/return-policy-v2"),
)

triage_result = await adapter.run(request, context=context)  # 3 sequential LLM calls
The tool lookups are easy enough to stub by hand. The LLM calls are where that falls apart. The analysis step depends on the earlier classification output. The response-drafting step depends on both of those plus the tool data. By the time you try to fake the third call, you are no longer mocking an API so much as recreating the pipeline by hand.
Recording one good run is usually less work and gives you something you can reuse.
flowchart LR
    subgraph Record
        A[FastAPI App] -->|outbound calls| P1[proxymock proxy]
        P1 -->|captures traffic| F1[RRPair files]
        P1 --> C[OpenAI / Anthropic / Gemini]
    end
    subgraph Mock
        B[FastAPI App] -->|outbound calls| P2[proxymock proxy]
        P2 -->|serves responses from| F2[RRPair files]
    end
    subgraph Replay
        F3[RRPair files] -->|inbound requests| P3[proxymock proxy]
        P3 -->|tests against| D[FastAPI App]
    end
    Record --> Mock --> Replay
Install proxymock
macOS (Homebrew):
brew install speedscale/tap/proxymockmacOS/Linux (script):
sh -c "$(curl -Lfs https://downloads.speedscale.com/proxymock/install-proxymock)"Verify:
proxymock versionStep 1: Record Real Traffic
Clone the demo and start the tools service (the internal microservice that provides order and policy data):
git clone https://github.com/speedscale/demo.git
cd demo/llm-simulation-demo

# Terminal 1: Start the tools service (port 8001)
cd tools-service
python -m venv .venv && source .venv/bin/activate
pip install -r requirements.txt
uvicorn app.main:app --host 127.0.0.1 --port 8001
Now start the backend with proxymock recording:
# Terminal 2: Record the backend (port 8000)
cd backend
python -m venv .venv && source .venv/bin/activate
pip install -r requirements.txt
cp .env.example .env
# Edit .env: set at least one API key (OPENAI_API_KEY, ANTHROPIC_API_KEY, etc.)
# Set TOOL_BASE_URL=http://127.0.0.1:8001

proxymock record --app-port 8000 \
  -- uvicorn app.main:app --host 127.0.0.1 --port 8000
The -- separator tells proxymock where your app command starts. In record mode it starts an outbound proxy on port 4140 for dependencies and an inbound proxy on port 4143 for requests coming into the app. The child process inherits http_proxy and https_proxy, which httpx uses automatically.
You’ll see this on startup:
recording outbound traffic on proxy port 4140
recording inbound traffic sent to port 4143 (forwarded to your app on port 8000)
Paste the following environment variables into your app's terminal to record outbound HTTP-only traffic:
  export http_proxy=http://localhost:4140
  export https_proxy=http://localhost:4140
recorded test / mock files are being written to proxymock/recorded-2026-03-23_17-46-16.052364Z
Press ctrl-c to interrupt

────────────────────────────────────────────────────────────────────────────────────

INFO  started user application  ( command:uvicorn app.main:app --host 127.0.0.1 --port 8000 pid:68511 )
Submit a ticket through the inbound proxy on port 4143:
curl -X POST http://localhost:4143/api/run \
  -H "Content-Type: application/json" \
  -d '{
    "provider": "openai",
    "input": {
      "ticket_id": "INC-4201",
      "customer_tier": "enterprise",
      "transcript": "Our checkout has been down for 6 hours. We have a $47K order stuck and Q4 inventory restock is blocked. 12 users affected."
    }
  }'
Press Ctrl+C to stop recording. proxymock writes everything to ./proxymock/, organized by hostname:
proxymock/recorded-2026-03-23_17-46-16.052364Z/
  api.openai.com/
    2026-03-23_17-46-17.715171Z.md   # POST /v1/chat/completions (triage)
    2026-03-23_17-46-19.035111Z.md   # POST /v1/chat/completions (analysis)
    2026-03-23_17-46-21.262313Z.md   # POST /v1/chat/completions (response)
  localhost/
    2026-03-23_17-46-17.441256Z.md   # POST /api/run (inbound)
    2026-03-23_17-46-17.459801Z.md   # GET /tools/order/INC-4201 (outbound)
    2026-03-23_17-46-17.551216Z.md   # GET /tools/policy/return-policy-v2 (outbound)
    2026-03-23_17-46-17.661726Z.md   # GET /healthz (inbound)
For one ticket, the recording contains the inbound POST /api/run, two tool lookups, three LLM calls, and a health check. Each request/response pair is saved as its own markdown file with headers, body, and timing.
What’s Inside an RRPair File
Open any captured file and you’ll find a human-readable markdown document. Here’s the real triage call to OpenAI, recorded from the demo app:
### REQUEST ###
```
POST https://api.openai.com:443/v1/chat/completions HTTP/1.1
Accept: */*
Accept-Encoding: gzip, deflate
Authorization: Bearer sk-proj-...
Connection: keep-alive
Content-Type: application/json
Host: api.openai.com
User-Agent: python-httpx/0.28.1
```

```
{
  "model": "gpt-5.4-mini",
  "messages": [
    {
      "role": "system",
      "content": "You are an expert support ticket classifier for a SaaS e-commerce platform..."
    },
    {
      "role": "user",
      "content": "Ticket ID: INC-4201\nCustomer Tier: enterprise\nTicket Content:\nOur checkout has been down for 6 hours. We have a $47K order stuck and Q4 inventory restock is blocked. 12 users affected."
    }
  ],
  "response_format": {
    "type": "json_object"
  },
  "temperature": 0.2,
  "max_completion_tokens": 2048
}
```

### RESPONSE ###
```
HTTP/1.1 200 OK
Content-Type: application/json
Openai-Organization: speedscale
Openai-Processing-Ms: 550
X-Ratelimit-Remaining-Tokens: 3999717
```

```
{
  "id": "chatcmpl-DMddynlfKPUkAJiSCbZ7qJPmzJKpk",
  "object": "chat.completion",
  "created": 1774287978,
  "model": "gpt-5.4-mini-2026-03-17",
  "choices": [
    {
      "index": 0,
      "message": {
        "role": "assistant",
        "content": "{\"severity\":\"critical\",\"category\":\"technical\",\"urgency_score\":10,\"escalation_required\":true,\"affected_component\":\"checkout and order processing\",\"customer_sentiment\":\"urgent\"}"
      },
      "finish_reason": "stop"
    }
  ],
  "usage": {
    "prompt_tokens": 263,
    "completion_tokens": 42,
    "total_tokens": 305
  }
}
```

### SIGNATURE ###
```
http:host is localhost
http:method is POST
http:queryparams is -NONE-
http:requestBodyJSON is {"max_completion_tokens":2048,"messages":[...],...}
http:url is /v1/chat/completions
```

### METADATA ###
```
direction: OUT
uuid: 247ec579-40b9-4a35-b77b-4e7b6461a38f
ts: 2026-03-23T17:46:17.715171Z
duration: 1256ms
```
This is the real OpenAI response from the demo app. gpt-5.4-mini classified INC-4201 as critical, assigned urgency 10, and returned the real token counts for that request. The SIGNATURE block is the important bit for mocking: proxymock uses it to decide which recorded response to return.
That file format is the part I like most. It is plain markdown, so you can diff it in Git, review it in a merge request, and edit it by hand when you need an edge case. If you’re coming from WireMock or MockServer, the workflow is very different; WireMock vs MockServer vs Proxymock goes deeper on that comparison.
Step 2: Mock LLM Providers
Now replay the outbound traffic as a mock server:
proxymock mock \
  -- uvicorn app.main:app --host 127.0.0.1 --port 8000
proxymock loads the RRPair files from ./proxymock/, builds a signature index, and starts serving matching responses:
Listeners:
Provider HTTP  listening on port 58070
Provider HTTPS listening on port 58069

mocking traffic sent from your app to proxy port 4140
recorded mock requests / responses are being written to proxymock/results/mocked-2026-03-23_17-45-09.893569Z
Press ctrl-c to interrupt

────────────────────────────────────────────────────────────────────────────────────

INFO  started user application  ( command:uvicorn app.main:app --host 127.0.0.1 --port 8000 pid:83713 )
When the backend calls api.openai.com/v1/chat/completions, proxymock matches that request against the recorded signature and returns the saved response, including the original body and token counts.
Submit the same ticket:
curl -X POST http://localhost:4143/api/run \
  -H "Content-Type: application/json" \
  -d '{
    "provider": "openai",
    "input": {
      "ticket_id": "INC-4201",
      "customer_tier": "enterprise",
      "transcript": "Our checkout has been down for 6 hours..."
    }
  }'
You get back the same triage result the real run produced:
{
  "provider": "openai",
  "model": "gpt-5.4-mini",
  "output": {
    "summary": "Checkout is blocked by a likely post-deployment regression in the order-processing flow, preventing a high-value enterprise order from completing.",
    "severity": "critical",
    "recommended_action": "Escalate immediately to the on-call incident commander and confirm whether a rollback of the impacted deployment is in progress.",
    "root_cause": "The most likely cause is a post-deployment regression in the checkout/order-processing path...",
    "response_draft": "Hello Apex Retail Solutions team,\n\nI'm sorry for the disruption this has caused. We understand your checkout has been down for 6 hours, the $47K order is blocked, and this is delaying your Q4 inventory restock for 12 affected users..."
  },
  "steps": [
    {
      "name": "triage",
      "prompt_tokens": 263,
      "completion_tokens": 42,
      "cost_usd": 0.000386,
      "duration_ms": 1386
    },
    {
      "name": "analysis",
      "prompt_tokens": 826,
      "completion_tokens": 426,
      "cost_usd": 0.002537,
      "duration_ms": 3461
    },
    {
      "name": "response",
      "prompt_tokens": 815,
      "completion_tokens": 458,
      "cost_usd": 0.002672,
      "duration_ms": 2982
    }
  ],
  "tool_calls": [
    { "name": "lookup_order", "status": "ok", "duration_ms": 210 },
    { "name": "lookup_policy", "status": "ok", "duration_ms": 43 }
  ],
  "total_tokens": 2830,
  "cost_usd": 0.005595,
  "error": null
}
Same severity, same analysis, same drafted response, same per-step token accounting. The backend still behaves as if it talked to the provider, but neither OpenAI nor the tools service is being called.
Passthrough for unrecorded routes
If the app makes a request that is not in the recording, proxymock can pass it through. That is useful when you have only recorded one provider so far and still want live traffic for the others while you are filling out coverage.
Simulating real-world latency
LLM calls are often the slowest part of the request path. By default the mock returns immediately, which is convenient but not always what you want. To preserve recorded timing:
proxymock mock --mock-timing recorded \
  -- uvicorn app.main:app --host 127.0.0.1 --port 8000
You can also scale the delay up with --mock-timing 5x if you want to exercise timeout handling or queue buildup under slower provider responses.
Step 3: Replay Inbound Traffic as Tests
The recording includes both outbound traffic and the inbound requests sent to your app. That means the same snapshot can become a regression test:
# Terminal 1: start the app with mocked dependencies
proxymock mock -- uvicorn app.main:app --host 127.0.0.1 --port 8000

# Terminal 2: replay inbound traffic as tests
proxymock replay --test-against http://localhost:4143
proxymock replays those inbound requests against the running app and compares the responses. If a prompt change shifts the triage result from critical to high, replay surfaces it immediately.
Load test your LLM pipeline
This matters even more for concurrency testing. You may want to know whether the backend can handle 50 or 100 tickets at once, but doing that against live providers is usually too expensive to leave in the normal development loop.
proxymock replay \
  --test-against http://localhost:4143 \
  --vus 50 \
  --for 120s
That runs 50 virtual users for two minutes against the full FastAPI path: request parsing, async orchestration, connection pooling, JSON handling, and response generation. The providers see none of it.
CI/CD assertions
You can also fail CI on simple assertions:
proxymock replay \
  --test-against http://localhost:4143 \
  --fail-if "latency.p95 > 2000" \
  --fail-if "requests.failed != 0"
If any replayed request fails, or if p95 latency drifts past two seconds, the command exits non-zero.
Recording Multiple Providers
The demo supports OpenAI, Anthropic, Gemini, and Grok. Record a session with each:
# Run the same ticket against each provider
for provider in openai anthropic gemini xai; do
  curl -X POST http://localhost:4143/api/run \
    -H "Content-Type: application/json" \
    -d "{
      \"provider\": \"$provider\",
      \"input\": {
        \"ticket_id\": \"INC-4201\",
        \"customer_tier\": \"enterprise\",
        \"transcript\": \"Our checkout has been down for 6 hours...\"
      }
    }"
done
Now your proxymock/ directory has recordings for all four providers:
proxymock/recorded-2026-03-23_21-24-22.194101Z/
  api.anthropic.com/
  api.openai.com/
  api.x.ai/
  generativelanguage.googleapis.com/
  localhost/
At that point you can test provider switching, fallback logic, or side-by-side output differences without putting live credentials into CI.
It Works with Any Language
The demo backend happens to be Python, but the approach is not Python-specific:
# Node.js Express
proxymock record --app-port 3000 -- npm start

# Java Spring Boot
proxymock record --app-port 8080 -- ./mvnw spring-boot:run

# .NET
proxymock record --app-port 5000 -- dotnet run
The general mechanism is the same across stacks: run the app behind a local proxy, capture the traffic once, then reuse it. In Python that works cleanly with httpx and requests. In Java, proxymock also sets the JVM proxy and TLS flags for the child process.
Database mocking
proxymock supports Postgres and MySQL via reverse proxy mapping:
proxymock record \
  --map 65432=postgres://localhost:5432 \
  -- uvicorn app.main:app --host 127.0.0.1 --port 8000
Your app points at localhost:65432 instead of 5432, and proxymock records the database exchange the same way it records HTTP traffic. In mock mode you get deterministic responses without a live Postgres instance.
Browse Traffic with the Terminal UI
The inspect command launches a TUI for browsing recorded traffic:
proxymock inspect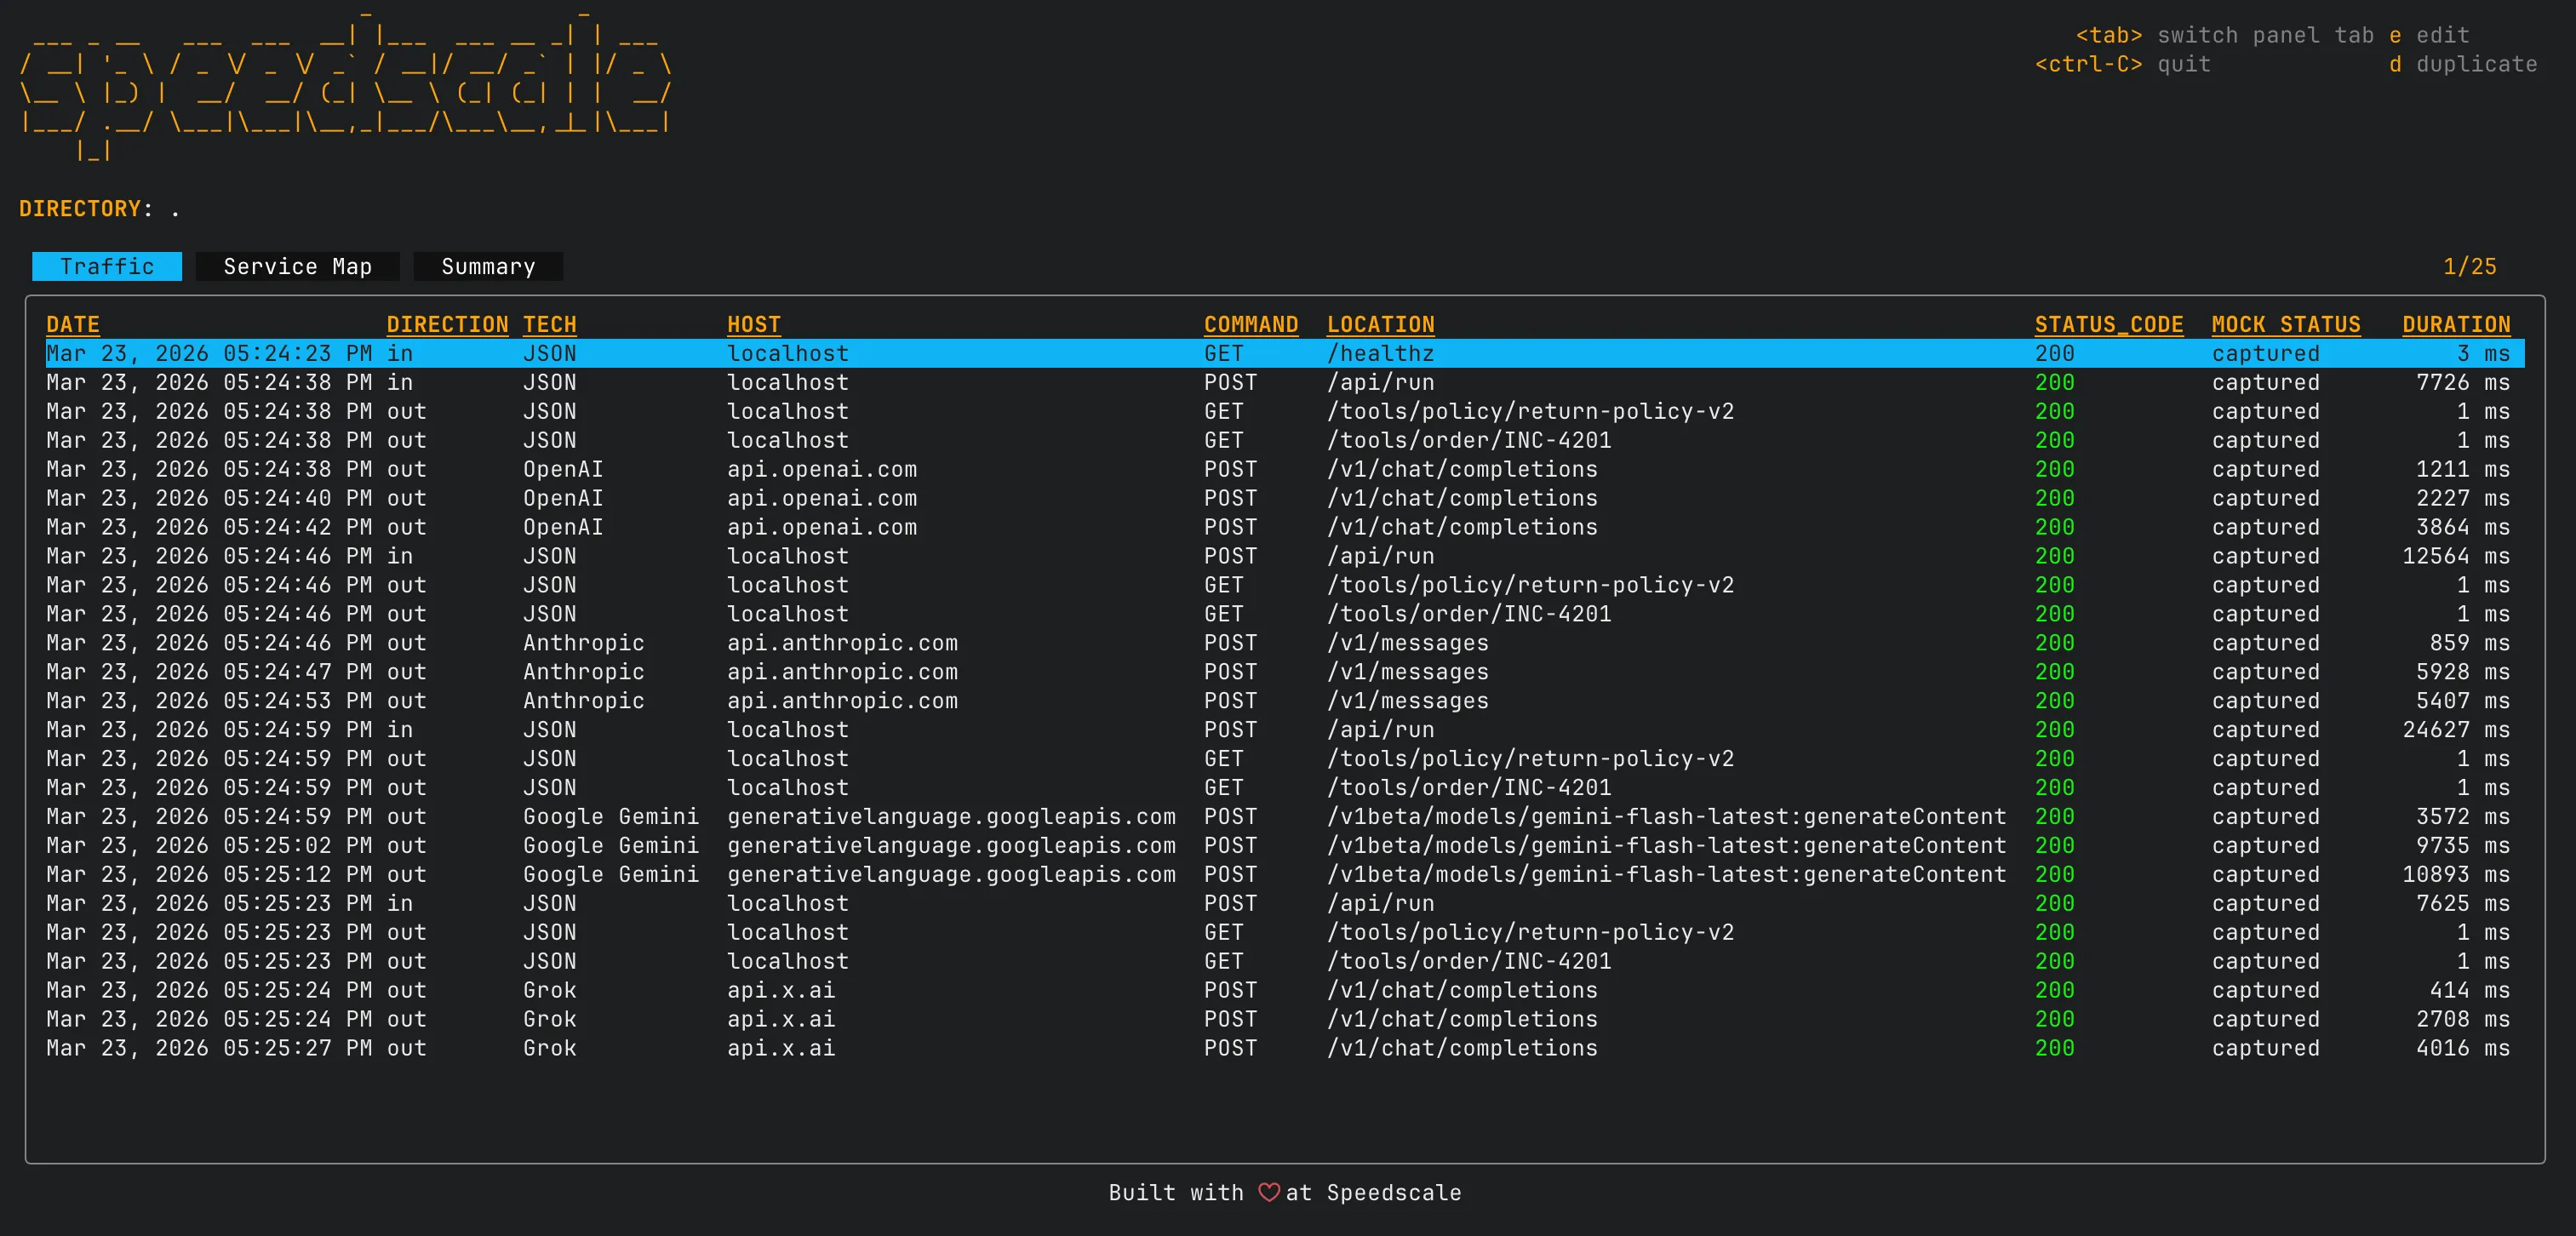
Navigate with the arrow keys and press e to open an RRPair in your editor. It is a practical way to inspect what the model actually returned, scrub sensitive headers, or tweak a response body to simulate an edge case.
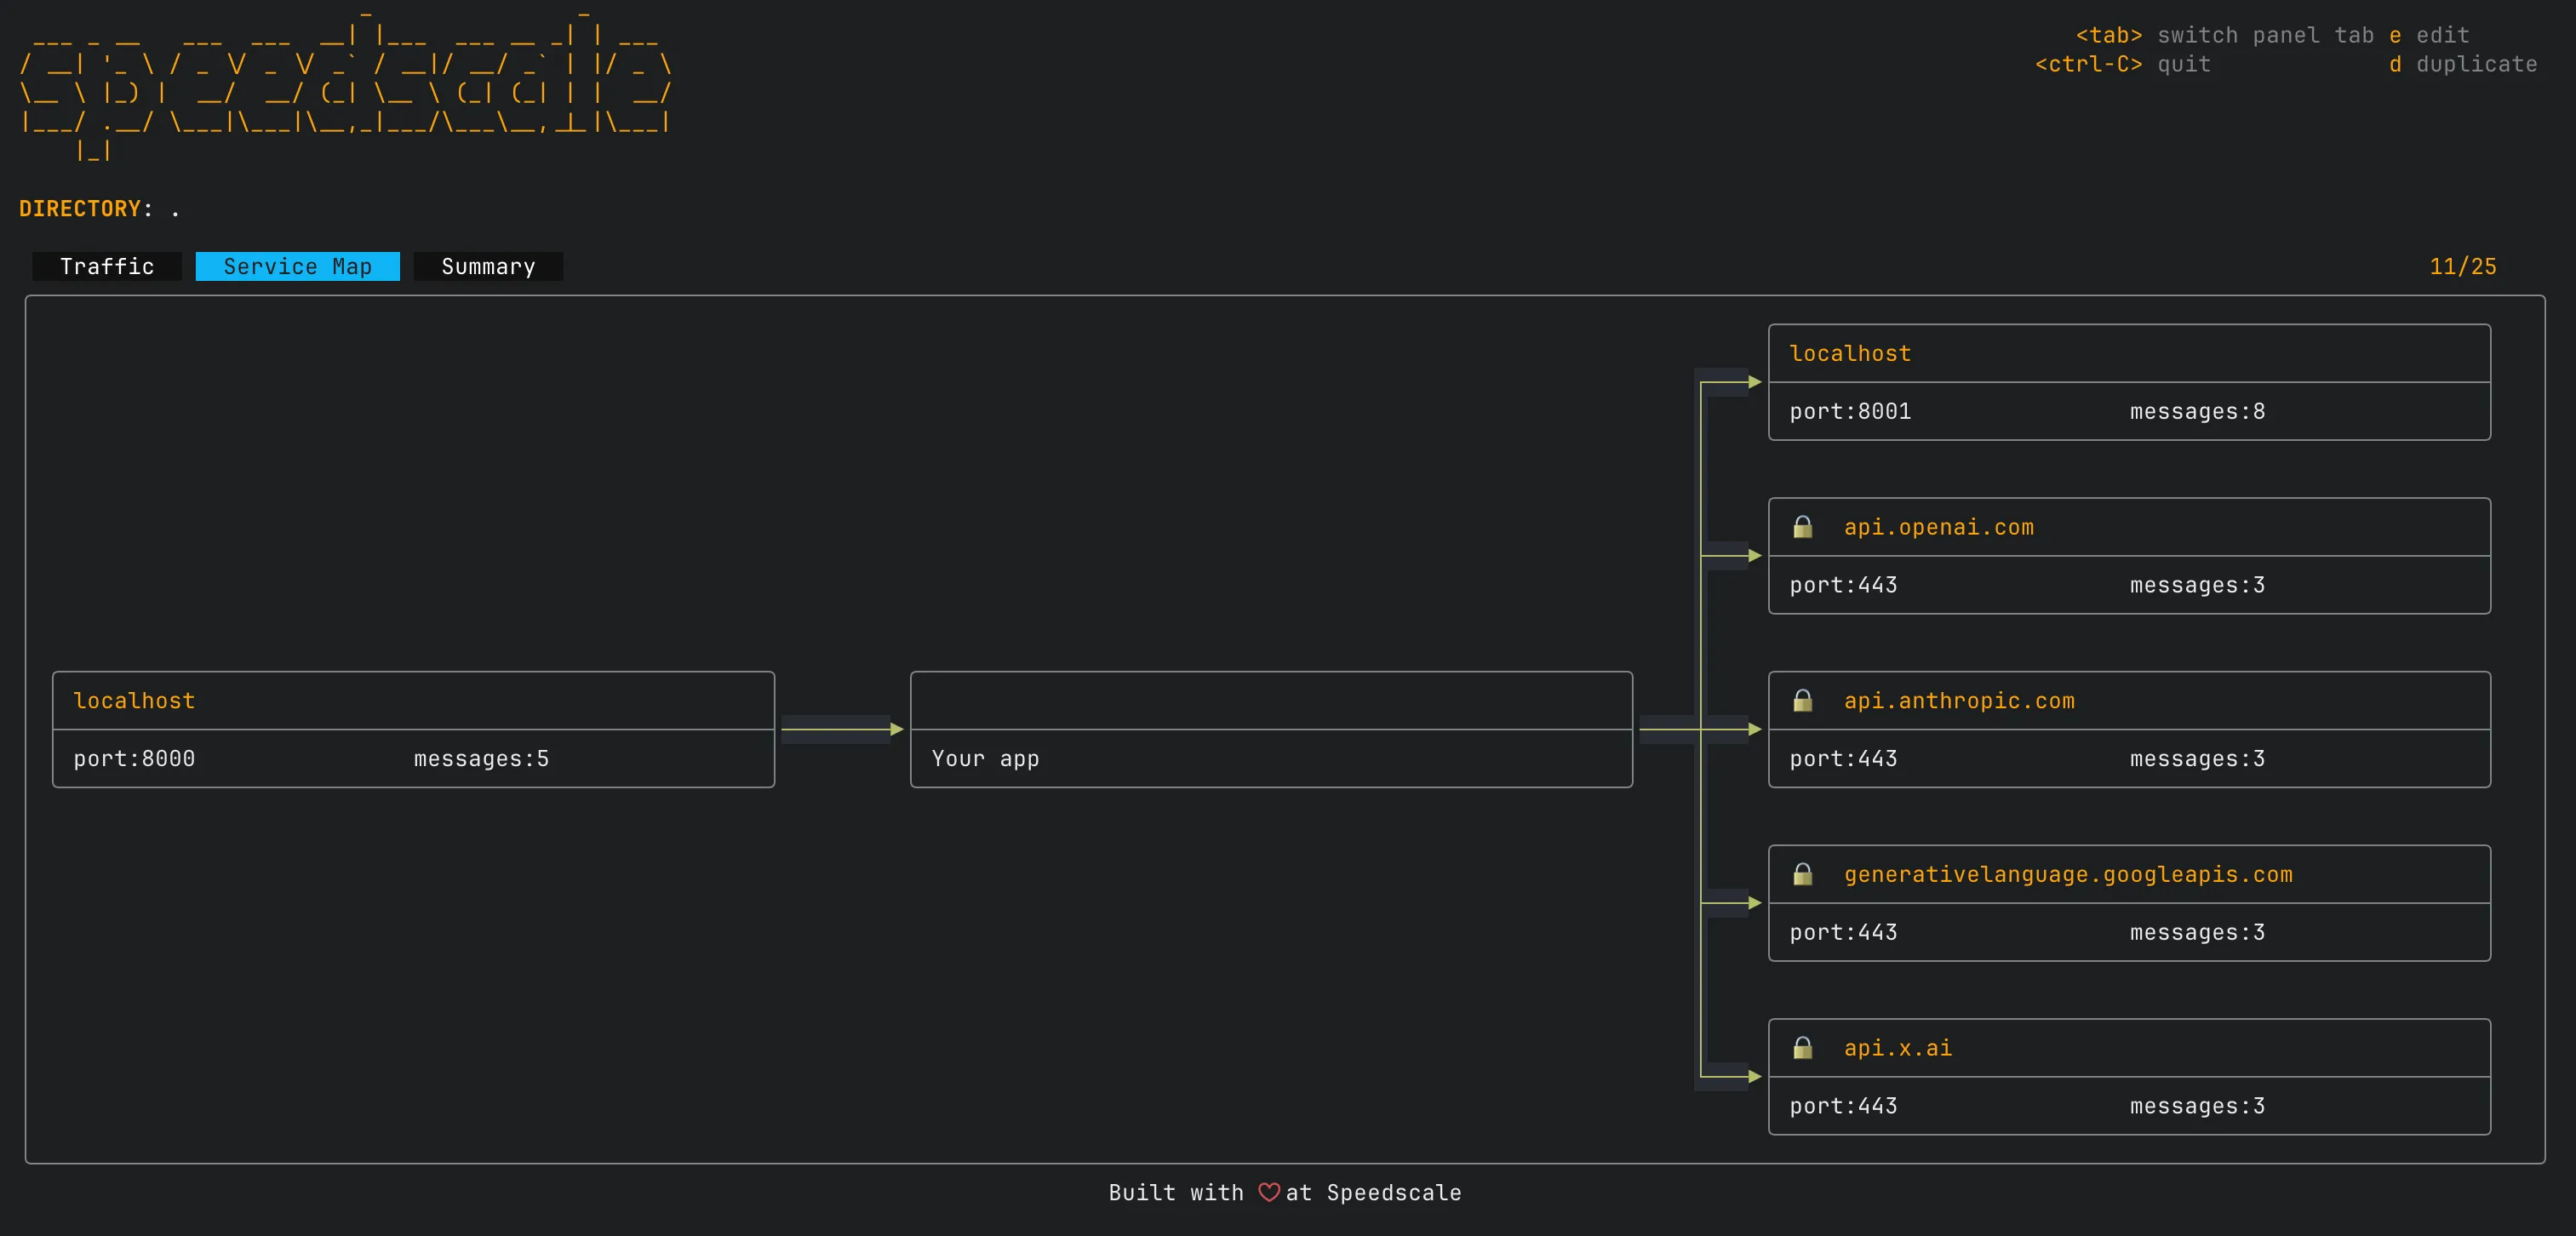
The service map view shows how your app connects to external dependencies and how traffic flows between them:
Try it without any data:
proxymock inspect --demoCI/CD Integration
Here is a minimal CI script for the triage backend:
#!/usr/bin/env bash
set -e

# Install proxymock
sh -c "$(curl -Lfs https://downloads.speedscale.com/proxymock/install-proxymock)"
export PATH=${PATH}:${HOME}/.speedscale

# Install Python dependencies
cd backend
pip install -r requirements.txt

# Replay tests with mocked LLM providers and tools
# No API keys needed -- all outbound traffic is served from recordings
proxymock replay \
  --in ./proxymock/ \
  --test-against localhost:8000 \
  --fail-if "latency.p95 > 2000" \
  --fail-if "requests.failed != 0" \
  -- uvicorn app.main:app --host 127.0.0.1 --port 8000
That job replays the recorded requests, starts the app under test, and fails on latency or request errors. No provider API keys are required in CI because the outbound calls are served from the recording. For more on pipeline setup, see Automating API Mocks in Your CI Pipeline.
For a complete example with GitHub Actions YAML, see the proxymock CI/CD guide.
Why This Beats Hand-Written Mocks
| Hand-Written Mocks | proxymock | |
|---|---|---|
| LLM response mocking | Impractical to fake accurately | Record the real response once |
| Setup time | Hours per dependency | One record command |
| Data fidelity | Whatever you imagine | Actual API responses with token counts |
| Schema drift | Silent divergence | Re-record to update |
| CI cost | Real API calls on every run | $0 after initial recording |
| Load testing | Separate tool, $400/run for LLMs | --vus and --for flags, free |
| Database mocking | Separate tool or Docker | --map flag |
| Readable format | JSON stubs, framework-specific | Markdown files, git-friendly |
| Language lock-in | Framework-specific (pytest mocks, etc.) | Works with any language |
The Workflow
- Record one real run against your LLM providers and tools
- Mock those dependencies from the recording so tests are free and fast
- Replay inbound traffic as tests to verify your pipeline still works
- Commit the
proxymock/directory so the recording travels with the code - Re-record when you change prompts, switch models, or add providers
Each RRPair file is just another artifact in the repo. You can diff it across branches to see how a prompt change affected the response, review it in a merge request, and edit it directly when you need to simulate failures like rate limiting or malformed JSON.
Get Started
If you want to try the workflow quickly, start here:
brew install speedscale/tap/proxymock
proxymock record --app-port 8000 \
  -- uvicorn app.main:app --host 127.0.0.1 --port 8000
The quickstart guide walks through the full workflow. The CLI reference documents every command and flag.
If you want a broader comparison, Postman alternatives covers where proxymock fits alongside other tooling.
If you need to share recordings across a team or move them into a larger workflow, proxymock cloud push snapshot is the next step.